


 Arguments


Recent Comments
Prev 1919 1920 1921 1922 1923 1924 1925 1926 1927 1928 1929 1930 1931 1932 1933 1934 Next
Comments 96301 to 96350:
-
RW1 at 15:28 PM on 20 February 2011A Swift Kick in the Ice
No one has answered my question: If 'global warming' is causing the Artic sea ice to melt, why isn't the Antarctic sea ice decreasing as well? Why has it even expanded in recent years? -
muoncounter at 15:24 PM on 20 February 2011Meet The Denominator
Alex, "you're all understandably exasperated with this," Your Atlas cite should indeed have been the end of this train wreck. I'm curious: After the last few comments, do you have any further thoughts on the loss of credibility aspect of your comment here? -
Marcus at 15:21 PM on 20 February 2011Meet The Denominator
"I've spoken to the publisher, two editors of the journal and six authors who all confirmed that E&E is peer-reviewed. It is amazing to see what lengths you will go to misrepresent a journal you do not like. Are there scholarly peer-reviewed journals not listed by the ISI? What is considered the gold standard is subjective." Again with your selective skepticism, PT. Have you asked anyone from *outside* of E&E whether or not their peer-review standards are up to accepted standards? No, you merely rely on those who edit the journal & a mere handful of authors who've been published there (indeed, probably the only "authors" who've even bother submitting to E&E)-none of whom are going to tell you otherwise. The fact remains that there are very few-if any-reputable scientists that will try & get their work published outside of ISI listed journals, because all of the scientific community recognize that only journals with the highest standard of peer-review will get accepted. E&E still hasn't made the cut, & only a mere handful of scientists actually submit work for publication within it-in itself a damning indictment-as is the fact that no E&E papers seem to ever get cited in papers published outside of E&E (talk about "confirmation bias"). Your pathetic attempts to claim that standards in science are merely "subjective" continues to reveal nothing more than your complete *ignorance* of science. Which is why everything you say here about science is complete & utter garbage. Take it from someone who actually *works* in the scientific community, & who knows junk science when he sees it-& the "work" of Beck & MacLean definitely fit that bill, no matter how "subjective" a standard you apply. "Incorrect, the existence of a criticism does not mean a paper is debunked." Seriously, Poptech, your reading skills are *abysmal*. I said, not merely criticized, but utterly *debunked*-i.e. "proven to be factually incorrect." Beck's & MacLean's work have both been *proven* to be factually incorrect, but you've still left them on your list-just because they support your supposed skepticism. -
RW1 at 15:14 PM on 20 February 2011A Swift Kick in the Ice
Marcus, "My point, RW1, is that you're refusing to be skeptical of a newspaper article, which sounds to be entirely based on anecdotal evidence, & covers just a *single year*-whilst being hugely skeptical of mountains of data covering several *decades*-more than enough to smooth out year to year variability. Indeed, current ice extent is lower than the average plus *two standard deviations*-so very much outside of natural variability for the last 10 years. That's not skepticism, that is *denial* of the *facts*." You're misunderstanding the context and implications of that quote I posted. I make no claim that it proves anything - only that it's suggestive of large variability in the Arctic. I'm not denying any facts either, and I'm well aware of the record as it is. I'm simply saying 30 years isn't enough data to know whether the downward trend is anything unusual, or more importantly if it's even the result of global warming, let alone CO2 induced anthropogenic global warming. -
Jue1234 at 15:14 PM on 20 February 2011Models are unreliable
Thanks KR and Tom, I'll look at your links -
RW1 at 15:02 PM on 20 February 2011A Swift Kick in the Ice
Tom (RE: 103), You're first chart in post 55 didn't give quantifications of the insolation, which is why it was unclear to me. The one on Wikipedia does. I wrongly assumed the brightest color was the equivalent of maximum insolation (or 1366 W/m^2). So I'm conceding that my point about reduced insolation as you get closer and closer to the poles was/is incorrect. -
RW1 at 14:48 PM on 20 February 2011A Swift Kick in the Ice
Tom (RE: 103), It is, however, transparently obvious that the chart includes the effects of angles of incidence for if it did not it would not show zero insolation during winter at the poles." Angle relative to what? The spherical shape of the Earth or the angle of the tilt? Regardless, I guess since the solar constant is about 1366 W/m^2 and the maximum in the chart is only about 550 W/m^2, that would indicate that angle incidence is factored in. -
muoncounter at 14:46 PM on 20 February 2011A Swift Kick in the Ice
Norman, A picture is worth a thousand words; a video must be worth a thousand pictures. Here's a link to an ice reconstruction video (originally posted here), which shows the age of the ice in color. Old ice (orange and red) is thicker than new ice (blue). And there's a lot less old ice. Riddle me this: What mechanism would produce one year old ice that is thicker than older ice? What mechanism would produce thickening ice at the same time as ice extent is so rapidly decreasing? -
peter prewett at 14:37 PM on 20 February 2011Deep ocean warming solves the sea level puzzle
Will the melting of the Tundra make a contribution to sea level rise?Moderator Response: [Daniel Bailey] Directly (melt water raising sea levels), maybe a bit (haven't seen any papers quantifying that. But a Wiki search finds that permafrost accounts for 0.022% of total water). Indirectly, absolutely (see this paper - nice discussion of it by Romm over at Climate Progress). -
Marcus at 14:34 PM on 20 February 2011A Swift Kick in the Ice
My point, RW1, is that you're refusing to be skeptical of a newspaper article, which sounds to be entirely based on anecdotal evidence, & covers just a *single year*-whilst being hugely skeptical of mountains of data covering several *decades*-more than enough to smooth out year to year variability. Indeed, current ice extent is lower than the average plus *two standard deviations*-so very much outside of natural variability for the last 10 years. That's not skepticism, that is *denial* of the *facts*. -
WheelsOC at 14:32 PM on 20 February 2011Skeptic arguments about cigarette smoke - sound familiar?
If "homeopathy" were the mechanism, then those who didn't smoke would be the ones getting the strongest protection from tobacco's medicinal properties. That's how homeopathy works, you dilute the substance in water and it gets stronger as the solution gets weaker, until the recommended level of dilution is such that there's probably no trace of the original ingredients in the water at all. -
Norman at 14:27 PM on 20 February 2011A Swift Kick in the Ice
#58 Tom Curtis You posted the PIOMAS graph for arctic ice volume that shows a steep decline in recent years. I was researching this a bit. You do realize that this graph is based upon some calculations and not based on empirical measurements of ice volume? From their site: "PIOMAS is a numerical model with components for sea ice and ocean and the capacity for assimilating observations. For the Ice Volume simulations shown here, sea ice concentration information from the NSIDC near-real time product are assimilated into the model to improve ice thickness estimates. Atmospheric information to drive the model, specifically wind, surface air temperature, and cloud cover to compute solar and long wave radiation are specified from the NCEP/NCAR reanalysis. The Pan-Arctic ocean model is forced with input from a global ocean model at its open boundaries." It seems another version disagrees with this one. PIP2 from the Navy show a totally different view of arctic ice volume. Two models for Arctic ice volume, which one is correct or are either of them right?. -
Tom Curtis at 14:25 PM on 20 February 2011A Swift Kick in the Ice
RW1 @100, the formulae can be found here along with a variant version of the chart using different units. It is, however, transparently obvious that the chart includes the effects of angles of incidence for if it did not it would not show zero insolation during winter at the poles. As this discussion has degenerated to the point where your sole argument is to simply disbelieve any contrary data, I see no real point in continuing it. -
muoncounter at 14:21 PM on 20 February 2011A Swift Kick in the Ice
RW1: The 1922 ice extent low can be seen in the Walsh data graph. That was above 10 million sq km; the low extent last year was 4.8 million sq km. How do you think your seals felt about that? -
Tom Curtis at 14:16 PM on 20 February 2011A Swift Kick in the Ice
RW1 @97, from further up the thread. -
RW1 at 14:14 PM on 20 February 2011A Swift Kick in the Ice
Tom (RE: 96), "That means they do include the effect of angle of incidence on insolation," I don't think so. How would it account for this? Perhaps I'm wrong, but can you point me to a source that verifies this? I understand that they do not include the effect of clouds. -
Tom Curtis at 14:11 PM on 20 February 2011A Swift Kick in the Ice
RW1 @84. Yes, the pole is only shown to have more insolation than the arctic circle for about three weeks on that chart. But it is also shown to have at least the same insolation for 2 months as the the arctic circle receives for only a month and a half; and the same for over three months as the arctic circle recieves over the same interval. For three months of the year, the pole receives either as much or more insolation on any given day as any point on the arctic circle. Those three months are the period of maximum insolation, and also the time of minimum albedo. Over the rest of the year the a point on the periphery of the arctic circle recieves more insolation, but total daily insolation during that period is half or less what it is in summer. -
muoncounter at 14:10 PM on 20 February 2011A Swift Kick in the Ice
RW1: "the past 3 years I referenced ... I simply pointed out a contradiction to that claim." Three years does not a contradiction make; there is always noise in these data. If 3 years of data is all you have to point to, I'd suggest finding another position on the issue. "I'm not familiar with the Walsh historic time series" Whether you accept the Walsh data or not is irrelevant, except that you're attempting to create the perfect block: 'There are only 30 years of satellite data. 30 years is not enough data. Repeat.' Look at the PIOMASS graph. Can you objectively describe those curves as anything but concave down? That would mean the rate of change of ice mass is accelerating in the negative direction. -
Rob Honeycutt at 14:08 PM on 20 February 2011Meet The Denominator
Poptech... "Rob, do you support that none of these numbers 954,000, 850,000, 189,553 or 17,761 represent the number of peer-reviewed papers that explicitly or implicitly endorse "anthropogenic global warming"?" The exercise here was merely to show people that they can't just look at one number, such as 31,000 scientists or 850 papers, and think that tells them anything at all. They have to put the number in context. Whether 987K is correct or 17k is correct, I don't really care. Any of these denominators still makes your number very small. And don't say "this has not been established" again for the 300th time. It's utterly foolish to entertain for even 2 seconds that 850 papers represents a significant portion of climate research. And that's my last word in this thread. I'm done. -
RW1 at 14:05 PM on 20 February 2011A Swift Kick in the Ice
Rick G (RE: 78), "The Antarctic ice cap is on a land mass with an average elevation 7500 ft surrounded by ocean. Conversely, the Arctic is surrounded by land masses and is sea ice at sea level. Why would you expect them to be following the same trend?" I know. I'm mainly referring to the ice extent over the sea, which has not decreased and has even increased slightly, especially in recent years. If 'global warming' is causing the Artic sea ice to melt, why isn't it doing the same in the Antarctic? -
Tom Curtis at 14:03 PM on 20 February 2011A Swift Kick in the Ice
RW1 85 & 89, from this question it becomes evident that you are not even reading the points you are trying to rebut. To answer your question, they show TOA insolation. That means they do include the effect of angle of incidence on insolation, along with the effect of seasons. They do not include the effect of clouds. This is also true of the second graph @55. In contrast, the third graph @55 and the graph @83 show insolation at the surface, and hence include the average effect of clouds. They show between 10% and 20% variation between 60 degrees north and the poles, ie, the same degree of variation over 30 degrees that in mid-latitudes you would expect over ten. @88, you can believe what you want. However, I did not simply rebut your limited source of information. I looked up further information based upon multiple annual reports of sea ice extent, not just for one year, but for every year between 1750 and 2002. That information showed that 1922 had a low sea ice extent for its time, but only an average sea ice extent for the later half of the 20th century, and a higher sea ice extent than every year to date in the 21st Century. That you choose to ignore that information is very telling. @87, you have got to be kidding. The report Robb found contains every point yours made, and was printed in the fall of 1922, ie, after the minimum sea ice extent of 1922. You simply do not like the confirmation that it was only one ship, and at only one location that ice free water was found to 81.5 degrees north. -
RW1 at 13:59 PM on 20 February 2011A Swift Kick in the Ice
Marcus, "This is what I love about these so-called "skeptics"-they stubbornly retain a "skeptic" stance, in the face of *mountains* of data & observations, yet said "skepticism" evaporates in the face of a *single* newspaper that relies solely on *anecdotal* evidence." The point of the story is it's simply consistent with large Artic variability nearly 90 years ago. However, it's hardly the basis for my skepticism.Moderator Response: [DB] Fixed html tag. -
RW1 at 13:54 PM on 20 February 2011A Swift Kick in the Ice
muoncounter, "Unfortunately, this situation is very serious indeed. So, yes, rest assured, I am serious about this issue." Sorry, I don't understand you then. I'm not claiming the past 3 years I referenced represents any indication of any coming trend or any trend at all for that matter. You claimed that the downward trend was 'accelerating'. I simply pointed out a contradiction to that claim. As far as the first graph in that post, I'm not familiar with the Walsh historic time series, nor what method was used to get the data, though I think I can safely assuming isn't anywhere near as accurate as satellite measurements. -
Rob Honeycutt at 13:48 PM on 20 February 2011A Swift Kick in the Ice
RW1..."I don't think those articles are the source of what I posted." According to Anthony Watts it is. -
Marcus at 13:48 PM on 20 February 2011A Swift Kick in the Ice
"I think the 'story' speaks for itself though." This is what I love about these so-called "skeptics"-they stubbornly retain a "skeptic" stance, in the face of *mountains* of data & observations, yet said "skepticism" evaporates in the face of a *single* newspaper that relies solely on *anecdotal* evidence. Come on RW1, where's your skepticism now? That sounds more like *denial* where I'm from. -
RW1 at 13:45 PM on 20 February 2011A Swift Kick in the Ice
Tom (RE: 77), You do understand that the average insolation hitting the top of the atmosphere is not the same as the average insolation hitting the surface (even assuming clear sky conditions), right? -
muoncounter at 13:39 PM on 20 February 2011A Swift Kick in the Ice
RW1: "Are you serious?" Unfortunately, this situation is very serious indeed. So, yes, rest assured, I am serious about this issue. "I'm not the one claiming any significant trends," Then your prior post was purely facetious? "outside the range of natural variability." The 'range of natural variability' is depicted in the first hundred years of the first graph here. Is there anything other than this seal story, preferably in the form of a published scientific study, that substantiates this 'range' of yours? Oh, wait, there was more ice in the distant past. And less ice in the distant past. So I guess that proves your point? -
RW1 at 13:38 PM on 20 February 2011A Swift Kick in the Ice
Tom (RE: 77), Is that first chart in your post #55 insolation at the surface or the top of the atmosphere? In other words, does it factor in the decreasing angle as you get closer and closer to the pole, which spreads the incoming sunlight over a larger area, reducing it's magnitude at the surface? -
RW1 at 13:31 PM on 20 February 2011A Swift Kick in the Ice
Tom, "However, from what we do know from the information you presented, there is no reason to believe the summer 1922 ice extent was any greater than the February 19th ice extent in 2011." If that's what you want to believe, fine. I disagree, but I can't really argue since there isn't enough information to constitute proof. I think the 'story' speaks for itself though. -
RW1 at 13:26 PM on 20 February 2011A Swift Kick in the Ice
Rob Honeycutt (RE: 81) "Doing a little research on that "US Weather Bureau" report you posted at 59. It seems it's been making the rounds a lot on the internet and has gone through quite a bit of massaging. Here is the original article the report obviously comes from. Courtesy of Anthony Watts." I don't think those articles are the source of what I posted. -
RW1 at 13:24 PM on 20 February 2011A Swift Kick in the Ice
muoncounter (RE: 76), "But in a prior comment, you take some significance in what you describe as 'the past three years'??? Sorry, your seal story does not suggest 'a large degree of variability' -- because 1 year is hardly enough data to do that. Are you serious? I'm not the one claiming any significant trends, let let alone any trends outside the range of natural variability. The point of the 'story' is it's consistent with a large degree of Artic variability from year to year. That's all. -
RW1 at 13:17 PM on 20 February 2011A Swift Kick in the Ice
Tom (RE: 77), Is that first chart in your post #55 insolation at the surface or the top of the atmosphere? -
RW1 at 13:09 PM on 20 February 2011A Swift Kick in the Ice
Tom (RE: 77), "So, whether you consider just summer insolation (as you now claim was your point) or annual average insolation (as you previously claimed was your point), you are simply wrong about this. Geometry is not very complex, but even its complexities appear to be to much for you in this discussion." OK, for a period of about 2 and half weeks (roughly 2/3rd of one month) the poles are getting more insolation than the rest of the Artic circle? Is this what you're claiming? That is how I'm interpreting that first graph in your post 55. -
Tom Curtis at 13:08 PM on 20 February 2011A Swift Kick in the Ice
TOP @74, it is well known that the Arctic receives a lot of energy by transport from lower latitudes, and in fact most of it by that transport in Winter. It does not follow that the greenhouse effect is negligible in the Arctic, nor that changes in the greenhouse effect have no impact on Arctic temperatures. On the contrary, the variation in outgoing longwave radiation with latitude is much smaller than the variation in incoming solar radiation, the difference being made up by the heat transport you mention. (See note below.)
Consequently the extent of the greenhouse effect is very important in determining arctic temperatures. An increase in the greenhouse effect will slow the escape of energy to space, thus raising temperatures.
(Note, the graph determines intervals on the x axis based on area, thus generating a non linear scale in terms of latitude. If a linear scale for latitude had been used, the near constant insolation at higher latitudes would be apparent. Scaled linearly, for example, the interval between the last two northern values would span from the current 60 degree north mark to the first "i" in "deficit".)
(See note below.)
Consequently the extent of the greenhouse effect is very important in determining arctic temperatures. An increase in the greenhouse effect will slow the escape of energy to space, thus raising temperatures.
(Note, the graph determines intervals on the x axis based on area, thus generating a non linear scale in terms of latitude. If a linear scale for latitude had been used, the near constant insolation at higher latitudes would be apparent. Scaled linearly, for example, the interval between the last two northern values would span from the current 60 degree north mark to the first "i" in "deficit".)
-
Rob Honeycutt at 13:06 PM on 20 February 2011A Swift Kick in the Ice
The seals finding the water too warm was a clue. -
Rob Honeycutt at 13:05 PM on 20 February 2011A Swift Kick in the Ice
RW1... Doing a little research on that "US Weather Bureau" report you posted at 59. It seems it's been making the rounds a lot on the internet and has gone through quite a bit of massaging. Here is the original article the report obviously comes from. Courtesy of Anthony Watts. -
Tom Curtis at 12:51 PM on 20 February 2011A Swift Kick in the Ice
Sorry, the first chart did not come out. It can be found here. -
Tom Curtis at 12:49 PM on 20 February 2011A Swift Kick in the Ice
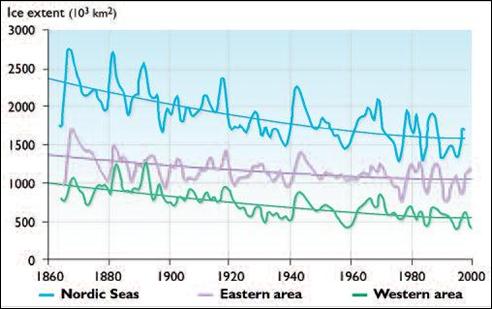
RW1 @75, I am happy to agree that we don't know all the specifics, which then begs the question as to why you presented the information. However, from what we do know from the information you presented, there is no reason to believe the summer 1922 ice extent was any greater than the February 19th ice extent in 2011. The information you are in fact looking for is this: (Sea Ice extent in Nordic Seas)
Before you get too excited about all those low values, you should notice that 2002 is the last point on the graph, and and the second lowest point is 2001. So clearly 2007 and 2010 have fallen of the chart by comparison. You will also note that 1922 is only about average for post 1950 ice extents, and well above the recent figures.
For comparison, here is equivalent data for other regions of the Arctic (for April). As you can see, the Nordic sea shows the greatest variability, so your case will not be improved by appealing to other regions.
(Sea Ice extent in Nordic Seas)
Before you get too excited about all those low values, you should notice that 2002 is the last point on the graph, and and the second lowest point is 2001. So clearly 2007 and 2010 have fallen of the chart by comparison. You will also note that 1922 is only about average for post 1950 ice extents, and well above the recent figures.
For comparison, here is equivalent data for other regions of the Arctic (for April). As you can see, the Nordic sea shows the greatest variability, so your case will not be improved by appealing to other regions.
 Moderator Response: [DB] Fixed broken image URL.
 -
RickG at 12:41 PM on 20 February 2011A Swift Kick in the Ice
RW1: 30 years is hardly enough data to show whether this is anything significant or just random noise of natural variability. Then why do you keep trying to make something out of year to year anomalies? RW1: Why hasn't the Antarctic shown the same trend? The Antarctic ice cap is on a land mass with an average elevation 7500 ft surrounded by ocean. Conversely, the Arctic is surrounded by land masses and is sea ice at sea level. Why would you expect them to be following the same trend? -
Eric (skeptic) at 12:38 PM on 20 February 2011Skeptic arguments about cigarette smoke - sound familiar?
Smoking is unhealthy in typical quantities but may have homeopathic qualities in very small quantities explaining the 'health smoker' anecdotes, see http://www.bmj.com/content/322/7280/203.2.full/reply#bmj_el_12322 for an anecdote (it's hard to find studies of homeopathy). One might think "if climate change doesn't kill you it makes you stronger". But that does not seem to be true for amphibians, see http://onlinelibrary.wiley.com/doi/10.1111/j.1365-2435.2006.01159.x/full. The analogy might be like this: occasional exposure to cigarette smoke is probably not harmful and may even be helpful; likewise occasional exposure to severe weather probably builds resilience. Constant exposure is almost certainly bad in both cases since there is no time to recover and strengthen. -
Rob Honeycutt at 12:34 PM on 20 February 2011Meet The Denominator
One might also note that, according to the same paper 2000 new papers a year are being published. That adds at least another 10k to the number. "...the phrase "climate change" does not mean it explicitly endorses "anthropogenic global warming"..." It doesn't have to. We are putting your 850 papers into the broader context of the full body of climate science. -
Tom Curtis at 12:27 PM on 20 February 2011A Swift Kick in the Ice
RW1 @68, on the northern summer solstice, at the North Pole, the sun is approximately 23.5 degrees above the horizon, the equivalent to being at 4:30 PM in the tropics, and it remains at that elevation for 24 hours. On the same day at the arctic circle, the sun ranges in elevation from 0 to 47 degrees over the horizon over the course of the day. The result is that there is slightly more insolation at the pole than on the arctic circle. This can be seen in the first chart @55, although you will need to look closely to pick it out. So, whether you consider just summer insolation (as you now claim was your point) or annual average insolation (as you previously claimed was your point), you are simply wrong about this. Geometry is not very complex, but even its complexities appear to be to much for you in this discussion. -
muoncounter at 12:25 PM on 20 February 2011A Swift Kick in the Ice
RW1: "30 years is hardly enough data" But in a prior comment, you take some significance in what you describe as 'the past three years'??? Sorry, your seal story does not suggest 'a large degree of variability' -- because 1 year is hardly enough data to do that. -
RW1 at 12:19 PM on 20 February 2011A Swift Kick in the Ice
Tom (RE: 72), We don't know - there aren't enough specifics. The point is it suggests a large degree of variability even nearly 90 years ago. -
TOP at 12:18 PM on 20 February 2011A Swift Kick in the Ice
First off the graphic in Figure 3 showing the albedo of water in the 8-9% seems a bit high. I'd put is at 3-7.5%. Albedo The Arctic Circle is a line above which there is continuous sun in summer and no sun in winter. The high temperature anomaly in the Arctic this winter was not due to the greenhouse effect directly on the Arctic Ocean. It was due to heat being transported to the Arctic by global weather patterns. If you run the animation you see the transport of heat from as far south as the Sahara to the Arctic through a cluster of vortices that swirl around the arctic like giant hurricanes pulling warm air from southern climes and pushing cold air back down. Cold air can pour out of the Arctic into the more temperate areas such as caused the large snow events in the US and England. When this happens you get something like this:
  It should be obvious that the warming of the Arctic is not due to the greenhouse effect taking place in the Arctic. There isn't any to speak all year round and especially in winter.
You might say, "What about summer? Isn't there greenhouse effect due to the open water?" Not much because the albedo of the open water is so low that there is little long wave radiation or any other kind going up out of the water after the sun's rays hit it. All that energy is deposited deep in the water, CO2 or no CO2. So regardless of CO2, an ice free Arctic Ocean is going to contribute a lot to global warming during summer months.
What was not addressed in the article is whether the polar regions are any less effective in radiating energy into space in the winter seasons regardless of the ice state.
It should be obvious that the warming of the Arctic is not due to the greenhouse effect taking place in the Arctic. There isn't any to speak all year round and especially in winter.
You might say, "What about summer? Isn't there greenhouse effect due to the open water?" Not much because the albedo of the open water is so low that there is little long wave radiation or any other kind going up out of the water after the sun's rays hit it. All that energy is deposited deep in the water, CO2 or no CO2. So regardless of CO2, an ice free Arctic Ocean is going to contribute a lot to global warming during summer months.
What was not addressed in the article is whether the polar regions are any less effective in radiating energy into space in the winter seasons regardless of the ice state.
-
RW1 at 12:13 PM on 20 February 2011A Swift Kick in the Ice
Albatross, I'm not disputing that the documented period we have shows a downward trend, but 30 years is hardly enough data to show whether this is anything significant or just random noise of natural variability. Why hasn't the Antarctic shown the same trend? If anything, it's slightly increased over the same period. -
Tom Curtis at 12:11 PM on 20 February 2011A Swift Kick in the Ice
RW1 @65: 1) Some, not many, locations were still iced over at the 2007 minimum at 81.5 degrees latitude, mostly between the Canadian islands where they are protected from the influx of warm water from the Atlantic and Pacific; protected also from wind breaking up the ice; and also have a limit on the Ice Albedo effect because of the more constant albedo of the nearby islands. 2) North of Spitsbergen there is one location ice free at 81.5 degrees north on the February 19th Ice Extent. (Not the maximum, and not claimed to be the maximum, but still a winter ice extent). 3) Your report says, "EXPEDITIONS REPORT THAT SCARCELY ANY ICE HAS BEEN MET WITH AS FAR NORTH AS 81 DEGREES 29 MINUTES." The phrase "as xxx yyy as" is always used to indicate the furthest extent of which something is true. So multiple expeditions (possibly 2, possibly 20, we don't know) found ice free water were they expected to find ice, and the furthest north of which this was true (ie, one sighting by one expedition) found ice free water at 81.5 degrees north. Which was also true yesterday, during winter. I suspect the furthest northerly extent free of sea ice in the summer of 1922 was also just north of Spitsburgen as well. After all, in 1599, ie, during the LIA the southern coast of Spitsburgen (about 77 degrees north) was also ice free. -
muoncounter at 12:07 PM on 20 February 2011A Swift Kick in the Ice
Albatross, you beat me to it this time! RW1: I usually define 'accelerating' as describing the motion of an object where the first derivative and second derivative of position have the same sign; but we can just say 'speeding up'.
 -- both from Has Arctic sea ice returned to normal?
Pay attention to trends, not a year or two. But if you insist, here's how this year stacks up:
-- both from Has Arctic sea ice returned to normal?
Pay attention to trends, not a year or two. But if you insist, here's how this year stacks up:
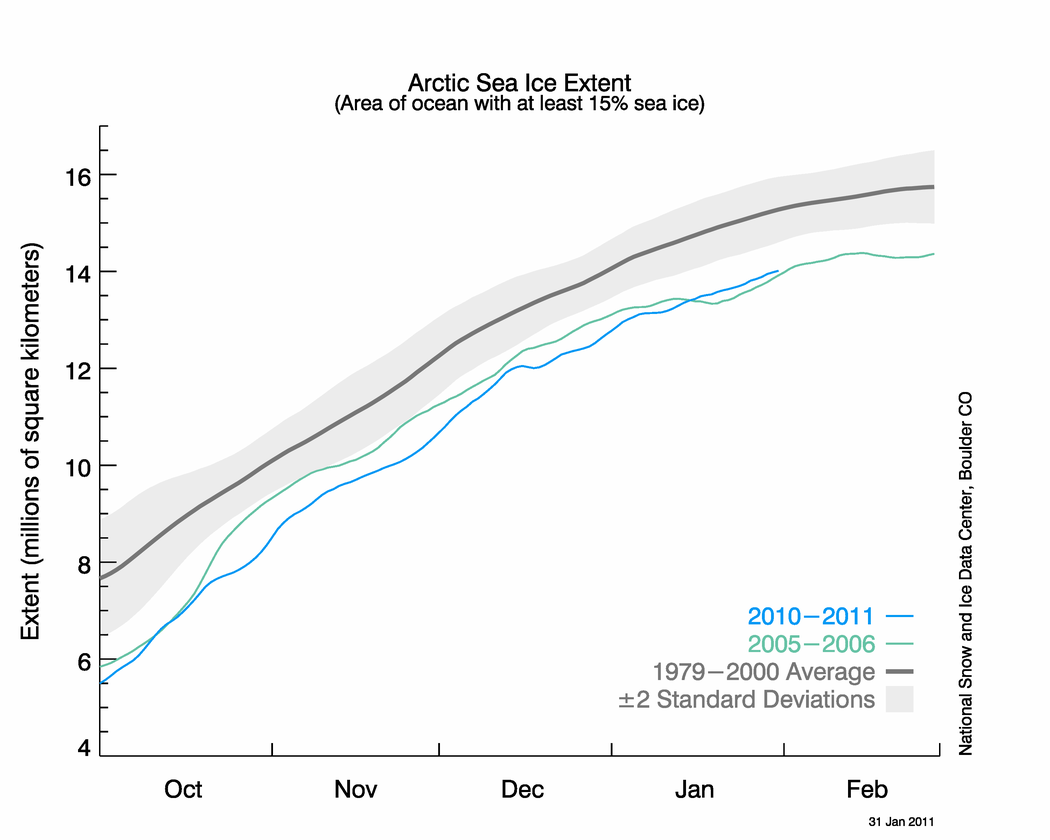 -- NSIDC sea ice news "Record low January extent"
You'll note that this year is more than 2 std devs below the average and playing tag with 2005-06 (the prior record low extent). The annual max occurs in March. There are websites where they bet on such things.
-- NSIDC sea ice news "Record low January extent"
You'll note that this year is more than 2 std devs below the average and playing tag with 2005-06 (the prior record low extent). The annual max occurs in March. There are websites where they bet on such things.
-
Bob Lacatena at 12:03 PM on 20 February 2011Skeptic arguments about cigarette smoke - sound familiar?
I think it's pretty obvious that a lack of smoking causes global warming. Think about it. People started to back away from smoking around the late seventies. When did the current warming trend appear to start? The only way to stop global warming is to push tobacco products (and to keep using fossil fuels). -
Albatross at 12:01 PM on 20 February 2011A Swift Kick in the Ice
RW1 @68, Now you know very well, or should at least, that is is the long-term trends which count.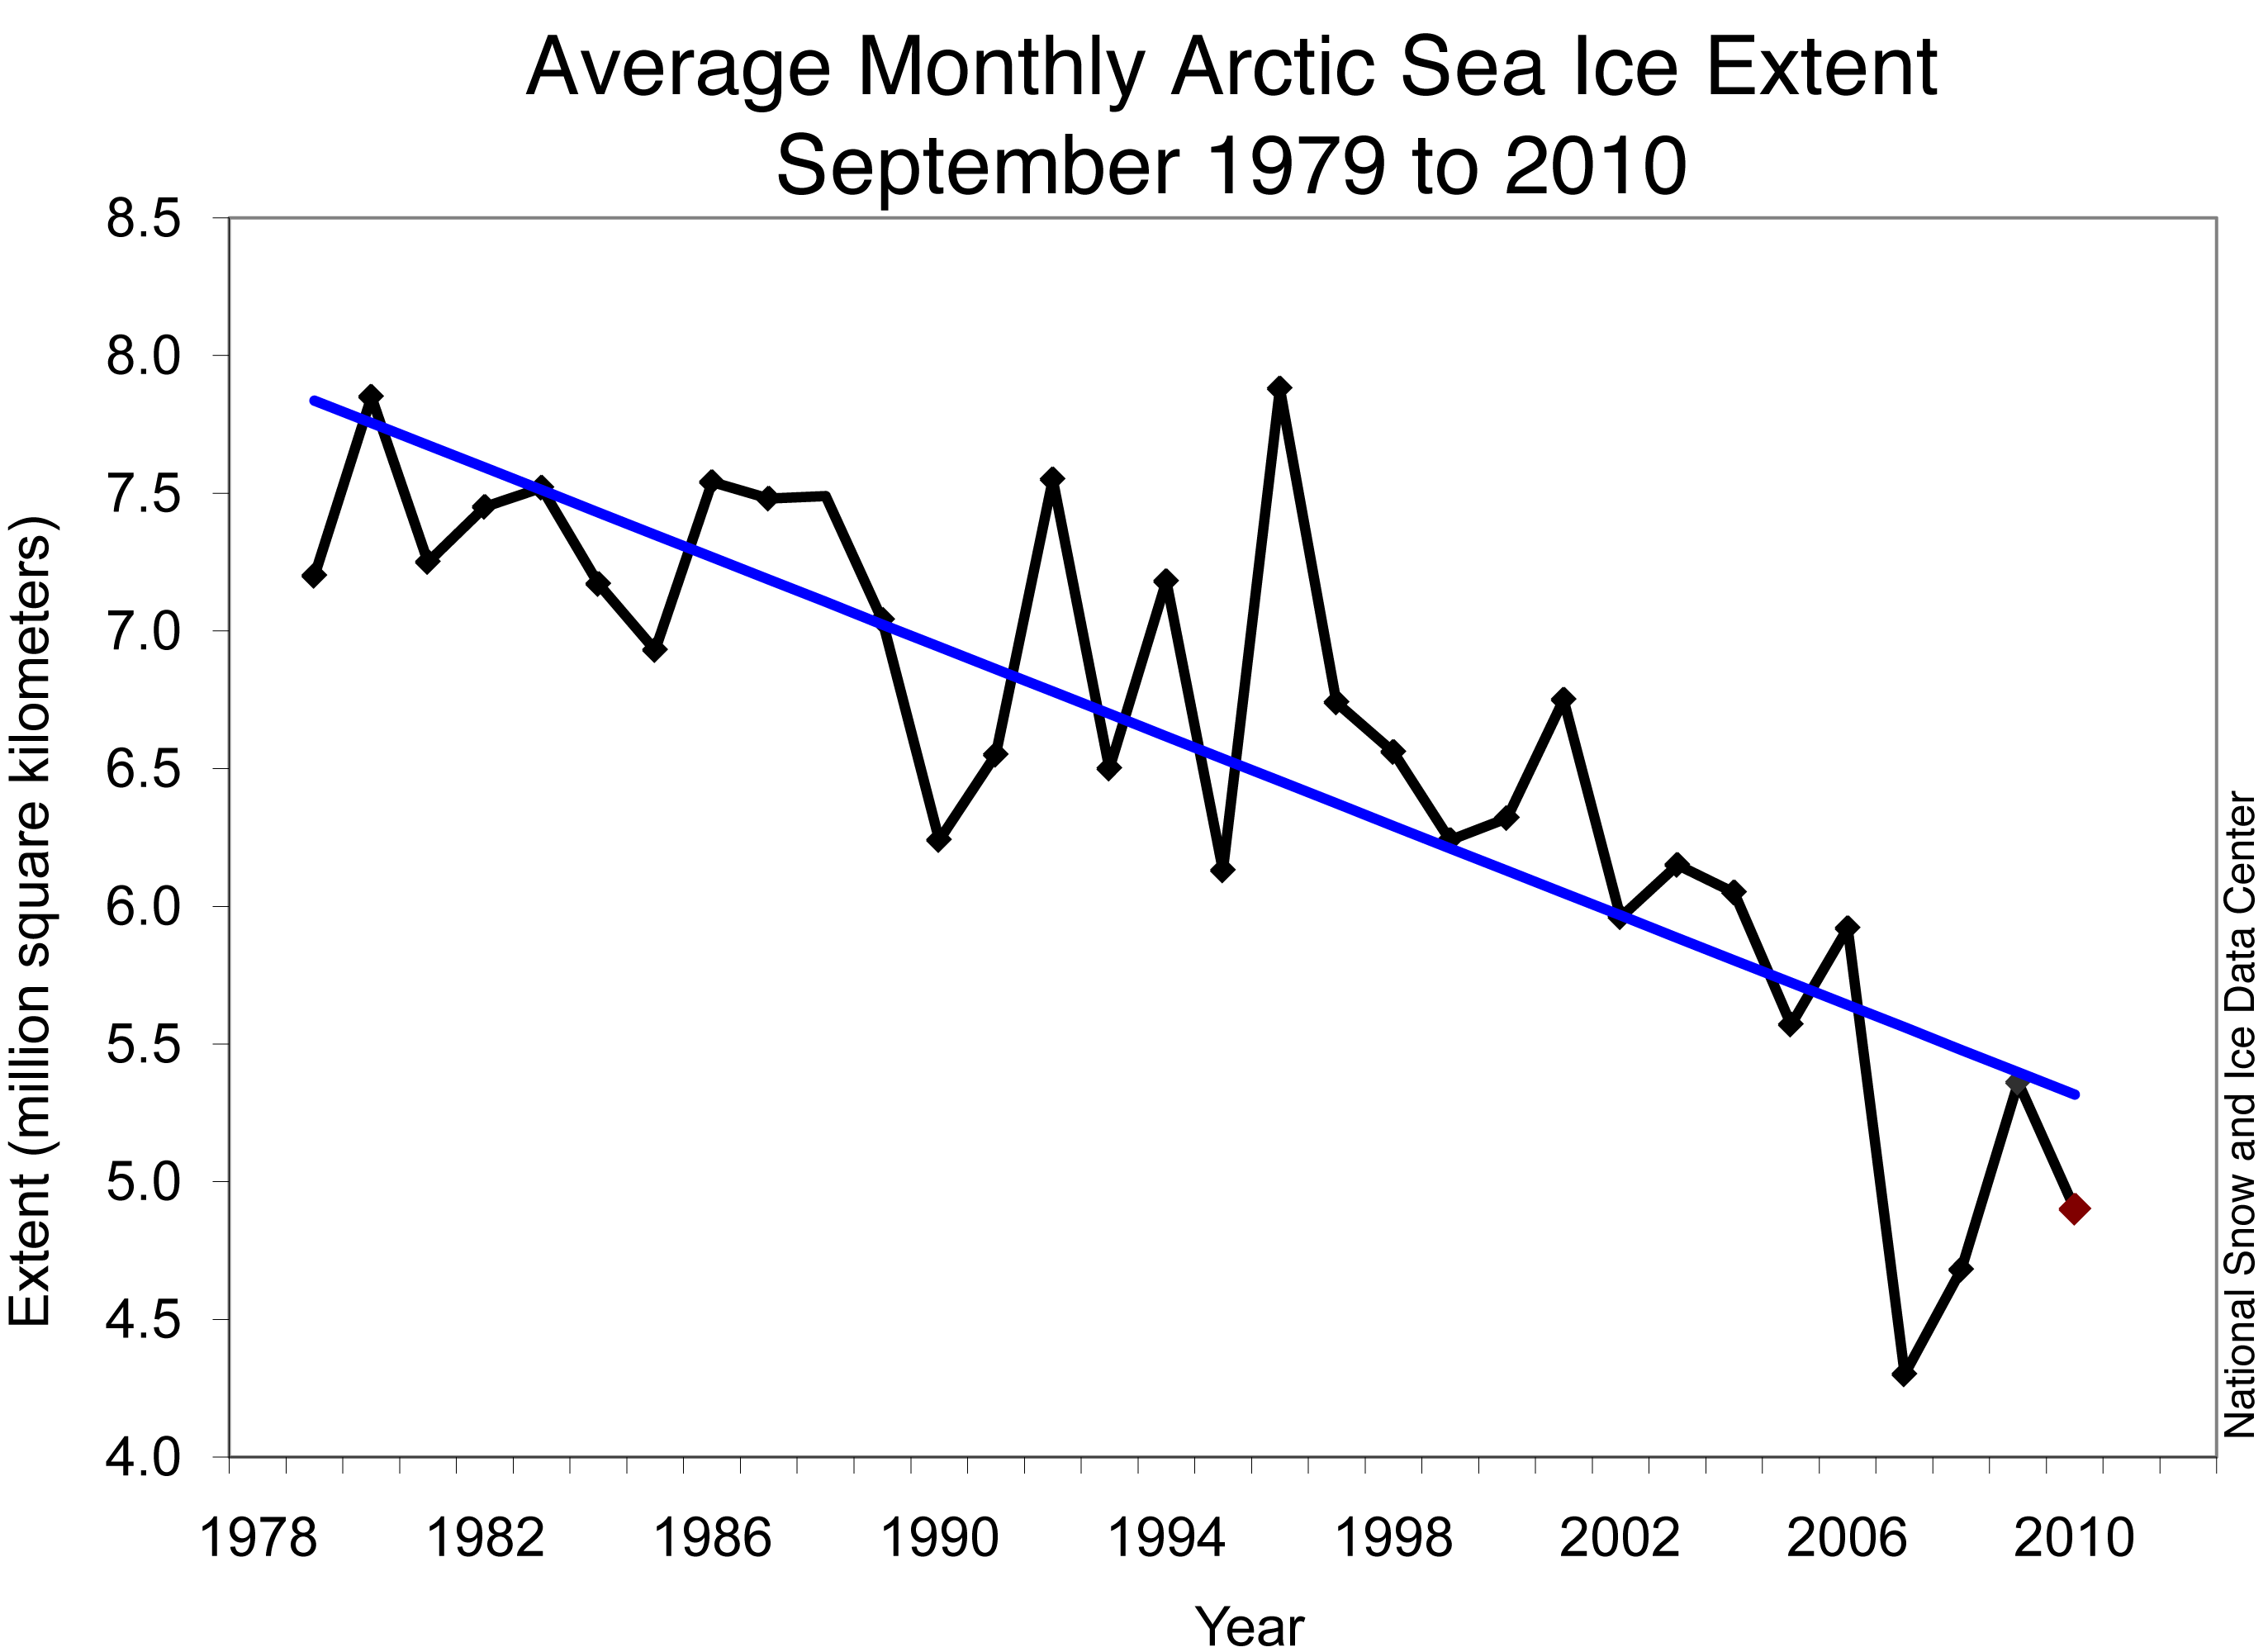 And the minimum in 2010 was the third lowest on record, not the fourth. And that the best fit to the data in the above graph is a quadratic not a linear model.
Prev 1919 1920 1921 1922 1923 1924 1925 1926 1927 1928 1929 1930 1931 1932 1933 1934 Next


