


 Arguments


Recent Comments
Prev 1951 1952 1953 1954 1955 1956 1957 1958 1959 1960 1961 1962 1963 1964 1965 1966 Next
Comments 97901 to 97950:
-
Dikran Marsupial at 05:27 AM on 5 February 2011It's not us
Hi Julian, "Does the isotope change in the atmosphere match that expected from the amount of fossil fuel CO2 produced and not taken up by the enhanced sink? If not, does the discrepancy give us any hint as to the source of other inputs or changed exit fluxes?" I've not done the calculations myself, but if they didn't match there would be a paper demonstrating that they didn't match, and I'm pretty sure we would have heard about it. "So, as it is elementary, there is a breakdown of the method in a text book? Even so, I'd like something more than a hat tip to increased carbon dioxide automatically keeping the 45% in balance. It seems unlikely." See the paper by Canadell et al in PNAS the bit about the ariborne fraction being 0.45 is about half way down the second column on page 2. The AF is changing slightly but it has been about the 0.45 mark for a long time. "Here we disagree. Deep ocean clathrate deposits are quite capable of belching methane directly into the atmosphere (where they rapidly oxidise) or CO2 from methanophage digestion. In your initial crude equation this does not matter, as everything just gets lumped into the same number." If enough calthrate deposits were released that the natural environment became a net source of CO2 into the atmosphere, the annual rise would be greater than anthropogenic emissions. But we know this is not the case. Prof. Essenhigh is indeed a gentleman, however that particular paper is flat wrong. He makes no distinction between residence time and adjustment time and says there is a confusion in the 1990 IPCC WG1 report. However, if you look at the report, you will find the terms are well defined (Table 1.1, page 7) and in section 1.2.1 there is a paragraph that explains why it is the adjustment time that is relevant to a discussion of the change in atmospheric concentration not the residence time. Prof. Essenhighs calculation of the residence time is essentially correct, it is the corrollory that is incorrect. -
thepoodlebites at 05:17 AM on 5 February 2011Follow-Up Case Study in Skepticism
#59 Um, er, replying to #49. It took time to look up appropriate sources, no alarming trends that I can see. And the website CO2 tonnage seemed out of date. I checked "Are CO2 levels increasing," thanks. I'll continue the CO2 airborne fraction over there but I was wondering, is it about 40% absorbed, 5.23*(0.4) ~ 2.0? #49's website was a bit confusing too.Moderator Response: [muoncounter] Fixed broken link. Further replies to specific atmospheric CO2 concentration questions should go here. -
actually thoughtful at 05:14 AM on 5 February 2011Follow-Up Case Study in Skepticism
Humanity Rules- You have stumbled upon the deep irony. It is, indeed, those who accept climate science (and the necessary fellow-traveler, AGW) who, as a rule are the "dynamic problem solvers." Indeed, I make my living as a very, very dynamic solver of the global warming problem (sadly I own/operate but one small company - the need is great)! So, I certainly understand you not wanting to debate the science - as global warming is so far on the fact side of the theory/fact spectrum as to be an embarrassing discussion for those with your view. Anytime you want to stop playing the passive victim and jump in and work towards positive change on this issue, I will certainly support you (for whatever small value that has). As for me I am optimistic that we can forestall catastrophe (can-do, dynamic problem solving at your service!), but I am becoming pessimistic that we WILL forestall catastrophe - too many people (you among them, as far as I can tell from your posts) would like to minimize this, or ask for more research, or any level of sophist arguments that, in the real world, force humanity into the position of passively accepting nature's response to human emissions rather than make relatively minor adjustments to avoid nature's inevitable response. I can't do anything but fight it. It is in my nature. -
It's not us
Julian Flood - Isotopic ratios are indeed falling (see here in How do human CO2 emissions compare to natural CO2 emissions). And that rate of change correlates to our emissions. Given the rather massive exchange of the natural carbon cycle, direct attribution is going to be a challenge either way. But the mass balance issue (that we're emitting ~29 GT/year of CO2, and that atmospheric concentrations are rising at 15 GT/year) indicate that we are making a difference in the balance. You've presented no arguments against the total mass balance points other than arguing uncertainties in the natural carbon cycle - we have no such uncertainties about our emissions and the rate of atmospheric increase. Even +/- 50 GT/year uncertainties (balanced) in the natural carbon cycle makes no difference to the fact that we emit 29 GT and only see 15 GT staying in the atmosphere, indicating that nature acts as a sink for the additional 14 GT/year. And that's supported by the ongoing changes in isotope ratios. Your argument against mass balance calculations doesn't hold up. If we were to stop emitting CO2 tomorrow I would expect ~2ppm/year decreases in CO2 for a while, slowing and then halting somewhere above the 280ppm preindustrial level when carbon cycle exchanges balance out with the pulse of CO2 we have contributed over the last 150 or so years. -
Alexandre at 05:10 AM on 5 February 2011A Case Study of a Climate Scientist Skeptic
Marco #25 Great table, I'll keep it for reference! -
Dikran Marsupial at 05:08 AM on 5 February 2011It's not us
Hi Julian, I'll deal with the first bit as it is fundamental "Yes, but this means you have no knowledge of the sizes or even composition of the various sinks and sources." Knowledge of the size or composition of the sinks is not necessary to establish that as a whole, the natural environment is a net sink. This fact is established by the fact that the difference between total environmental emissions and total environmental uptake is equal to the difference between the increase in atmospheric CO2 and anthropogenic emissions. If the natural environment is a net sink, i.e. it takes more CO2 out of the atmosphere each year than it puts in, how can it be the cause of the observed increase? Do you agree that the mass balance argument demonstrates that the natural environment is a net sink? If not, can you explain why? -
John Hartz at 05:01 AM on 5 February 2011A Case Study of a Climate Scientist Skeptic
Dana: Perhaps the point made by Riccardo #15: "The thermal inertia of the oceans is the cause of the "expected warming", using KR's terminology. Rememebr that this expected warming refers to a constant forcing, i.e. keeping CO2 concentration and everything else but temperature constant. In reality, it will be larger." should be woven into the the text of the "Thermal Intertia" section, or added as an explanatory footnote. -
Julian Flood at 04:57 AM on 5 February 2011It's not us
quote The argument is about what is observed to have happened, and makes no assumptions about what values U_n and E_n actually have, and does not make any assumptions about the sources or whether they vary. Think of U_n and E_n as being the total natural uptake and emissions from natural sinks and sources that actually occurred in a particular year. We don't know their individual values, we can't directly observe them, but we don't need to know their values, the key point is that we can infer the difference between them and know if the natural environment is a net source or a net sink. unquote Yes, but this means you have no knowledge of the sizes or even composition of the various sinks and sources. In particular you have no knowledge of the proportion of the atmospheric component which is due to fossil fuel. Without that knowledge you cannot know if decreasing, or even eliminating, fossil fuel emissions will have much impact on atmospheric CO2. quote Your definition of indirect anthropogenic emissions is unworkable. Firstly issues such as deforestation are already included in anthropogenic emissions as it comes under "land use change". Secondly, the main way in which our emissions have changed the carbon cycle is that there is now far more *uptake* because the atmospheric concentration has risen. The whole reason the natural environment is currently a net sink is due to its response to our emissions. If you want to increase the anthropogenic emissions by including an "indirect component", it just means that the natural environment must be an even stronger net carbon sink than the basic mass balace argument suggests, in which case it remains the case that man is responsible for the observed rise in CO2 (i.e. we agree). unquote Where we disagree is in the relative importance of the various components of anthropogenic CO2. They are unquantified and give no guidance on the best course ahead. Lumping any particular flux into 'land use change' or whatever does not improve the situation, it just makes the assertion a tautology. [snip re fluxes] My question was whether isotope changes fit in with the 45% addition to the atmosphere. Perhaps I can ask the question again. Does the isotope change in the atmosphere match that expected from the amount of fossil fuel CO2 produced and not taken up by the enhanced sink? If not, does the discrepancy give us any hint as to the source of other inputs or changed exit fluxes? quote The export from upper to deep ocean reservoirs is entirely irrelevant. The mass balance argument only involves fluxes into and out of the atmosphere, and only the difference in total emissions and total uptake matters. unquote Here we disagree. Deep ocean clathrate deposits are quite capable of belching methane directly into the atmosphere (where they rapidly oxidise) or CO2 from methanophage digestion. In your initial crude equation this does not matter, as everything just gets lumped into the same number. However, in the real world whether the atmospheric CO2 rise is due to a pinch of fossil and a peck of something else matters enormously. The simple mass balance equation gives us no useful knowledge. Is the MWP deep water warming clathrates? A fraction of a degree would do it, and enormous fluxes of light isotope carbon would be released, handily just at the 800 year point which seems to be the lag between warming and CO2 increase in the historical record. quote As to papers on my second post, I haven't seen any papers that use a model of the carbon cycle that is so rudimentary that the result is easily obtained. Anyone who works on the carbon cycle will find it too obvious to publish a paper on, and instead are working on more complex models that take into account things like upper-deep ocean fluxes. The one paper I have seen that uses such a model is the one by Essenhigh (2009), but in that paper Essenhigh fails to understand the distinction between residence time and adjustment time and hence the conclusion of the paper is incorrect. unquote So, as it is elementary, there is a breakdown of the method in a text book? Even so, I'd like something more than a hat tip to increased carbon dioxide automatically keeping the 45% in balance. It seems unlikely. Thanks for the reference to Essenhigh, I've had correspondence with him re his paper on albedo. A gentleman with an engineer's grasp of reality. I'll read that paper with interest and any refutations you can reference. TIA. JF Re your last post: this just reiterates the mass balance argument. It tells us nothing of attribution. Which is why I ask about expected isotope ratios. Ferdinand Englebeen (I think it was in his WUWT posts) mentioned that the ratios are not as expected. Have I remembered that correctly? -
John Hartz at 04:53 AM on 5 February 2011A Case Study of a Climate Scientist Skeptic
Dana: Given the number of referalls to other SkS rebuttals in this comment thread, I suggest that you add a "Related Arguments" tab. -
dana1981 at 04:46 AM on 5 February 2011A Case Study of a Climate Scientist Skeptic
Thanks Marco #24. I didn't bother to look at the paper because AMO/PDO/etc. are a red herring. Like I said, they just move heat around from oceans to air and vice-versa. They don't cause long-term warming. I'm not surprised that protestant misrepresented the study's findings. -
Marco at 04:44 AM on 5 February 2011A Case Study of a Climate Scientist Skeptic
P.S., could not help myself after seeing that first Figure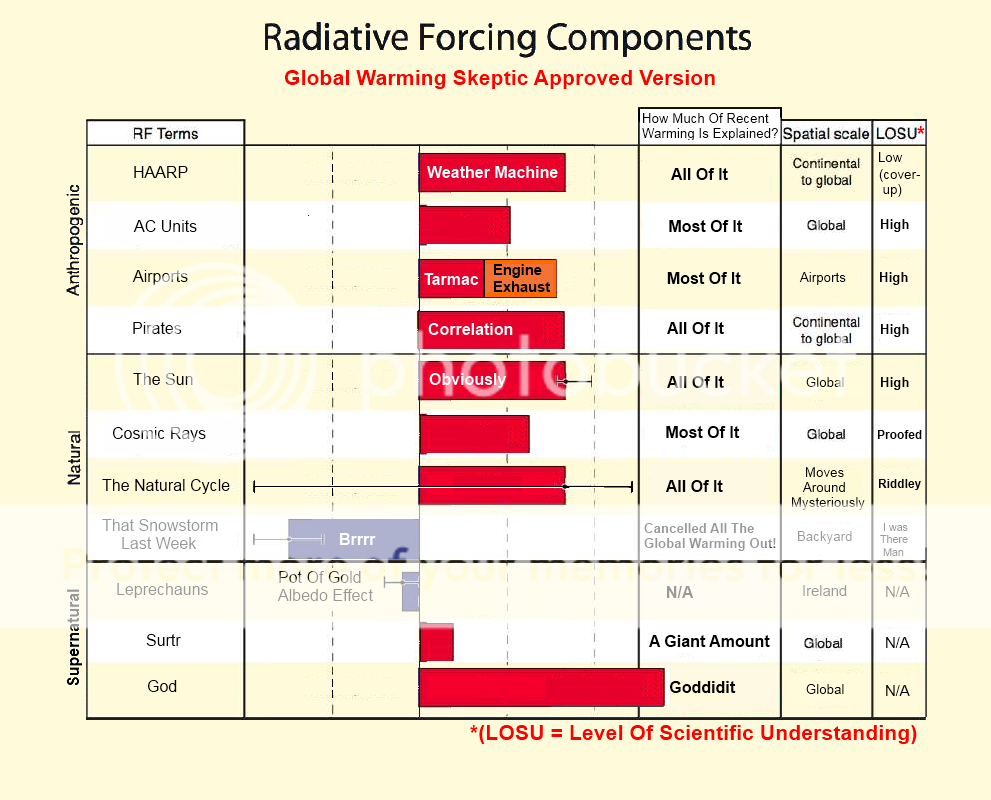
-
Marco at 04:42 AM on 5 February 2011A Case Study of a Climate Scientist Skeptic
Dana + protestant: the Delsole paper is nice; "nice" as in cherry-picking galore for protestant. Delsole et al point out that the AMO may contribute 0.08 K/decade in a 30-year period (and hence also 'remove' 0.08 K/decade in a 30-year period). Those are the oscillations around the trend in SST that Delsole et al also mention: 0.1 K/decade. Note the SST here: they talk about SST only. -
dana1981 at 04:30 AM on 5 February 2011A Case Study of a Climate Scientist Skeptic
Pete #22 - that's specifically the indirect aerosol effect via seeding clouds. There's still a lot of uncertainty regarding this effect - I don't think recent research has changed the value or reduced the uncertainty very much yet. -
Pete Dunkelberg at 04:23 AM on 5 February 2011A Case Study of a Climate Scientist Skeptic
The graph of radiative forcings shows a substantial cooling from cloud albedo effect. How does this compare to recent research? -
muoncounter at 04:21 AM on 5 February 2011A Case Study of a Climate Scientist Skeptic
#15: "The thermal inertia of the oceans is the cause of the "expected warming"," This was addressed on the thread The 40 year delay between cause and effect. How about 'observed warming' for the part we've already seen and 'committed warming', as suggested by Wetherald et al 2001? Better still might be 'unavoidable warming,' as suggested by Matthews and Weaver 2010 -
Eric (skeptic) at 04:16 AM on 5 February 2011A Case Study of a Climate Scientist Skeptic
FWIW, my choice of wording would be "lag in atmospheric warming as the ocean warms much more slowly". You will have to address KL's arguments with numbers, you can't just sidestep it with terminology like "expected by equilibrium equation" which begs the question "when?". If, for example, deep ocean turnover is large enough to keep cooling the atmosphere by cold bottom water, then there could be a long lag. Quantifying is difficult but the argument is sound (it answers KL). -
dana1981 at 04:14 AM on 5 February 2011A Case Study of a Climate Scientist Skeptic
KR #17 - I like "unrealized warming". This term suggests that the warming will indeed be realized, which is true. I'll edit the article to incorporate that terminology. -
Follow-Up Case Study in Skepticism
thepoodlebites - Spencers challenge should probably be discussed on It's a natural cycle. Interestingly, several regulars here (including me) are finding their comments in reply to his challenge not showing up on his blog. They don't seem to be making it through moderation. In the meantime, 40 new replies have shown up since I tried to post there... -
Chris G at 04:02 AM on 5 February 2011Monckton Myth #4: Climate Sensitivity
Re: Adelady Re RHJames, :-) I've been outside on many, many nights, summer and winter, and the effect of clouds is so readily apparent to me that I wonder about those who only talk about clouds during the day. Regarding Monckton and how often he is correct: Even a broken clock is right twice a day. -
Follow-Up Case Study in Skepticism
thepoodlebites - Um, what is the relevance of your comment to the current topic? You might want to discuss CO2 concentrations on the Are CO2 levels increasing or Comparing CO2 emissions to CO2 levels threads. -
muoncounter at 03:58 AM on 5 February 2011A Case Study of a Climate Scientist Skeptic
#11: "Natural climate variability has always existed and it didnt suddenly just disappear." See comment on It's a natural cycle, a lonely thread that needs some traffic. -
muoncounter at 03:58 AM on 5 February 2011It's a natural cycle
Reply to comment from here. "Natural climate variability has always existed and it didnt suddenly just disappear." No one said that 'natural variability' has disappeared. However, there is excellent evidence that this variability is insufficient to account for the current warming. The graph below shows we've already exceeded the limits of natural variability. There is therefore ample rationale to accept that man-made global warming will far exceed anything natural. --- from Chapman and Davis 2010 via ourchangingclimate
Chapman and Davis explain: This collection of curves suggests that the Northern Hemisphere was relatively warm around 1000 C.E. (but not as warm as current temperature), that the period 1500–1850 was relatively cool, and that there has been considerable warming since 1900. ... All of the emissions scenarios considered by the IPCC yield global warming in the 21st century that dwarfs warming seen in the past millennium.
Response:
--- from Chapman and Davis 2010 via ourchangingclimate
Chapman and Davis explain: This collection of curves suggests that the Northern Hemisphere was relatively warm around 1000 C.E. (but not as warm as current temperature), that the period 1500–1850 was relatively cool, and that there has been considerable warming since 1900. ... All of the emissions scenarios considered by the IPCC yield global warming in the 21st century that dwarfs warming seen in the past millennium.
Response:[DB] Upgraded image quality.
-
thepoodlebites at 03:52 AM on 5 February 2011Follow-Up Case Study in Skepticism
#49 I agree, facts are wonderful: Hurricanes, Tornadoes, Droughts, Precip, Snow. The snow data were more difficult to obtain, NCDC likes maps more than trend plots. I see no threat to civilization in the current trends. Concerning statistical significance, Roy Spencer said it best with "The fact is that the ‘null hypothesis’ of global warming has never been rejected: That natural climate variability can explain everything we see in the climate system." Now on to your CO2 source, using an Earth radius of 6370 km, I get 5.23 ppm/year from CO2 emissions, not 6 ppm. The current yearly trend in CO2 increase is 2 ppm, not 3 ppm. According to the correct calculations, 3.23 ppm of the yearly CO2 dump is being absorbed, half from natural processes, 1.615 ppm. So where is the other 1.615 ppm going? How can you estimate the CO2 increase in 50 years when you don't fully understand all of the absorption processes? -
A Case Study of a Climate Scientist Skeptic
I've thought about the terminology for some time - I've seen the "where's this heating hiding?!?" argument quite often, and find it very irritating in it's misconceptions. Possible terminology: Expected warming Unrealized warming Warming needed to redress the imbalance Acme anvil of heating (Coyote/Roadrunner reference) I don't know what the proper term might be (nobody in our group ever lets me name anything, so my skills in this might be suspect). But the "in the pipeline" term is easily misinterpreted. -
Chris G at 03:40 AM on 5 February 2011A Case Study of a Climate Scientist Skeptic
OK, I got caught behind the wave at KR#6. However, CO2 levels will not suddenly return to ~280 ppm even if we quit burning all fossil fuels today; so, we are committed to further warming. (I've little doubt that we will quit burning fossil fuels; there's just a question if that will be at the 2-3 degree warmer equilibrium level or the 6 degree level.) In terms a layman can relate to, there is warming 'in the pipeline'. It depends on the audience; anyone familiar with stats will understand a different meaning from the term 'expected value' than someone not familiar, to which it will sound dodgy. -
grypo at 03:34 AM on 5 February 2011More animations of the Warming Indicators
Thanks Alb. I'm going to readjust the timing on those slides over the next couple of days and then fix the font color. I think the white works better. -
Riccardo at 03:23 AM on 5 February 2011A Case Study of a Climate Scientist Skeptic
I second KR #6 on the "in the pipeline" terminology. As Ken Lambert's comment #4 shows, it is often misinterpreted. Budgersouth they're not synonims. The thermal inertia of the oceans is the cause of the "expected warming", using KR's terminology. Rememebr that this expected warming refers to a constant forcing, i.e. keeping CO2 concentration and everything else but temperature constant. In reality, it will be larger. -
dana1981 at 03:23 AM on 5 February 2011A Case Study of a Climate Scientist Skeptic
dorlomin #1 - thanks, that's very high praise. As Mark said in #2, climate sensitivity evaluations based on paleoclimate data would include carbon cycle feedbacks. Arkadiusz #3 - you may have noticed that I used a range of 0.06 to 0.30 W/m2 for the solar forcing. Your preferred value of 0.24 W/m2 is within that range, so it does not change the conclusion. There have been other studies concluding that the solar forcing is less than the IPCC value as well. This is the whole point of doing the calculation while keeping the uncertainties. Ken Lambert #4 - sorry, you are incorrect. See KR #6. Also I suggest you read the Lindzen E&E paper I linked in the article. He explicitly states that there is warming in the pipeline from the ocean thermal inertia. He just neglects it because he feels it's too small to make much difference in the calculation, but unlike yourself, doesn't deny that it exists. Alexandre #5 - Monckton has made the same claim about Lindzen being the only scientist to evaluate climate sensitivity based on empirical data. We criticized him for that in Monckton Myth #4. KR #6 - thanks. Terminology is always tricky. If you call it "expected warming" the "skeptics" will latch onto the word "expected" and claim it's not coming. Badgersouth #10 - I think the terms are basically the same thing. protestant #11 - no, it's not an assumption. That's why I included the solar forcing. The "O" in AMO and PDO is "oscillation" for a reason. They switch between positive and negative states, and just move heat around from oceans to air and vice-versa. Even if they contributed 0.08°C to the surface air warming in question, it wouldn't significantly change the calculation. The rest of your comment belongs in the climate sensitivity is low comments. -
Chris G at 03:17 AM on 5 February 2011A Case Study of a Climate Scientist Skeptic
Ken, On further thought, my first response is a little inadequate, but that only means you have me confused. You state that there is no warming in the pipeline, and then acknowledge that it will take a long time for the oceans to reach a thermodynamic equilibrium. Those statements don't seem to be compatible with each other. -
Chris G at 03:09 AM on 5 February 2011A Case Study of a Climate Scientist Skeptic
Ken Lambert #4, So, what you're suggesting in your first paragraph is that the energy absorbed at the surface is instantly transported clear to the bottom. Sorry, but that is absurd. There is a constant turnover of oceanic water via the thermo-haline cycle, but it takes hundreds of years for a complete cycle. It'll be some time before the entire ocean reaches a thermal equilibrium with the energy level the surface is now receiving. -
protestant at 03:05 AM on 5 February 2011A Case Study of a Climate Scientist Skeptic
All of that 0,8C is not made by CO2 thats just an assumption taken from the climate models ,which actually do not replicate the 1940 hump. A great of warming (specially post 1970) is from the Atlantic Multidecadal Oscillation (AMO) and the Pacific Decadal Oscillation (PDO). AMO has also been recently discussed in the scientific literature by Delsole et al contributing circa 0.08K/decade to the trend. The recent flattening of the rise is consistent with this explanation. Then you have to prove that there is no decaedal natural variability (almost evident and the oscillations can be seen in paleo records too), or that this variability is due GHG's (nonsense, since CO2 was almost constant pre industrial). Natural climate variability has always existed and it didnt suddenly just disappear. Whether it is internal or caused by clouds (North Atlantic temperatures correlate very well against Solanki et al at least for the last couple of hundred years), both occasions will seal the CAGW case. -
John Hartz at 02:53 AM on 5 February 2011A Case Study of a Climate Scientist Skeptic
Re #6 KR's concerns about the phrase "in the pipeline". I note that the header title of the section of the article where this term appears is "Thermal Inertia." My question for Dana: Are the terms, "in the pipeline" and "thermal inertia" synomonous? If they are, perhaps the term "in the pipleine" could be followed by (i.e., thermal inertia). -
Dikran Marsupial at 02:24 AM on 5 February 2011It's not us
My posts on that thread have now also started to be "waiting moderation", which is very indeed very dissapointing. If his hypothesis is falsifiable it should be straightforward for him to have answered my question directly. If it is not falsifiable then the challenge is meaningless. My most recent was timestamped "February 4, 2011 at 8:36 AM". -
muoncounter at 02:16 AM on 5 February 2011A Case Study of a Climate Scientist Skeptic
#3: "I recall a sentence from the study ... many aspects of indirect effects of solar activity on climate is poorly assessed" I also recall a sentence in the Gray et al study you cite: Despite these uncertainties in solar radiative forcing, they are nevertheless much smaller than the estimated radiative forcing due to anthropogenic changes and the predicted SC-related surface temperature change is small relative to anthropogenic changes. This is the sentence immediately after the first one you quoted. Shouldn't the 'skeptical' statement 'there are many uncertainties' also include the qualifier 'but those uncertainties are small'? -
A Case Study of a Climate Scientist Skeptic
Arkadiusz - "Almost each of the data given above is questioned by skeptics." Quite true, Arkadiusz. In fact, there are uncertainties in all the relevant quantities. But as a climate scientist, Lindzen is not justified in using that uncertainty they way he does, claiming for example that aerosols have zero effect - when that falls outside the 95% confidence interval for them. Acknowledging uncertainty in various factors means accounting for it, not using uncertainty to somehow justify ignoring those factors completely. -
Alexandre at 01:50 AM on 5 February 2011A Case Study of a Climate Scientist Skeptic
Arkadiusz #3 says "Almost each of the data given above is questioned by skeptics." Oh yeah, no news there. Everything is questioned by "skeptics". They claim it's not warming, but the observed warming is caused by the sun but it's caused by PDO or NAO. And they also claim it's caused by CO2, only the climate sensitivity is lower than usually accepted (like Lindzen). Of course, some "skeptics" also claim that averything the IPCC said is fine and correct, it's just that giving up fossil fuels would be disastrous (like Lomborg). They question everything. Even the concept of temperature itself is brought into question if that would help their "argument". The funny (or sad) thing is how many people go along with such a contraditory mess. Right Arkadiusz? -
It's not us
Julian, Dikran - Odd thing, that; I tried posting there too, my post apparently did not survive moderation. It showed up as "awaiting moderation", but never made it to the blog comments. I'm saddened by that approach, when Dr. Spencer had issued the challenge in the first place. If he wants to issue such quixotic challenges, he should accept responses too. -
A Case Study of a Climate Scientist Skeptic
Dana - Excellent post, very clear and it covers the issues/obfuscations quite well. I have, however, always hated the "in the pipeline" terminology. What this refers to is energy that hasn't accumulated yet, but is expected to given the current imbalance. Conditions are such that we expect further heating to occur before the imbalance is removed. However, I keep seeing skeptics yelling about the "in the pipeline" heating, as if the energy discussed were somehow already here, hiding under a bush or something, and our supposed inability to point to it represents to them a failure of science. I would propose describing it as "expected warming", rather than "in the pipeline". -
Alexandre at 01:37 AM on 5 February 2011A Case Study of a Climate Scientist Skeptic
Linzen repeatedly claims that his climate sensitivy is based on observations, whereas all other higher sensitivities are based on models. How can a climate scientist say something like that and get away with such a grossly "uninformed" claim? -
Ken Lambert at 01:16 AM on 5 February 2011A Case Study of a Climate Scientist Skeptic
Original Post #dana1981 There are several things wrong with your piece. Firstly your point: "Due to the fact that much of the Earth is covered in oceans, and it takes a long time to heat water, there is a lag before we see the full warming effects of an increase in atmospheric greenhouse gases (this is also known as "thermal inertia"). In fact, we know there remains "warming in the pipeline" from the greenhouse gases we've already emitted because there is a global energy imbalance" It takes a long time for heat energy to warm a large mass of water to a uniform temperature, however the first law mandates conservation of that heat energy. If that energy is absorbed in the oceans then it will be represented by higher temperatures in some portion and lower temperatures in other portions with complex circulations generally driving heat from the warmer to cooler portions over time. The heat energy is already here - not 'in the pipeline'. There is no other major storage device other than the oceans so what is here today must show up as temperature increase (or ice melt or evaporation) somewhere RIGHT NOW. Secondly, your point: "Data from about 1 million ocean temperature profiles show that the ocean has been taking up heat at a rate of 0.6 W/m2 (averaged over the full surface of the Earth) for the period 1993–2003 [21]. This rate must be subtracted from the greenhouse gas forcing of 2.6 W/m2, as actual warming must reflect the net change in heat balance, including the heat flow into the ocean." Rahmstorf references Willis et al. (2004), which found an oceanic warming rate of 0.86 ± 0.12 watts per square meter of ocean. Given that approximately 70% of the Earth's surface is ocean, this becomes approximately 0.6 ± 0.07 watts per square meter (W/m2) of overall ocean heat uptake. Schwartz et al. (2010) put the value at 0.37 ± 0.12 W/m2. For our purposes, we'll put the figure at 0.25 to 0.67 with a most likely value of 0.4 W/m2." endquote The ocean heat uptake of 0.6W/sq.m (1993-2003) is in serious doubt due to the step offset efect of the XBT-Argo transition extensively debated elsewhere on this blog. Even accepting this figure, your claim that: "This rate must be subtracted from the greenhouse gas forcing of 2.6 W/m2, as actual warming must reflect the net change in heat balance, including the heat flow into the ocean" This is simply wrong. The oceans account for more than 90% of the heat storage capacity of the Earth system - so if they are absorbing 0.6W/sq.m then the whole system cannot absorb more than about 0.66W/sq.m. You do not subtract 0.6 from 2.6 and say that is the warming 'imbalance'. Where is that 2.0 'imbalance' showing up?? It cannot be stored anywhere because we have already accounted for the 0.6 absorbed in the oceans. Similarly your point: "On top of that, as discussed above, ocean heat uptake accounts for between 0.25 and 0.67 W/m2. Therefore, subtracting the ocean heat uptake, the total net anthropogenic forcing over this period is somewhere between -0.07 and 2.15 W/m2, with a most likely value of 1.1 W/m2." - is meaningless without a net figure including cooling and climate responses. The total net forcing (warming imbalance) MUST be represented by the heat energy stored in the earth system at ANY point in time. This is accounted by Dr Trenberth at +1.6 (net anthropogenic) -2.8 (S-B radiative cooling) + 2.1 (WV + ice albedo feedback) = +0.9W/sq.m imbalance. The oceans can account for only 0.4 - 0.6 W/sq.m with high uncertainty - so the balance of the 0.9 - (0.4 to 0.6) is Dr Trenberth's missing heat of 'travesty' fame. -
Arkadiusz Semczyszak at 01:12 AM on 5 February 2011A Case Study of a Climate Scientist Skeptic
Almost each of the data given above is questioned by skeptics. For example, I recall a sentence from the study: Solar Influences on Climate, Gray et al., 2010.: „A value of 0.24 Wm-2 solar radiative forcing difference from Maunder Minimum to the present is currently considered to be more appropriate than the 0.12 Wm-2 estimated by IPCC (c.f. the range of 0.16-0.28 Wm-2 ...)” According to this study - paper, many aspects of indirect effects of solar activity on climate is poorly assessed by the IPCC models (so far): “Periodicities, trends, and grand minima are features of solar activity which, if detectable in climate records, can be used to attribute climate changes to solar forcing (Beer et al. 2000; Beer and van Geel, 2008). However, one must be aware that this may not always work well because there are other forcings as well and the climate is a non-linear system which can react in a variety of ways.” “... the majority of climate models employed to date ... ... represent primarily the ‘bottom-up’ TSI mechanism and have a very poor, or no, representation of the ‘top-down’ mechanism that requires spectral variations in solar radiative input and ozone feedback effects. Only a few have an adequate representation of the stratosphere and even those do not generate a complete representation of stratospheric effects such as an internally consistent quasi biennial oscillation." -
John Chapman at 01:09 AM on 5 February 2011More animations of the Warming Indicators
National Geographic have prepared a variation of this theme, shown on a global map. It can be found at http://environment.nationalgeographic.com/environment/global-warming/gw-impacts-interactive/ The site also links to what we can expect as a result of the warming. -
Berényi Péter at 00:17 AM on 5 February 2011CO2 lags temperature
Dr. Roy Spencer's rebuttal is also linked at the RC Wiki page. It is a bit funny, because he starts by misquoting Dr. Miskolczi. “for..two regions (or bodies) A and B, the rate of flow of radiation emitted by A and absorbed by B is equal to the rate of flow the other way, regardless of other forms of (energy) transport that may be occurring.” From a logical point of view it looks like a proposition, does not it? However, if the full context is included, it is clearly a definition (of the term "radiative exchange equilibrium"). “It will be convenient here to define the term radiative exchange equilibrium between two specified regions of space (or bodies) as meaning that for the two regions (or bodies) A and B, the rate of flow of radiation emitted by A and absorbed by B is equal to the rate of flow the other way, regardless of other forms of transport that may be occurring.” Now, in logic there is a difference between propositions and definitions. One does not even have to be a climate scientist to see it. Propositions can have a truth value assigned to them, while for a definition it simply does not make sense. Shortly afterwards he admits he does not understand a couple of the claims he [Dr. Miskolczi] makes. The actual situation looks worse than that. He does not even seem to be able to tell claims and definitions apart. But let us elaborate on the concept "radiative exchange equilibrium" (defined above) some more, just to see how much sense it makes. If regions both A and B have uniform, well defined temperatures, radiative exchange equilibrium simply means thermal equilibrium, that is, their temperature is the same (TA = TB). It is not particularly interesting, but neither is it the case for the climate system. Although below about 50 km mean free path of air molecules is short compared to their coupling strength to EM radiation background (plenty of collisions occur between absorption/emission events), that is, local temperature is pretty well defined everywhere, temperature distribution is usually far from being uniform. One can still define average temperature for regions like that, even if it does not make much sense to compute averages of intensive quantities. However, it looks like a standard practice in climate science and at least for the time being let's go with it. Now, for subsystems A and B not in thermal equilibrium themselves it is perfectly possible for them to have the same average temperatures while maintaining a steady nonzero net radiative heat flow between them. It is also possible of course for the two subsystems to have different average temperatures while being in radiative exchange equilibrium (in the sense defined above by Dr. Miskolczi). One can not emphasize enough how sharp is the difference between equilibrium and steady states. Unfortunately they are quite often mixed up in climate discussions (even in some peer reviewed pieces). I do not know what the actual net radiative heat fluxes are inside the climate system, much less their global averages, but I do see Dr. Spencer attacks a straw man he himself created. It would be his personal problem, were his misguided analysis not linked by RC Wiki with no comment whatsoever. This fact alone shows the blog community there is more interested in appearance of debunking than in thorough understanding and well formed argumentation. -
MarkR at 23:11 PM on 4 February 2011A Case Study of a Climate Scientist Skeptic
dorlomin: most estimates of climate sensitivity do not include carbon cycle feedbacks. Models don't include them properly, nor do observational estimates based on observations we have now. However, some palaeoclimate estimates implicitly include them (because they kind of look at total temperature change divided by total forcing over a long enough period for carbon feedbacks to kick in). There has been some new research into this but I'm not up to date. I'm pretty sure most old estimates and the CMIP3 models (IPCC AR4 ones) don't. And calculations based on the time constant, or heat balance data, or changes over the past century or so don't properly include them either since they're slower than that and we can't predict any quick changes yet. -
dorlomin at 22:18 PM on 4 February 2011A Case Study of a Climate Scientist Skeptic
One of the best posts on the blog. Great to see so much put together in one piece. Do the sensitivity calculations take into account possible realeses of natural sources of carbon gasses as feedbacks or is it purely on atmospheric physics? -
Albatross at 16:22 PM on 4 February 2011More animations of the Warming Indicators
Grypo @1, Nicely done (and same for Chemware and Martin)! Grypo-- I found that I did not have quite enough time to read the text on many of your slides. Maybe shorter versions in larger font, or keep the slides up longer? -
muoncounter at 15:52 PM on 4 February 2011CO2 lags temperature
#241: "because there is so little evidence from direct observations to support the framework" Oh, that's rich. There's so little evidence. Any doubts about the total lack of credibility of the editors of E and E? -
chris at 15:44 PM on 4 February 2011CO2 lags temperature
Berényi Péter at 12:04 PM on 4 February, 2011"I do realize it is a community of climate policy makers who try to do some science in their spare time, as they are posting there regularly in office hours. Check the timestamps."
Oh dear Peter, your prejudices are showing! The RealClimate "community" are extraordinarily productive scientists. We could look at the first two on RickG's list just above, for example, and find that Gavin Schmidt has published since 2005 more than 40 papers (in real science journals) which have been cumulatively cited well over 1000 times, and that Michael Mann has published over 40 papers since 2005 that have been cited around 800 times.... these are truly impressive records of scientific productivity during the period they (and others) have been running RealClimate.org. I wonder whether you misunderstand the nature of science in the modern world. Every grant application we write, for example, must include descriptions on how our research results will be disseminated, and the enhancement of public understanding is a fundamental element of the scientists role. Schmidt and Mann and the "community" at RealClimate illustrate how a straightforward and honest application to obtaining and disseminating knowledge go hand in hand. And while their "timestamps" indicate that they may fulfill some of their public understand roles during office hours (and why not?) you can be sure that like most scientists that work in the public sphere, they will be doing science outside of office hours too! Peter, do we really want our scientists to be "office drones"? Of course not...we want them to be insightful and productuve and their work to be useful and influential....rather like the "community" at RealClimate -
Clearsight at 15:34 PM on 4 February 2011Climate's changed before
It seems that you have alot of scientific information that mis-intreperted, could result in mistaken understanding. I believe that is what is going on in the world today. The simple facts are that 70% of our oxygen comes from phytoplankton found in the ocean. Coral reefs remove about 33% of the world's carbon dioxide. Temperatures have been steadily increasing for the past decade. They are finding that the plankton are living deeper than before. The photic layer of the ocean only extends so far, if we loose the plankton, 70% of the world will die. Coral reefs are bleaching (temporarily dying) at an alarming rate. I have worked outside for 30 straight years and I know it is getting hotter. I have 4 college degrees, two science minors, one B.S. in Zoology, and an IQ of 136. I fininshed in the top 8% of all of my military and college analytical classes. In junior high on the Standford Achievement Test I scored in the top 8% of the entire state in both mathematics and english. I finished top of my critical logic and reasoning class. I am convinced with every fiber of understanding in me that global climate change is happening and if left unchecked, there will be catastrophic events. -
calyptorhynchus at 14:35 PM on 4 February 2011Kung-fu Climate
Unfortunately the MWP isn't as much of a comfort for denialists as they'd like to think. When it ended, social chaos (including the Reformation and wars of religion) erupted across Europe and millions died. If that's what happens when it cools, we can expect something similar when it warms. To the denialist argument "but the climate changes all the time" we should always add "and when it does species go extinct".
Prev 1951 1952 1953 1954 1955 1956 1957 1958 1959 1960 1961 1962 1963 1964 1965 1966 Next


