Climate Science Glossary

Term Lookup

Enter a term in the search box to find its definition.

Settings

Use the controls in the far right panel to increase or decrease the number of terms automatically displayed (or to completely turn that feature off).

Term Lookup

Settings


All IPCC definitions taken from Climate Change 2007: The Physical Science Basis. Working Group I Contribution to the Fourth Assessment Report of the Intergovernmental Panel on Climate Change, Annex I, Glossary, pp. 941-954. Cambridge University Press.

Home Arguments Software Resources Comments The Consensus Project Translations About Support

Twitter Facebook YouTube Mastodon MeWe

RSS Posts RSS Comments Email Subscribe


Climate's changed before
It's the sun
It's not bad
There is no consensus
It's cooling
Models are unreliable
Temp record is unreliable
Animals and plants can adapt
It hasn't warmed since 1998
Antarctica is gaining ice
View All Arguments...


Username
Password
New? Register here
Forgot your password?

Latest Posts

Archives

Monckton Myth #2: Temperature records, trends and El Nino

Posted on 17 January 2011 by robert way

Recently John addressed some of the issues with Christopher Monckton’s paper targeting Michael Steketee’s column in The Australian, where Monckton asserted that the oceans are not accumulating heat. John showed that when you consider the full body of evidence, it is evident that the oceans are indeed accumulating heat thereby contributing to global sea level rise. In the spirit of consulting the full body of evidence, I will address Monckton's claims regarding temperature records, temperature trends and the intensity of 2010’s El Nino.

Mr. Steketee noted that 2010 had the warmest January to September recorded, which Monckton highlighted as cherry-picking for not including a full year of data. Now that the data is in for most indices - what does it show?

To answer this question I looked at more than just the traditional Hadley, NASA and NOAA datasets, but also the measurements of the lower troposphere processed by Remote Sensing Systems (RSS) and the University of Alabama-Huntsville (UAH) as well as the 5 major reanalysis datasets which incorporate station data, aircraft data, satellite data, radiosonde data and meteorological weather modeling. In hopes of being able to demonstrate robustness I have compiled data from the 10 different sources, with these, and 2010’s year-end temperature ranking summarized in Table 1.


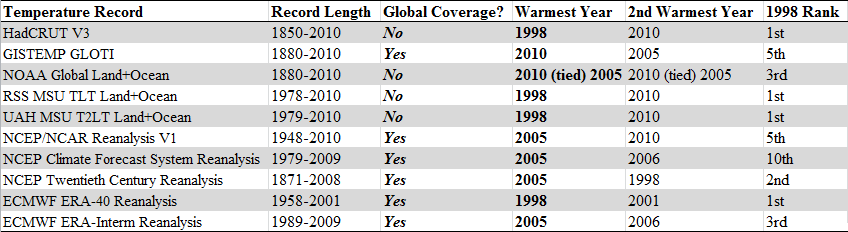
Table 1: Summary of primary data sources.

From the table it is readily apparent that 2010 was a warm year as every data source that includes it has concluded that it was either the warmest or 2nd warmest year on record. However, it seems that the devil of a year in 1998 still was atop the global temperature records for HadCRUT, RSS and UAH. There is one important caveat countering this: the 3rd column shows that all the datasets that include 1998 as the warmest year on record do not have global coverage. In fact amongst datasets with global coverage at least reaching to 2005, there is only one dataset which has 1998 in its top 2 and this record does not include 2009 or 2010. The global coverage identifier is key because it is well known that the exclusion of parts of the Arctic is the reason that Hadley has been undersampling the warming. Furthermore since the satellite records do not include much of the polar regions they cannot be considered to have global coverage either. This is an important caveat particularly because the Arctic climate system has experienced the fastest rate of warming out of anywhere on the planet. Neglecting a region such as this has undoubtedly forced 1998 into a position that it should not be in, as the warmest year in an incomplete record.

Then which year is it?

Each temperature dataset has their own individual caveats so it is difficult to assess which is the most reliable, but a purely unscientific way to look at this issue is to put all the datasets on the same baseline and to average them to create the All Method Temperature Index (AMTI). I have put all the Table 1 datasets on the 1990-2000 baseline (so we could include all) and have averaged them to create Figure 1 below.


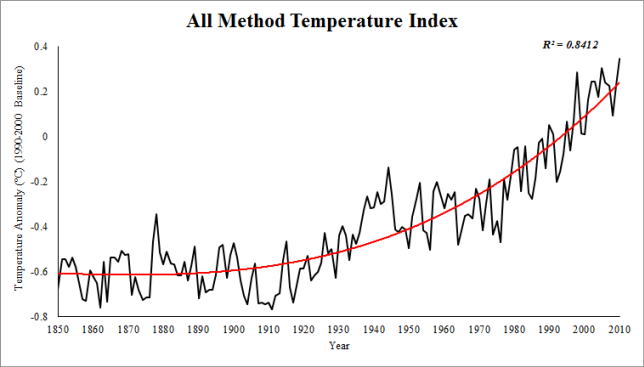
Figure 1: All Method Temperature Index (AMTI). 1990-2000 Baseline.

Based upon the AMTI the overwhelming majority of evidence suggests that 2010 is the warmest year on record, followed by 2005 with 1998 in a close third buoyed by the anomalous warmth demonstrated in the 3 records without global coverage (Hadley, RSS and UAH).

Warming Rates

Now that we have assembled the data, onto some Monckton Myths! Monckton asserts:

“In fact, the rate of warming from 1975-2001, at 0.16 °C per decade, was the fastest rate to be sustained for more than a decade in the 160-year record, but exactly the same rate occurred from 1860-1880 and again from 1910-1940, when we could not possibly have had anything to do with it.”

Let’s have a look at some warming rates for the different indices in Table 2.


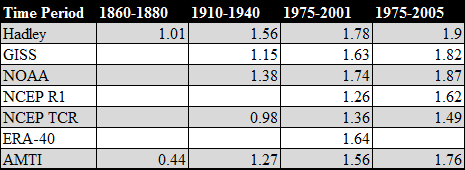
Table 2: Rate of warming for given indices in °C/century.

First we can conclude that Monckton's statement that 1975-2001 was the fastest warming rate for longer than a decade is absolutely wrong as a much higher rate is demonstrated for 1975-2005 in row 5. Secondly, to compare the three periods in Table 2, the only index which covers that period is Hadley, making his 1.6°C per century number wrong for 1975-2001 as it is actually much higher at 1.78°C per century. Based upon the evidence presented here, he cannot support his statement that 1860-1880 had a similar warming rate as it was demonstratively lower than the 1975-2001 warming rate and nearly half the 1975-2005 rate. Finally, regarding the 1910 to 1940 warm period, evidence presented here suggests that only 1 out of the 4 major indices indicates a rate of warming within 0.25°C per century and none within 0.2°C. His claim that the rates are similar is dubious at best.

No global warming since 2001?

Now onto another claim made by Mr. Monckton. Monckton states

“Since late 2001 there has been virtually no “global warming” at all.”

Using the datasets already collected, this shouldn’t be too hard to test. How about computing the trend from 2001 to 2010 (Table 3)? 


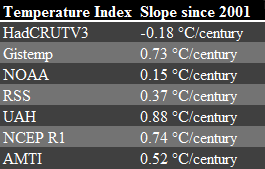
Table 3: Rate of temperature change per century (2001-2010)

It is true that in 1 of the 6 major indices there is in fact a negative slope, however to indicate with such certainty that there has been “virtually no global warming at all” is to ignore the vast majority of scientific evidence suggesting otherwise. Since skepticism is inherent for Monckton he should ask why only 1 of 6 indices shows data supporting his argument.

Monckton makes another similar claim in his “rebuttal” #4 by saying:

“Actually, it is colder” when the statement reads that the world is not cooler compared to 1998.

Same process, computing trends since 1998 to indicate whether or not it has been warming. Figure 5 shows much of the same as Table 4.


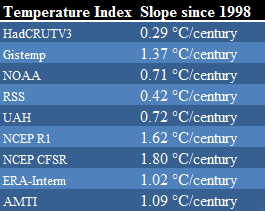
Table 4: Rate of temperature change per century since 1998.

So to summarize: we have already established that 1998 is not the warmest year on record for any truly global analysis, that it has warmed since 2001 and now that it has been warming since 1998 (in some cases significantly).

...Move on people nothing to see here...

A few lines away from his trend comments, Monckton acknowledges that the last decade was the warmest on record but indicates that it is part of a trend of 300 years of global warming. It is interesting to hear Monckton make that claim considering our best climate reconstructions indicate that the 1700s were still right in the midst of the little ice age. Either way if he is insinuating that this warming is some sort of a “rebound” from the LIA then we have already addressed that here. Furthermore, as Figure 2 demonstrates, the vast majority of warming has occurred over the past 110 years where there is strong evidence of a human impact in the early part and undeniable evidence of a strong anthropogenic signal in the latter part.

Is 2010 a strong El Niño year?

Finally to end this lengthy post I will quickly look at several claims made by Mr. Monckton regarding the strength of this year’s El Niño and La Niña. Monckton states:

“...the first nine months of 2010... was dominated by a substantial El Niño… The last few months of the year… showed the beginnings of a La Niña event…"

So was this in fact a strong El Niño year followed by just the beginnings of a La Niña?

According to NOAA, 2010 featured 5 months of El Niño conditions with 7 months of La Niña conditions. During 2010, there was a total of 1 month considered to be a strong El Niño event and 5 months considered to be a strong La Niña event according to NOAA’s criteria. Not exactly the 9 month long, substantial event with the beginnings of a La Niña event is it?

In Conclusion

Monckton dragged us down a road that we should not have had to travel. Short term trends are spurious and year to year rankings are not what matters in the end. What matters is the clear and unambiguous long term warming trend that has accelerated over the last 50 years. This post is also a lesson that even when focusing on short term trends, Monckton's arguments fail to be supported if one does not cherry pick.

0 0

Printable Version  |  Link to this page

Comments

Comments 1 to 28:

  1. Robert, Great job. Just one comment for now. Monckton states: "...but exactly the same rate occurred from 1860-1880 and again from 1910-1940" To which you respond: "....only 1 out of the 4 major indices indicates a rate of warming within 0.25°C per century and none within 0.2°C. His claim that the rates are similar is dubious at best. You have demonstrated unequivocally that the rates of warming are most certainly not "exactly the same". I do not know what the 95% confidence intervals are for the trends, there may be some overlap, but even so, they are most definitely not the same, and in all likelihood recent rates of warming are higher than those observe din 1910-1940, and almost certainly higher than those observed between 1860-1880. Watts has sunk to an almost seemingly impossible new low by allowing this drivel from Monckton to be published on his blog. Time for serious "skeptics" and contrarians (e.g., Lucia) to drop Watts too.
    0 0
  2. Another way that I like to convey the effect of el Nino / la Nina: At most, a moderate el Nino by itself should make one year warmer than the previous year, but shouldn't make it record setter. The strength of the el Nino phases that we've had since 2000 have been unexceptional, yet temperatures have been quite exceptional.
    0 0
  3. Hi Robert Are you using annual or monthly data to calculate the trends in table 3 and 4? When I use monthly data from 2001 to November 2010 I get slightly different trends than you. Besides that I think you should also include significance levels or error estimates. None of the trends are significant at the 95% level. See this plot. The errorbars in the plot are 95% confidence limits.
    0 0
  4. I used yearly data rather than monthly data. I understand this will alter the trends one would expect and that it is perhaps optimal to use monthly data instead but simply out of ease of usage I used yearly. Regarding the 95% significance trends and so on it was suggested previously to use error bars and so on but John suggested to me to leave them out. If we want to put our statistics hat on and evaluate this then of course the trends in many cases are too short to be statistically significant but that does not make the data useless. Certainly Monckton does not make his statements based upon statistical rigour. More or less this post was meant to use his assumptions that he is implicitly making. He is essentially not making any reference to error bars and is treating the values as the 100% confidence values. If we do the same using his own method we find that his argument is flawed regardless.
    0 0
  5. On that topic also if we are to consider things only from the purely statistical perspective we could not conclude with 95% confidence that it has warmed significantly over the last 15 years using hadley but i don't think anyone would really make that argument. Statistics is important and we hate to be aware of these things when we publish and submit papers but we also have to remember that results are not useless because they're not 95% significant.
    0 0
  6. @ Robert Way #5 Phil Jones has stated recently that with fuller data for 2010 the last 15 year trend comes up to the 95% level. See here - http://www.monbiot.com/archives/2010/12/08/impervious-to-learning/ I guess it semantics of Feb 1995 to Feb 2010 from when he made his interview to the BBC, or Nov 1995 to Nov 2010 when he made comments in the Monbiot piece. Also heres a link to the trends I think probably Monkton uses, they don't seem to match yours but state they are from Hadley data? Jo Nova Graph
    0 0
  7. 6, Roughyed, It shouldn't be surprising that the nine additional months of record-setting or near-record-setting warmth from Feb 2010 to Nov 2010 pushed the statistical significance over the edge, especially when it was replacing nine months of dropping temperatures at the end of 1995. This is a case where the end points really affected things, although with an overall warming trend, it shouldn't be surprising that lower values are dropping off the left while higher values are appearing on the right. And as an aside, please avoid linking to Jo Nova nonsense here. It's bad enough when she covers politics, but her version of smoke-and-mirrors hand-waving snake-oil salesmanship "science" has no place on the planet, let alone with any sort of reference from here. If people do want to go there, just remember to take a serious draught of true-skeptic juice before you leave. You will be hit with every silly, underhanded statistics/graphing trick in the book for the duration of your stay, as well as enjoying the company of an extremely venomous, nasty, closed-minded and rather ill-informed collection of regulars in the comments. In fact, it can be fun and informative to identify all of the quite purposeful errors that she makes in either constructing or presenting her data -- such as the oh-so-subtle use of the Greenland ice core data, with the silent implication that it is a good Global indicator, and which ends prior to 1900, before any of the past 110 years of warming... although she then "generously" compensates for that early termination with the "generous" addition of 0.7˚C for 1900-2010 (although she doesn't add that to her graph, so people that like to just look at the pictures without reading and comprehending will get an extra helping of trickery)... even though actual warming in Greenland is anywhere from 3˚C to 8˚C, depending on where and when you look.
    0 0
  8. Monckton here is displaying his usual talent for *cherry picking*! Why choose 2001 to 2010? Normal convention is to go from 1980-1989, then 1990-1999, then 2000-2009. Maybe its because, if he goes from 2000-2009, the warming trend jumps to +0.013 degrees per year (or +1.3 degrees per century)-almost triple the warming for 1980-1989 (+0.0054 per year), & only slightly lower than for 1990-1999 (+0.017 degrees per year). Given that the warming trend of 2000-2009 (or even 2001 to 2010) was against the backdrop of a deep solar minimum, I hardly think that's a result Monckton & his contrarian mates should be crowing about!
    0 0
  9. On 'Is 2010 a strong El Nino year' - although El Nino did not dominate the year, there is a lag between ENSO and temperature response, and I think its quite fair to say that for the first 9 months of 2010 the temperature reponse was dominated by El Nino influence, and that the last few months of the year have shown the beginnings of a La Nina influence on temperatures. However note that in a typical ENSO cycle the response grows very rapidly late in the year and peak warming/cooling is usually reached in January. Assuming a Co2 warming rate the same as IPCC projections, and an ENSO response similar to previous strong La Nina events I'm confident that the first few months of 2012 will be significantly cooler than December 2010, but not quite as cool as the first few months of 2008, which was the last significant La Nina.
    0 0
  10. Oh I certainly understand there is a lag that has to be considered but I don't think it is fair to say that the first 9 months were dominated. In fact by September (the 9th month) Roy Spencer was noting how the temperatures were stubbornly refusing to dip like they should have. http://www.drroyspencer.com/2010/10/september-2010-uah-global-temperature-update-0-60-deg-c/
    0 0
  11. I agree with Robert. While the global SATs are know to lag the MEI/ONI by about 7 months (peak correlation). What Monckton said is incorrect.
    0 0
  12. typo? In the text just below Fig. 1, shouldn't it read ...."1998 in a close third buoyed by the anomalous lack of warmth (or less warmth) demonstrated in the 3 records " rather than - "anomalous warmth demonstrated" ? Great post. Table 1 really puts to rest all the talk about "no warming" since whenever. "It is true that in 1 of the 6 major indices there is in fact a negative slope," I thought this might be a good place to remind readers, again, that this is HadCRUT, known to have a cool bias, due to lack of Arctic coverage.
    0 0
  13. I have a question which I hope will not be considered too off-topic: In looking at the history of temperatures in the 20th century, we see a slowing of temperature rise which I guess goes roughly from 1940 through 1970 or so. In previous discussions I see that this is attributed to sulfate aerosols. OTOH the fact that the slowing occurred roughly starting in 1940 makes me wonder if WW2 had something to do with this. (This is just a historical side note to the larger discussion, I have no hidden agenda.) Thanks to anyone who cares to respond.
    0 0
    Moderator Response: [Daniel Bailey] Welcome to Skeptical Science. You start off with an excellent question. I won't go into it, as it is off-topic here, but there's a couple of nice posts on that topic here and here. Please post any further questions and comments on that subject on the relevant thread. For other questions, the Search function, located in the upper left of every page here, is your friend.
  14. To be fair ... El Niño and La Niña are known to lead global temps by 6 months or so, which means that the 2010 temperature year should be most correctly compared to the SOI year of 7/2009 to 6/2010, which is fairly strong El Niño throughout. Using the same technique, one can also predict that early 2011 temps will be quite cool compared to recent years, as the current La Niña seems to be a doozy.
    0 0
  15. The response lag-time between atmosphere and ENSO events is well-known to be 3-4 months (e.g. here). Hence, one has to look 3-4 months ahead in time to see how global temperatures start and end to respond and not compare month to month values. That said, the previous el nino started officially June 2009 (month 6 of 2009) and lasted until April 2010 (month 4 of 2010). The current la nina started officially July 2010 (month 7 of 2010). Let's take a look when the global atmosphere started to respond to both events using first the lower bound response: 3 months and then the upper bound response: 4 months. 3 months lag El Nino: atmosphere started to respond September 2009 (month 6+3=9) 2009 and ended to respond July (month 4+3=7) 2010. La Nina: atmosphere started to respond October (month 7+3) 2010. 4 months lag El Nino: atmosphere started to respond October 2009 (month 6+4=10) 2009 and ended to respond August 2010 (month 4+4=8). La Nina: atmosphere started to respond November 2011 (month 7+4=11). Now these are lower and upper bound assumptions, but it shows that 2010 was influenced between 7-8 months out of 12 by the previous el nino and between 2-3 months out of 12 by the current la nina. Hence, it is safe to say that 2010 was mainly influenced by the previous el nino and not the current la nina. Taking also into account that the past el nino had a peak strength of 1.8, whereas the current la nina's peak is -1.4, it is even more save to say that the el nino had both a longer and stronger effect on 2010 than the current la nina.
    0 0
  16. WHATDOWEKNOW, Close, but no cigar. Please provide a cite for your "strength" numbers. Everything I have seen (and a quick glance at this confirms it) says that the El Nino was moderate, while the La Nina is very, very strong. In fact, the multivariate ENSO Index (MEI) peaked at 1.502 in Feb for the El Nino, but hit -1.99 in Oct for the La Nina. In contrast (because the two values, positive and negative, do not directly compare) the 1998 El Nino hit a value of 2.677 for two consecutive months (and was 2.4/2.5 for the preceding and following months), while the previous comparably sized La Nina was -1.906 way, way back in Jan 1973, and there is no value (not one!) back to 1950 that beats the strength of the current La Nina. 1.5 for one month in 2010, versus 2.4-2.7 for four consecutive months in 1998. -1.99 for one month in 2010, versus -1.9 all the way back in 1973, and nothing else all the way back to 1950. Another indicator, the SOI, is now the highest (positive correlates to La Nina conditions) it's been since 1973, and you have to go all the way back to 1917 and 1904 to find values that are more pronounced (see here). So, again... a citation for your claims about relative El Nino/La Nina strength, please. The statements about the temperature lag are almost accurate, except that the lag relative to the MEI is only two months, not four. You can apply a four month lag to the SOI, but that flips two months sooner than the MEI. So by your logic the year was influenced by 5-6 months of the tail end of a moderate and relatively brief El Nino, and 6-7 months of the start and heart of a very powerful La Nina.
    0 0
  17. WHATDOWEKNOW, I forgot... see here for clear and indisputable evidence of the two month lag between temps and MEI.
    0 0
  18. In a discussion at Grist with a skeptic, I referred to this article and Table 1 in particular, saying that 1998 was only the warmest year, in data sets that were not global, or which didn't include 2010. His reply questioned UAH not having global coverage. Is there an error here, or is he wrong. Thanks
    0 0
  19. Sailrick @18, Weird, I thought UAH data was the darling product of the "skeptics". Could it be that they are now turning on UAH because it is no longer showing them what they wish to see? Someone recently corrected me on this, but the UAH data is apparently the only true global product out there. The RSS data are truncated near the poles because of issues issues with reliably retrieving the temperature data from the MSU data, so they choose to avoid those areas. The persons 'defense' is irrelevant, because non of the surface products are truly global. Yet, encouragingly (and unfortunate for the person you are debating), there is remarkable agreement between the reanalysis data ( model output data highly constrained by observations), satellite data and various surface temperature records (e.g., NDCD, NOAA, JMA, NASA). In the UAH data 1998 and 2010 are in a statistical tie for warmest year. That said, rankings, while interesting, do not tell the whole story. What counts is the long-term trend, and on that front there is excellent agreement between the products that the warming the last 30 years or so is the greatest rate of warming since circa 1850.
    0 0
  20. Albatross Perhaps I could have worded that better. Basically he was questioning Table 1 above, which shows UAH as not having global coverage. Here's the article at Grist where the debate is ongoing. http://www.grist.org/article/2011-01-14-climate-change-helped-end-the-roman-empire-says-study Feel free to join in. Skeptical Science is being attacked here, after I referenced it in my arguments, if you need any inspiration.
    0 0
  21. #16 sphaerica. IMO you are comparing apples to oranges. The MEI is a RANKING, comprised of six variables: sea-level pressure (P), zonal (U) and meridional (V) components of the surface wind, sea surface temperature (S), surface air temperature (A), and total cloudiness fraction of the sky (C). Some of which are not related to temperature. In addition, the MEI is thus not an actual measurement, such as SST anomaly, but a RANKING. It ranks the strength of ENSO events based on all these 6 variables, not only temperature. So the fact that the La Nina is strong on the MEI scale, doesn't mean it's temperature is extremely low, which in fact it is not. It simply means that ALL variables combined make it strong. I compare ONI-values (SST anomaly in degrees C) with Global land-surface temperature anomalies. (degrees C). Apples to apples. ONI can be found here Based on a temperature only value, which ENSO events in term of strong/moderate/weak are based on, the current La Nina is only moderate. As for your "indisputable evidence for a 2-month lag time"; has that posting been published in the peer-reviewed literature? If not, well... sorry... 3-4 months has (as I clearly indicated with the link in my previous comment). Please compare the ONI SSTs with for example the GISS temps and you'll see the 3-4 month lag time. E.g. the el Nino peaked in Dec 2009 with a SST anomaly of 1.8C, 3 months later the GISS peaks at .85. Even with a 2 month lag time, the atmosphere ended to respond to the El Nino June 2010 and started to respond to the La Nina September 2010. 6 months El Nina vs 4 months La Nina. Whatever you throw at it; it was an EL NINO year.
    0 0
  22. WHATDOWEKNOW i think it's unfair to call apple and orange comparison the use of the MEI index. As we all know the perfect index of a complex phenomenon does not exist. The choice of the index depends on what one is trying to do. Thei MEI index uses several variables which are supposed to describe the teleconnections related to ENSO and how its effect spreads over the globe. So for global comparisons it often is the index of choice. In other cases a different choice may be preferable.
    0 0
  23. A little note for some of the individuals who have used monthly data to calculate trends. Note the following post and RomanM's suggestion to use yearly data. http://statpad.wordpress.com/2010/03/18/anomaly-regression-%E2%80%93-do-it-right/
    0 0
  24. Someone indicated that UAH was a global temperature record because RSS truncates at the poles. I was wondering whether or not this is in fact the case. My understanding is that the orbit would never permit the satellites to give a truly global picture.
    0 0
  25. @ Robert (24) Not my understanding. Both RSS and UAH use data from the AMSU device aboard NOAA-18. UAH developed the TLT Channel (70S to 82.5N), used by both UAH and RSS. Therefore, neither are a true global picture. Until 2013,when the next generation AMSU goes up. NOAA-18 is indeed in a polar orbit Daily data available here: http://www.amsr-data.com/idx/ion-p.exe?page=amsre_daily.ion NOAA-18 Information page: http://nssdc.gsfc.nasa.gov/nmc/masterCatalog.do?sc=2005-018A NOAA-18 real-time tracking page: http://www.n2yo.com/?s=28654 "Christy and Spencer also developed the first version of the TLT dataset. For a global average extending from 70S to 82.5N, we find a warming trend of 0.163 K/decade , while Christy and Spencer (version 5.2) find a warming trend of 0.147 K/decade ." "Globally averaged trends computed over latitudes from 82.5S to 82.5N (70S to 82.5N for channel TLT) are shown in the table below, and include data through December, 2010:" "We do not provide monthly means poleward of 82.5 degrees due to difficulties in merging measurements in these regions, and because these regions are not sampled by all central fields of view." Source: http://www.remss.com/msu/msu_data_description.html#version The Yooper
    0 0
  26. Robert Way #23 in the monthly series the baseline is calculated separately for each month; if not, we'd have a significant annual cycle. The problem of the starting point in presence of a cyclic signal arises instead when using absolute values. Monthly series are usefull when looking at seasonal changes or to try to improve the statistics on relatively short series, but at the expenses of a large autocorrelation and a much larger variability.
    0 0
  27. Not sure if anyone is listening after 2 years but I have been arguing with characters who dispute the "provenance" of what one of them call "John Cook's hand drawn cartoon" (Figure 1). Could Robert tell me what the function fitting the temperature data is?
    0 0
  28. Philip, Figure 1 lists the datasets used to compile this post: HadCRUT V3 (1850-2010) Gistemp Global Land-Ocean Temperature Index (1880-2010) NOAA Global Land+Ocean (1880-2010) RSS MSU AMSU TLT Land+Ocean (1978-2010) UAH MSU AMSU T2LT Land+Ocean (1979-2010) NCEP/NCAR Reanalysis 1 (1948-2010) NCEP Climate Forecast System Reanalysis (CFSR) (1979-2009) NCEP/NCAR Twentieth Century Reanalysis V2 (1871-2008) ECMWF ERA-40 (1957-2002) ECMWF ERA-Interm (1989-2010) Note: Some of the above links seem to no longer work, as perhaps the files were moved on their hosted servers. Anyone having the actual links, please post them.
    0 0

You need to be logged in to post a comment. Login via the left margin or if you're new, register here.


The Consensus Project Website

THE ESCALATOR

(free to republish)


© Copyright 2024 John Cook
Home | Translations | About Us | Privacy | Contact Us