


 Arguments


Recent Comments
Prev 1953 1954 1955 1956 1957 1958 1959 1960 1961 1962 1963 1964 1965 1966 1967 1968 Next
Comments 98001 to 98050:
-
Ken Lambert at 12:56 PM on 21 January 2011Infographic on where global warming is going
ChrisG #26 and AG.W #27 Very good comments ChrisG and AG.W - described the situation better than I did. The essential adjectives are 'global' and 'over time'. ENSO and La Nina are supposed to be 'internal effects' which redistribute heat energy already there within the land/atmosphere/ocean system. Eric #24 is also correct in describing the action of ENSO where large regional net release can spike global average surface temperatures, although the energy balance of ocean heat release should equal evaporation and land/air temperature rise energy equivalents. If not, then ENSO would become an 'external' forcing event -which changes the ballgame completely. It should then join the Table of forcings for the whole globe. MarkR seems to suggest this. -
Eric (skeptic) at 12:52 PM on 21 January 2011Oceans are cooling
BP, I will also reply in the correct thread with a quantified followup to your claim: "Heat content anomaly of the upper 700 m of oceans in the fourth quarter of 2003 is 11.655±0.975×10²² J, while in the third quarter of 2010 it is 9.589±0.690×10²² J,....a net heat loss (of at least 4×10²¹ J)." The Loehle paper http://www.ncasi.org/publications/Detail.aspx?id=3152 shows about a 5×10²² J annual cycle of OHC. From the third to fourth quarter every year the rise is about 2×10²² J or a loss of 2×10²² J when picking a fourth quarter as a starting point and a third quarter as an ending point. or about 5 times the loss you stated in the other thread. The reason is simply that the earth gets closer to the sun during that interval each year. -
AlanW at 12:48 PM on 21 January 2011Infographic on where global warming is going
25 Sphaerica. Confirming you point about the ocean being warmer at the surface than the air. The decadal mean sea surface temperature, Ts, is typically slightly warmer (0.6 to 1 degC on average globally) than the mean near-surface air temperature, Ta, at the same location. There are plots in section 2.2 of doi:10.1016/j.marsys.2008.01.009 (PDF). To me the surprising part of this result was how consistent these maps are (one from ship observations and the others from numerical weather predication reanalysis products, which use observed Ts as a boundary condition) and how well correlated mean Ta and mean Ts are over the entire range of observed values. In the short term Ta and Ts can be very different, but not in the long term. -
WHATDOWEKNOW at 12:40 PM on 21 January 2011Could global warming be caused by natural cycles?
#175. KR thanks for the link; It's been posted under different topics on this website earlier (I think). I have one problem with the MEI: it's a ranking based upon 6 variables, most of which not temperature related. It's neither a measurement, just a multivariate composite index, in which strength of an ENSO event depends on all 6 variables and not on sea surface temperature (anomaly). Thus a strong el nino or la nina, not necessarily means it also exhibits very high or low SST anomalies (as is the case with the current la nina, which has moderate to low SST of -1.4, but ranks high -apparently because several of the other variables are strong-) Hence, I am afraid it's comparing apples to oranges when comparing global temperature anomalies with unit less ranked values. I don't see how one can "correct" temperature with a ranked value. Imo it be more appropriate to use the ONI value, which is a SST anomaly too; unfortunately ONI only dates till 1950. -
WHATDOWEKNOW at 12:30 PM on 21 January 2011It's Pacific Decadal Oscillation
#65 muoncounter; In '68 there was a PHASE REVERSAL, meaning tops become bottoms and vice versa; prior '68 GPTCs were tops and are bottoms post '68 whereas prior '69 LPTCs were bottoms and are tops post '68. Hence, why ENSO events related to tops and/or bottoms depending on if they occurred pre- post '68. The fact then that ENSO events coincide EXACTLY with key PDO events thus proofs they are related. I suggest learning more about the PDO (and probably ENSO cycle too) so you better understand the intricacies of natural cycles, how they inter connect and how they play a role on climate. -
Albatross at 12:24 PM on 21 January 2011Monckton Myth #3: Linear Warming
My response will too appear at the appropriate thread when I have some time. For the record BP, you chose the ridiculously short time frame, not anyone else, you. So now we all have to march down that road, just like Monckton has forced us to do. -
Oceans are cooling
A question for the ocean experts out there: In (I believe) the Why are there fewer weather stations thread someone noted that the temperature anomalies (not temperatures, but anomalies) seen across the surface record have a high correlation over fairly large areas, and hence a reasonable surface temperature anomaly record could be obtained with just a few hundred stations. Is this the case with the Argo and XBT data? Do OHC measures display large area correlations in anomalies, or does the 3D current structure of the ocean prevent that? I'm wondering just how many Argo floats (or better yet, some deeper samples) are required to accurately measure ocean temperatures. -
Eric (skeptic) at 12:22 PM on 21 January 2011Monckton Myth #3: Linear Warming
#81 BP, you said "Heat content anomaly of the upper 700 m of oceans in the fourth quarter of 2003 is 11.655±0.975×10²² J, while in the third quarter of 2010 it is 9.589±0.690×10²² J,....a net heat loss (of at least 4×10²¹ J)." With a mass of 5×10²¹ grams and 1 J per gram per degree C, 0.2 degrees rise in the atmosphere means 1×10²¹ J went into the atmosphere. That accounts for 1/4 of the missing heat. Also OHC rises from the third to the fourth quarter every year (part of the annual cycle, see Climate-cherry-pickers-cooling-oceans.html) So that explains another part of the loss (you picked the 4th quarter in your starting year and the 3rd quarter in your ending year). -
Monckton Myth #3: Linear Warming
Berényi - Replied over on Does ocean cooling prove global warming has ended -
Oceans are cooling
Berényi - Referring to your post here: The Argo network is quite new, expanding rapidly over the last few years, and proper calibration methods are apparently still being developed. The current Argo data (not the badly calibrated 2006 data), along with currently calibrated XBT data from the past, is shown and linked to here. While the last few years (Argo only data) are not increasing at a high rate, they are showing some increase in ocean heat content over that period. Given the inherent variability of the measurements, I don't think that any "decline" can be statistically justified using just the last 7 years of data. Incidentally, you stated that you weren't making any claims about trends? Isn't stating that OHC content "...has got definitely smaller in seven years" a trend statement? I think it's only reasonable to use statistical analysis on a noisy sample - making claims without statistics is, well, not convincing. -
Berényi Péter at 12:05 PM on 21 January 2011Hurricanes aren't linked to global warming
#24 muoncounter at 05:12 AM on 21 January, 2011 But your 'scatterplot' is meaningful? Hardly. What do you mean? Explicate, please. -
Berényi Péter at 11:45 AM on 21 January 2011Monckton Myth #3: Linear Warming
#77 Albatross at 04:22 AM on 21 January, 2011 You continue to focus on ridiculously short periods, as you state in your post @69, to obfuscate and confuse people. You come dangerously close to an ad hominem attack by attributing evil intentions to me. Unfortunately it is you who got confused, and only because you failed to put the necessary effort into trying to understand what actually was said. And what makes it even more shameful on your part is that I know that you know deductions made about trends in these data over such short periods are meaningless, both scientifically and statistically. There was neither statistics nor trends in my line of arguments. Just have a look at the NOAA NODC Global Ocean Heat Content site. Heat content anomaly of the upper 700 m of oceans in the fourth quarter of 2003 is 11.655±0.975×10²² J, while in the third quarter of 2010 it is 9.589±0.690×10²² J, that is, it has got definitely smaller in seven years. It is not a trend, it is a net heat loss (of at least 4×10²¹ J). As Earth is losing heat instead of gaining it during this period, it gets pretty hard to claim a mysterious "pipeline" is still filling. What is more, I have also said we have no valid, reliable OHC data before mass deployment of ARGO floats started in mid-2003. I can support this statement by net TOA radiation balance measurements performed by satellites. There's simply no drop in this quantity in 2003 that could decrease the slope of its integral (which should be proportional to OHC). It means the statement "OHC is flat" is not contradicted by data even before 2003. Therefore you can't even claim some heat was put into the "pipeline" before 2003 which didn't have a chance to come out yet but it can haunt us any time in the future. Anyway, it would be nice to know what physical processes do you think are supposed to constitute said pipeline. Heat capacity of the upper 700 m of oceans is more than two hundred times that of the atmosphere. Latent heat absorbed by melting ice is negligible. If there were a 0.6 W/m2 radiative imbalance at TOA as proposed, that would mean an annual heat gain of 0.97×10²² J. That could melt 2.9×10¹⁶ kg ice, which would increase global sea level by 80 mm in each year. Annual sea level rise during this period as measured by Jason is 2 mm and only a fraction of it could come from ice melting. Effective heat capacity of land is also negligible, as it is only the upper 1 m or so of soil that follows atmospheric temperatures. Of course the deep ocean (below 700 m) remains as a last resort. However, to sequester heat there without increasing heat content of the upper layers one would need a teleport mechanism which is described nowhere. And once again, choosing properly measured intervals or regions instead of ones that are not is hardly cherry picking. Of course I can see the tendency as much as anyone in mainstream climate science to pick far away places or ancient times with very sparse or nonexistent measurement networks as examples for scary processes, but that is surely no way to go. First you have to understand what is given. As soon as it is done, you can venture further, but never sooner. Besides, your post if off topic, so I am surprised your post @69 was even permitted. It is not off topic. dana1981 happened to deploy the "warming in the pipeline" meme. I could see no other way to refute it than to show the pipeline was empty. In order to do that I needed both OHC & net TOA imbalance. However, if it is not advisable to challenge opinions expressed in articles at this site, that's entirely another matter. In that case I'm surprised too. -
Chris G at 10:50 AM on 21 January 2011Monckton Myth #5: Dangerous Warming
OT I was organising my climate change links and I found (again) this jewel of a lecture series. "Global Warming: Understanding the Forecast" by David Archer http://geoflop.uchicago.edu/forecast/docs/lectures.html I thought it might deserve a link from this site, possibly under Resources, but neither site is mine; so, leaving it to you to decide. From what I sampled it contains much of the same material as his book, but I read the book and haven't watched the whole series.Response: Thanks for the URL. Have added it to the Resources page. All the videos are in mp4 format too - very convenient for me to download straight onto my iPad for easy viewing. -
Chemware at 10:08 AM on 21 January 2011Monckton Myth #5: Dangerous Warming
The focus of this article is on temperature changes (global and local) caused by climate change, and on the deniers attitude of "Oh, 2°C isn't that bad - it is even good". While we know these temperature changes can directly cause great "economic damage" (eg: Moscow's summer), they pale into comparison with the secondary effects: greater storm and rainfall intensity leading to flooding, and in the future rising sea levels leading to flooding of the world's major cities (Brisbane is facing another king tide today). So while the man in the street might think "2°C isn't that bad - it will make winter nicer", his attitude may well change when you (or rather his insurance company) explain the secondary consequences of that change. -
dana1981 at 09:54 AM on 21 January 2011Monckton Myth #5: Dangerous Warming
That's a good point, Bodo. -
JMurphy at 09:34 AM on 21 January 2011It's Pacific Decadal Oscillation
thepoodlebites wrote : "Jan. 2008, not 2009, See UAH. Notice the dip below -0.2 C." Let me try again then : So, you're saying that the anomaly you are predicting for Jan 2011 ("near or below zero") will be similar to that for "Jan. 2008...below -0.2 C" - a couple of years before 2010, which UAH list as the 2nd warmest in their records, i.e. warmer than 2008 - and that this will subsequently "wipe out" the UAH positive trend of roughly 0.4C seen over the last 30 years ? I still can't see it so maybe you should show how you work that out ? -
muoncounter at 09:21 AM on 21 January 2011Could global warming be caused by natural cycles?
#174: "I don't believe it is only AGW. That simply makes no sense" And so we reach the inevitable goal line stand. I show you peer-reviewed research that suggests changes to el Nino are based on AGW; that confirms that human activity can and does alter global phenomena. And you can only say 'I don't believe', 'that makes no sense'. "if a model predicts/says it's because of AGW" Models are tests of hypotheses. They do not merely reproduce the input parameters; there is always a free variable. If you want to take issue with the techniques of climate modeling, see the thread Models are unreliable. But if you don't believe models in general, I strongly suggest you refrain from flying, driving, crossing bridges, etc. "We should then be even more vigilant to not contribute (attribute?) the wrong cause to an observed trend." Come on. If someone says your house is on fire, is your first thought to water your lawn? Mountains of scientific evidence point in the same direction, but nope, 'we need to be even more vigilant'. More vigilant about what? Do you apply the same 'vigilance' to unproven ideas about PDOs and solar cycles and the phases of the moon? I'd like to see that in action: one 'skeptic' saying no to another. -
Bodo at 09:20 AM on 21 January 2011Monckton Myth #5: Dangerous Warming
Thank you for the article! You could add, that its the speed of climate change what really matters. Perhaps a warmer climate has advantages for species, but the rate of change is too high that they can adapt. I think thats the main point and Monckton fails to see that. -
Could global warming be caused by natural cycles?
whatdoweknow - I would suggest looking at this thread at Open Mind. Tamino (a very skilled time series analyst) has examined the temperature record against the MEI, sunspot numbers, volcanic aerosols, the annual cycle, and a linear trend, since 1975. These factors separate very clearly, back to the records of the input forcings, leaving a slightly noisy linear trend behind, with excellent agreement from all temperature records.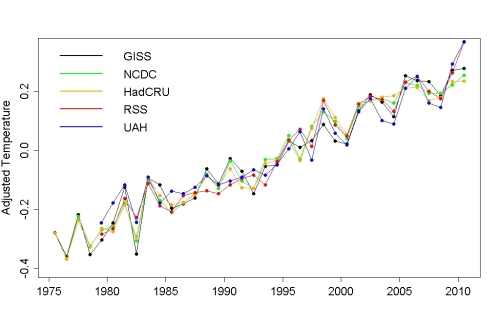 ENSO and PDO push energy around - they don't create or destroy it. What changes they make in cloud cover, water vapor, and other radiative forcings is cyclic - and it cancels over a few cycles to no change.
CO2 forcings, based on our emissions, quite sadly do not cancel out.
ENSO and PDO push energy around - they don't create or destroy it. What changes they make in cloud cover, water vapor, and other radiative forcings is cyclic - and it cancels over a few cycles to no change.
CO2 forcings, based on our emissions, quite sadly do not cancel out.
-
Riccardo at 08:40 AM on 21 January 2011Monckton Myth #2: Temperature records, trends and El Nino
WHATDOWEKNOW i think it's unfair to call apple and orange comparison the use of the MEI index. As we all know the perfect index of a complex phenomenon does not exist. The choice of the index depends on what one is trying to do. Thei MEI index uses several variables which are supposed to describe the teleconnections related to ENSO and how its effect spreads over the globe. So for global comparisons it often is the index of choice. In other cases a different choice may be preferable. -
WHATDOWEKNOW at 08:19 AM on 21 January 2011Could global warming be caused by natural cycles?
#164 muoncounter. I don't know what has shifted this. I don't believe it is only AGW. That simply makes no sense (on a global scale the atmosphere responds to the oceans not the other way around, especially during ENSO events. So why all of sudden should that be the other way around?). If a model predicts/says it's because of AGW, it's simply based on the assumptions put in that model. If one of those assumptions is that AGW will influence ENSO than you have a self fulfilling prophecy. I am just afraid we're reaching that point in climate science and AGW. Clearly the PDO and ENSO are interconnected and we need to better understand that relationship and others (such as solar cycles and their relation to PDO and ENSO) before we say/think it's all AGW. Just because one thinks AGW plays a role, does not mean we should not be critical anymore. We should then be even more vigilant to not contribute the wrong cause to an observed trend. -
WHATDOWEKNOW at 08:02 AM on 21 January 2011Monckton Myth #2: Temperature records, trends and El Nino
#16 sphaerica. IMO you are comparing apples to oranges. The MEI is a RANKING, comprised of six variables: sea-level pressure (P), zonal (U) and meridional (V) components of the surface wind, sea surface temperature (S), surface air temperature (A), and total cloudiness fraction of the sky (C). Some of which are not related to temperature. In addition, the MEI is thus not an actual measurement, such as SST anomaly, but a RANKING. It ranks the strength of ENSO events based on all these 6 variables, not only temperature. So the fact that the La Nina is strong on the MEI scale, doesn't mean it's temperature is extremely low, which in fact it is not. It simply means that ALL variables combined make it strong. I compare ONI-values (SST anomaly in degrees C) with Global land-surface temperature anomalies. (degrees C). Apples to apples. ONI can be found here Based on a temperature only value, which ENSO events in term of strong/moderate/weak are based on, the current La Nina is only moderate. As for your "indisputable evidence for a 2-month lag time"; has that posting been published in the peer-reviewed literature? If not, well... sorry... 3-4 months has (as I clearly indicated with the link in my previous comment). Please compare the ONI SSTs with for example the GISS temps and you'll see the 3-4 month lag time. E.g. the el Nino peaked in Dec 2009 with a SST anomaly of 1.8C, 3 months later the GISS peaks at .85. Even with a 2 month lag time, the atmosphere ended to respond to the El Nino June 2010 and started to respond to the La Nina September 2010. 6 months El Nina vs 4 months La Nina. Whatever you throw at it; it was an EL NINO year. -
thepoodlebites at 07:59 AM on 21 January 2011It's Pacific Decadal Oscillation
#63 Sorry, typo, Jan. 2008, not 2009, See UAH. Notice the dip below -0.2 C. -
thepoodlebites at 07:47 AM on 21 January 2011It's cooling
#109 "we can measure Total Solar Irradiance, and it's actually decreasing a little right now." This is actually kinda funny, See TSI. Can you specify "a little"?Moderator Response: See the Argument "It's the Sun," and continue the conversation there. -
dana1981 at 07:32 AM on 21 January 2011Monckton Myth #5: Dangerous Warming
Whoops sorry moderator, I didn't see your request to take this discussion to the water vapor thread. That's all I wanted to say on the matter!Moderator Response: No problem. But Bill Peddie, if you want to reply, please do so on the water vapor or residence time threads. -
dana1981 at 07:31 AM on 21 January 2011Monckton Myth #5: Dangerous Warming
Bill, the atmosphere can only hold a certain amount of water vapor. If the atmosphere gets hotter, it can hold more. But no matter how much water vapor we emit, the atmosphere will not be able to hold any more (unless it warms). Because of the short residence time of water vapor in the atmosphere, even if we emit a large quantity, it will just precipitate out of the atmosphere quickly. Thus it can't cause global warming. However, if some other factor warms the atmosphere (like an increasing greenhouse effect), then the atmposphere can hold more water vapor, which in turn will increase the greenhouse effect further and cause additional warming. This is why water vapor is referred to as a feedback. It doesn't cause global warming, it only amplifies it. -
Alexandre at 07:20 AM on 21 January 2011Monckton Myth #5: Dangerous Warming
The main problem here is the speed of warming. Even a very fast natural warming like the PETM could be measured in thousands, or tens of thoudands of years. Now we're talking about the possibility of a 6ºC warming in a century or two. That's even faster than some animal species can travel to catch up with it, let alone adapt. The Triassic may have been hot, but it did not happen overnight. We will not have T-rexes here in 2 centuries, just because the temperature is roughly the same. The ecological consequences will be dire. Likewise, our economy has evolved in this stable climate we've had since the Holocene began. Claiming that we can just shuffle it and it will turn out to be something better in the end is just wishful thinking. Weather extremes are usually not economically benign. We already have anedoctal reports of rainy seasons in Africa becoming shorter and nastier. The late rain does damage when it's not there in the early season, and does damage again when it comes, in a monsoon-like fashion. Calling this "beneficial" just because we had big dinosaurs at that temp hundreds of millions of years ago is just irresponsible. -
Phila at 07:16 AM on 21 January 2011Monckton Myth #5: Dangerous Warming
Bill Peddie: Surely this is a very elementary error. You seem to be misunderstanding the article. The basic point is that CO2 causes warming, which increases water vapor, which contributes to warming. The distinction between residence times -- at least as I understand it -- is basically the distinction between a forcing and a feedback. Could you make your objection a little clearer? I would stress there is still a great deal I dont understand If you really believe this, then it would be reasonable for you to assume that it's you who's making an elementary error. Did you read the linked article on residence time, by any chance?Moderator Response: Despite Bill Peddie continuing the discussion on this thread, will everybody responding to him please do so on the water vapor thread? -
Neutrino at 07:10 AM on 21 January 2011Monckton Myth #3: Linear Warming
NETDR, The equation I used (∆F = 5.35*ln(C/Co) comes from a 12y old paper Myhre 98. As far as I know thats the standard aproximation of the CO2 radiative forcing. Its odd you focused on the 5.35 rather than the important fact that the ln is taken of a ratio of CO2 concentrations. Your 4% increase is from a baseline of 1ppm not from todays or pre industrial numbers. So again from your own numbers, the forcing from now till 2100 would be 1.51W/m^2 for linear compared to 2.92W/m^2 for quadratic. Thats a 94% increase in radiative forcing! Calling that a trivial difference is disingenuous. Saying that the linear is close enough is just plain wrong. Even your conservative quadratic gives nearly double the forcing at the end of the century. Just because you feel that a 4% increase in the total radiative forcing due to CO2 is trivial doesnt change reality. That trivial 4% translates to a 1.41W/m^2 forcing which, given a climate sensitivity of 0.8, works out to an additional 1.13C temperature increase. -
mclamb6 at 07:08 AM on 21 January 2011Monckton Myth #5: Dangerous Warming
Bill, At the risk of sounding naive/ignorant, the best comparison I would be able to offer is that a thinner blanket that is covering me 100% of the time will keep me warmer (or have as great a warming effect on me) as a thicker blanket that is constantly removed...assuming the analogy holds, I fail to see the fundamental error. -
Lou Grinzo at 06:54 AM on 21 January 2011Monckton Myth #5: Dangerous Warming
Great piece. I also want to stress something Ron brought up above -- the inherent uncertainty in our proclamations of what is and isn't a "safe" or "acceptable" level of warming. I've been harping for quite some time that the 2C guardrail is much older than most people realize, which means it was chosen before all of the climate science discoveries of the last few decades, discoveries that heavily imply a lower "safe" limit than 2C. The oldest reference I know of to 2C came in a UN-sponsored study involving a 15-member committee from 58 countries that was published in 1972(!), called Only One Earth. The graf I quoted on my site from that book: ---------------------------------- Clearly man has had nothing to do with these vast climatic changes [moving in and out of ice ages] in the past. And from the scale of the energy systems involved, it would seem rational to suppose that he is not likely to affect them in the future. But here we encounter another fact about our planetary life: the fragility of the balances through which the natural world that we know survives. In the field of climate, the sun’s radiations, the earth’s emissions, the universal influence of the oceans, and the impact of the ice are unquestionably vast and beyond any direct influence on the part of man. But the balance between incoming and outgoing radiation, the interplay of forces which preserves the average global level of temperature appear to be so even, so precise, that only the slightest shift in the energy balance could disrupt the whole system. It takes only the smallest movement at its fulcrum to swing a seesaw out of the horizontal. It may require only a very small percentage of change in the planet’s balance of energy to modify average temperatures by 2°C. Downward, this is another ice age; upward, a return to an ice-free age. In either case, the effects are global and catastrophic. ---------------------------------- Seems like at least some people had figured out nearly 40 years ago that 2C of warming wasn't such a terrific idea. -
Bill Peddie at 06:49 AM on 21 January 2011Monckton Myth #5: Dangerous Warming
Well I have done as the moderator suggested and gone to the article which shows why Carbon Dioxide is more important than water as a Greenhouse gas. The article says: "The other factor to consider is that water is evaporated from the land and sea and falls as rain or snow all the time. Thus the amount held in the atmosphere as water vapour varies greatly in just hours and days as result of the prevailing weather in any location. So even though water vapour is the greatest greenhouse gas, it is relatively short-lived. On the other hand, CO2 is removed from the air by natural geological-scale processes and these take a long time to work. Consequently CO2 stays in our atmosphere for years and even centuries. A small additional amount has a much more long-term effect." Surely this is a very elementary error. The water and the carbon dixide does not hold onto the energy it absorbs, it loses it in collisions which occur usually within microseconds. It therefore only matters what the concentration of water molecules is at any one instant - not how long it stays in the atmosphere. The reason why water absorbs the Sun much better is because its bonding enables it to absorb at many points of the spectrum whereas carbon dioxide with its different architecture and bonding only has three major absorbtion peaks in the appropriate spectrum region. I would stress there is still a great deal I dont understand but I would suggest that elementary stuff gets fixed in your replies.Moderator Response: Thanks for reading that post. You also need to put comments about that post on that thread rather than this one. -
Bob Lacatena at 06:48 AM on 21 January 2011Monckton Myth #5: Dangerous Warming
8, dana1981,So ... use of current temps as the reference point isn't really a big deal.
I kind of disagree. Temps are changing so fast, what is "current temps?" 1979? 1985? 2000? 2010? I recently got annoyed because Spencer found a perfectly good reason to change his baseline from one range to another.... we have just switched from a 20 year base period (1979 – 1998) to a more traditional 30 year base period (1981-2010) like that NOAA uses for climate “normals”.
I was already annoyed with his usual graph, because he hadn't set his baseline to 1979, when the satellite record began, but rather to the average from '79 to '98, which means something equivalent to roughly 1990, which conveniently, visually skips over a full decade of warming. It doesn't help that he uses other tricks, like a Y axis scale that minimizes the variations, and a thick blue line that further blurs things. Today, skeptics and scientists alike are generating many graphs with a baseline set to the midpoint (average) of the range of available measurements (1979-2010 for satellite, for example). But the instinctive reaction of most people is to view zero as normal. Setting zero to the period average, but moving one end point of that average, effectively keeps raising the base temperature, and ignoring all warming prior to that point. In my mind, I always consider warming relative to 1979, which appears to be the point at which warming kicked in and aerosol dampening turned off. It appears to be close to what should be the "natural" temperature of the planet at this point in time were it not for elevated CO2 in the atmosphere. But my point is that "current" is always a relative term, and it needs to be nailed down whenever anyone says anything. It needs to be stated clearly. 2˚C over today's temperatures (since we've already warmed about 0.9˚C) is pretty dangerously dang hot. -
dana1981 at 06:25 AM on 21 January 2011Monckton Myth #5: Dangerous Warming
Thanks Byron. I was going to make that point, but Steketee referenced 2-3°C from pre-industrial, and Monckton referenced 2°C from present, which is within Steketee's range. Sometimes we refer to temps in relation to pre-industrial, and sometimes from current temps. Even the IPCC uses both, as mentioned in the article. So Monckton's use of current temps as the reference point isn't really a big deal. -
JMurphy at 05:57 AM on 21 January 2011Could global warming be caused by natural cycles?
I have replied to Sasquatch on the It's not bad thread.Moderator Response: Thank you for redirecting the conversation! -
JMurphy at 05:55 AM on 21 January 2011It's not bad
Sasquatch wrote (on the Could Global Warming be caused by Natural Cycles thread) : "I'm currently pursuing a M. Sci. in Environmental Systems Engineering at a major liberal arts university in the US." Do you describe some of your universities as "liberal", in America ? What does that mean ? Sasquatch also wrote : "I do not personally believe that increased levels of CO2 can initiate major changes in the climate." What do you mean by "major changes" and where have you found the sources for your belief ?Moderator Response: [muoncounter] Liberal arts is a catch all term used in universities to describe general studies in the humanities, math or science. It must be a fairly large university to offer a Master's in 'engineering' as well as liberal arts. It is not a political term in this context. -
muoncounter at 05:37 AM on 21 January 2011Infographic on where global warming is going
#29: You stated in #4, "According to UAH satellite records"; going back to the '70s isn't cherrypicking, its using the entire satellite record. But rather than say 'we might see a different slope,' let's look at the actual temperature reconstructions. Per Figure 8 in that post, all trends are between 0.13 and 0.18 degC/decade. Not so very different after all. Further comments regarding temperature trends should go to the appropriate thread. -
Philippe Chantreau at 05:36 AM on 21 January 2011Could global warming be caused by natural cycles?
Sasquatch, has your classmate taken into consideration that greenhouses have temperature regulation mechanisms? I mean, the whole point of a GH is to have optimized conditions. Was her study exclusively on GH with enhanced CO2 and disabled temperature regulation systems? Why would anyone do that? I have to wonder what exactly was the experimental design here. I don't know what is in your classmate's paper but the way you describe that particular point makes little sense. If you are going to include some of your statements above in your paper, you want to remove the "almost certainly" from them in order to be more credible. It is not almost certain that CO2 has an effect on climate, it is absolutely certain. You may argue if you want that the effect is too small to be consequential or whatever. But saying that it is almost certain is like saying that CO2 almost has radiative properties. By the same token, it is certain that the increased atmospheric CO2 comes from human activity. The isotopic signature clearly shows it. This site has posts on the subject. I don't understand what you mean by "research from various institutions." Research comes from researchers. It is published in peer-reviewed journals. Institutions producing research are usually universities but if the research is not in serious, well established peer-review publications, you should stay away from it, regardless what institution is involved. Stuff called research that comes from think tanks with an agenda is useless. I doubt that papers squeaked by in low impact journals or publications of dubious quality are an asset in a thesis paper. There is so much in the legitimate litterature anyway that there is no need to use subpar sources. And last point: not to be pedantic but if you're writing a PhD paper, watch your spelling. "it's" is the contraction of "it is", not the possessive. If you repeat it a few times, its true nature as a grammatical error shows and it's no longer forgiven as a typo. Everyone makes the confusion in the media and elsewhere but a graduation research paper must be better than that.Moderator Response: Sasquatch, if you reply to these questions, please do so on the appropriate threads. For example, to discuss the roles of CO2 and temperature on plant growth, comment on one of the two relevant threads I pointed you to earlier. You can post a short comment on this thread, pointing to your comment on that relevant thread. That also applies to anyone responding to Sasquatch's original comment here. Further off topic comments will be deleted. -
Byron Smith at 05:35 AM on 21 January 2011Monckton Myth #5: Dangerous Warming
PS Thanks Dana once again. This was just a small suggestion for improvement. -
Byron Smith at 05:35 AM on 21 January 2011Monckton Myth #5: Dangerous Warming
The answer mentions but doesn't highlight the fact that Monckton also confuses matters by speaking of 2ºC from the present, whereas the IPCC refers to 2ºC from pre-industrial times (about 1ºC above present). -
Albatross at 05:28 AM on 21 January 2011Monckton Myth #5: Dangerous Warming
Bill, your post is largely off topic. I will not address your misguided ideas about the source of CO2 and water vapor. I'm pretty sure that Lindzen would disagree with you on both counts though. Regarding Lindzen's intriguing stance on regional temperatures , which is more or less on topic-- I cannot be sure exactly what you or he are trying to convey in opposition to global warming by mentioning that. Of course regional temperatures are important. Scientists also know that there is large regional variability in annual temperatures, and that this inter-annual and intra-annual variability increases as the time window and area decrease. Let me demonstrate the importance of regional variability, and what a warming of + 2 K in the mean annual global might mean. Here is the annual global surface temperature anomaly map for 2010 when the global anomaly was +0.63 K with respect to the 1951-1908 baseline: Note the marked regional variability. Now what did this seemingly trivial (to some) warming mean for the people who live in and around Moscow this past summer when they experienced an unprecedented heat wave in late July and early August that killed many thousands of people? Here are the monthly, seasonal and annual temperature anomalies for Moscow from GISTEMP (again with respect to the 51-80 baseline:
July: +7.8 K
August: +5.2 K
JJA (Boreal summer): +5.0 K
Annual (2010): +2.0 K
So in a year when the mean annual global temperature was +0.63 K, Moscow experienced a summer with mean temperatures +5 K above average, with a mean annual temperature anomaly of +2 K.
A mean annual temperature anomaly of 2 K for a given location is not trivial, and as shown above doesn't mean that each and every day was only 2K warmer than average.
What I am driving at here, and what Lindzen also knows, is that increasing the planet's mean annual temperature by +2 K will manifest itself as much greater warming at regional and seasonal scales. The reason being is that the warming shifts the probability distribution function of temperature to the right, which means that the tails (extremes) in temperature are increased. It is these extremes in temperature (and precipitation), which have already been detected and which will continue to increase in frequency and magnitude, that will pose huge problems for society in the future. And that is before we have even begun to address the negative impacts rising global ocean levels and ocean acidification.
Global warming doesn't mean that the whole planet will warm uniformly, scientists know that. They predicted many years ago that the northern high latitudes would warm much faster than other portions of the planet. We are indeed witnessing that. For example, Arctic amplification has resulted in the Arctic recently warming about 3 times faster than the the planet as a whole. And that has worrisome consequences in terms of positive feedbacks.
Note the marked regional variability. Now what did this seemingly trivial (to some) warming mean for the people who live in and around Moscow this past summer when they experienced an unprecedented heat wave in late July and early August that killed many thousands of people? Here are the monthly, seasonal and annual temperature anomalies for Moscow from GISTEMP (again with respect to the 51-80 baseline:
July: +7.8 K
August: +5.2 K
JJA (Boreal summer): +5.0 K
Annual (2010): +2.0 K
So in a year when the mean annual global temperature was +0.63 K, Moscow experienced a summer with mean temperatures +5 K above average, with a mean annual temperature anomaly of +2 K.
A mean annual temperature anomaly of 2 K for a given location is not trivial, and as shown above doesn't mean that each and every day was only 2K warmer than average.
What I am driving at here, and what Lindzen also knows, is that increasing the planet's mean annual temperature by +2 K will manifest itself as much greater warming at regional and seasonal scales. The reason being is that the warming shifts the probability distribution function of temperature to the right, which means that the tails (extremes) in temperature are increased. It is these extremes in temperature (and precipitation), which have already been detected and which will continue to increase in frequency and magnitude, that will pose huge problems for society in the future. And that is before we have even begun to address the negative impacts rising global ocean levels and ocean acidification.
Global warming doesn't mean that the whole planet will warm uniformly, scientists know that. They predicted many years ago that the northern high latitudes would warm much faster than other portions of the planet. We are indeed witnessing that. For example, Arctic amplification has resulted in the Arctic recently warming about 3 times faster than the the planet as a whole. And that has worrisome consequences in terms of positive feedbacks.
-
Daniel Bailey at 05:25 AM on 21 January 2011Infographic on where global warming is going
adrian smits (29) Why your cherry-pick of 1936? Why not 1934? Why not go back to Year Zero: (and yes I know it's a NH graph; I'm hiliting the cherry-pick of the question with another cherry-pick; dramatis ironae in action)
All silliness aside, the point in making adjustments for known cycles is to reduce the noise in the data to get at the signal in the data. The same principle as to why people wear sunglasses on sunny days: to see better. Let's look back to 1880 (global combined land+ocean):
(and yes I know it's a NH graph; I'm hiliting the cherry-pick of the question with another cherry-pick; dramatis ironae in action)
All silliness aside, the point in making adjustments for known cycles is to reduce the noise in the data to get at the signal in the data. The same principle as to why people wear sunglasses on sunny days: to see better. Let's look back to 1880 (global combined land+ocean):
 The overall trend is up, despite noise inherent in the signal. The point is: we have a pretty solid idea of how the system works, that it is heating up, and why that is.
Getting pretty far off-topic here. Please use the search function to find a more appropriate thread if you wish to continue this discussion.
The Yooper
The overall trend is up, despite noise inherent in the signal. The point is: we have a pretty solid idea of how the system works, that it is heating up, and why that is.
Getting pretty far off-topic here. Please use the search function to find a more appropriate thread if you wish to continue this discussion.
The Yooper
-
muoncounter at 05:19 AM on 21 January 2011It's Pacific Decadal Oscillation
#64: "Do we really need much more proof " Your examples hardly prove anything. In one case el Nino coincides with a warm to cold PDO shift, in another, it coincides with cold to warm. In one case la Nina coincides with highest PDO, in another it coincides with lowest PDO. Is that supposed to be causal? -
muoncounter at 05:12 AM on 21 January 2011Hurricanes aren't linked to global warming
#23: "Named storms is ... ." But your 'scatterplot' is meaningful? Hardly. Let's stop throwing judgments around. Perhaps an appeal to actual science is in order. Here's Elsner 2008: Atlantic tropical cyclones are getting stronger on average, with a 30-year trend that has been related to an increase in ocean temperatures over the Atlantic Ocean and elsewhere ... Knutson et al 2008 report a different view: we assess, in our model system, the changes in large-scale climate that are projected to occur by the end of the twenty-first century by an ensemble of global climate models, and find that Atlantic hurricane and tropical storm frequencies are reduced. At the same time, near-storm rainfall rates increase substantially ... What's worse? More frequent storms or stronger storms with heavier rainfall events? Check the residents of the US Gulf Coast or Queensland for their preferences. -
WHATDOWEKNOW at 05:04 AM on 21 January 2011Northern hemisphere warming rates: More than you may have heard
#59. I've started with a 12-month momentum analysis on seasonally adjusted GISS data since 1900. Below I've pasted the momentum data for each season (wi=winter, sp=spring, su=summer, fa=fall) for the last decade (which some claim hasn't shown any or much warming). The Momentum indicator is a speed of movement (or rate of change) indicator, that is designed to identify the speed (or strength) of a price movement. The fall and winter 2010 seasonally adjusted data are missing since there's not enough data yet to calculate seasonally adjusted values for those seasons. Either way, if you'd plot this data and run a linear regression line; the trend is negative: -0.0042, but the r2 is also very low: 0.0042. Now a low r2 doesn't mean it's not significant (but that's a whole other story), what this tells me is that momentum on average over the last 10 years hasn't changed much, if any the momentum of temperature is on average downwards moving towards negative territory indicating to me that the rate of change in temperature has been slowing down slowly. Now if this were a stock, I would start to consider selling it as it's upward movement (yes it's still going up) is starting to slow down (a term also called: going parabolic) season/date momentum 2000.0 wi 11% 2000.3 sp -5% 2000.5 su -9% 2000.8 fa -10% 2001.0 wi -22% 2001.3 sp -25% 2001.5 su -42% 2001.8 fa 12% 2002.0 wi 21% 2002.3 sp 32% 2002.5 su 20% 2002.8 fa 28% 2003.0 wi 31% 2003.3 sp 4% 2003.5 su 0% 2003.8 fa 35% 2004.0 wi 41% 2004.3 sp 8% 2004.5 su -17% 2004.8 fa -21% 2005.0 wi 12% 2005.3 sp -11% 2005.5 su -6% 2005.8 fa 14% 2006.0 wi 38% 2006.3 sp 0% 2006.5 su -22% 2006.8 fa 1% 2007.0 wi 19% 2007.3 sp 18% 2007.5 su 18% 2007.8 fa 3% 2008.0 wi 10% 2008.3 sp -33% 2008.5 su -27% 2008.8 fa -29% 2009.0 wi 18% 2009.3 sp -1% 2009.5 su -23% 2009.8 fa 8% 2010.0 wi 14% 2010.3 sp -2% 2010.5 su -1% 2010.8 fa 2011.0 wi Looking at the entire data set, momentum spiked in 1995 and has been decreasing ever since, with a big negative momentum in 2001. -
Phila at 04:56 AM on 21 January 2011Monckton Myth #5: Dangerous Warming
Bill Peddie should also probably look at Lindzen and Choi show low climate sensitivity. -
muoncounter at 04:51 AM on 21 January 2011Could global warming be caused by natural cycles?
#168: Pirate, Try Google Scholar. Type a search phrase such as 'climate change natural cycle' and look at the published science that becomes available to you. That search just gave me 1.39 million results, but the even just the top 30 or so might do. -
muoncounter at 04:48 AM on 21 January 2011Could global warming be caused by natural cycles?
#169: "completing a research paper on AGW " Are you actually researching the science of AGW? It sounds like you've already formed your conclusions. "normal state of the planet is to be glaciated." Really? During what time period? You might want to check your sources for that. Be aware that on this site, you need to show your work and avoid making sweeping unsubstantiated generalizations (especially those that are false). "I do not personally believe that increased levels of CO2 can initiate major changes in the climate. I do believe they can contribute a great deal to climate change." In a science paper, your personal beliefs shouldn't interfere. You should look at prior threads Its not us, Its a natural cycle and CO2 is not the only driver. Preferably, for your grade's sake, before you form your conclusions. -
Phila at 04:41 AM on 21 January 2011Monckton Myth #5: Dangerous Warming
Bill Peddie: Most of the atmospheric scientists I am familiar with say that water is the main greenhouse gas and that carbon dioxide is mainly coming from the sea in response to slightly warmer temperatures. Names and cites, please. -
adrian smits at 04:38 AM on 21 January 2011Infographic on where global warming is going
The only problem I have with your graphs is you're cherry picking 1975. How about going back to 1936 and not adjusting it at all and we might see a very different slope.
Prev 1953 1954 1955 1956 1957 1958 1959 1960 1961 1962 1963 1964 1965 1966 1967 1968 Next


