


 Arguments


Recent Comments
Prev 2171 2172 2173 2174 2175 2176 2177 2178 2179 2180 2181 2182 2183 2184 2185 2186 Next
Comments 108901 to 108950:
-
cruzn246 at 06:09 AM on 26 September 2010The Big Picture (2010 version)
"I'd explain why this is nonsense, but it obviously wouldn't make any difference. Enjoy your fantasy world where long term increased atmospheric water vapor is both the cause AND effect of temperature increases." Well debunkerson, tell me what the total world concentration of water vapor is today. Oh, you don't know? No, nobody can answer that question, but you all think we know exactly how this whole atmosphere works. How the heck can we know when we can't put a reliable figure on such a crucial component? You can't.Moderator Response: Further discussion of water vapor needs to be on the thread Water vapor is the most powerful greenhouse gas. -
CBDunkerson at 05:50 AM on 26 September 2010The Big Picture (2010 version)
cruzn246, so your statement that CO2 rises never proceed temperature rises was... false, but we should ignore that and concentrate ONLY on a relatively recent period of glacial cycles during which there have been no sudden profound increases in CO2... except for the current human driven one. Which we should also ignore. Yes, once we blinder ourselves to all evidence to the contrary your position only looks slightly ridiculous. Unfortunately you then go and ruin it with; "There was also a huge spike in water vapor being outgassed in those eras. That is why they called those hot periods back then warm and humid. It's not like CO2 was the only thing going way up." I'd explain why this is nonsense, but it obviously wouldn't make any difference. Enjoy your fantasy world where long term increased atmospheric water vapor is both the cause AND effect of temperature increases. -
cruzn246 at 05:49 AM on 26 September 2010The Big Picture (2010 version)
We just had a record summer for highest average low temperatures in my area. Guess why. Yep, we had the highest average dewpoints for the summer also. You know, that greenhouse gas no one mentions. -
cruzn246 at 05:38 AM on 26 September 2010The Big Picture (2010 version)
"There ARE cases where temperature peaked after CO2 did. For instance... now, various flood basalt incidents, the snowball Earth scenario ~650 million years ago, et cetera." There was also a huge spike in water vapor being outgassed in those eras. That is why they called those hot periods back then warm and humid. It's not like CO2 was the only thing going way up.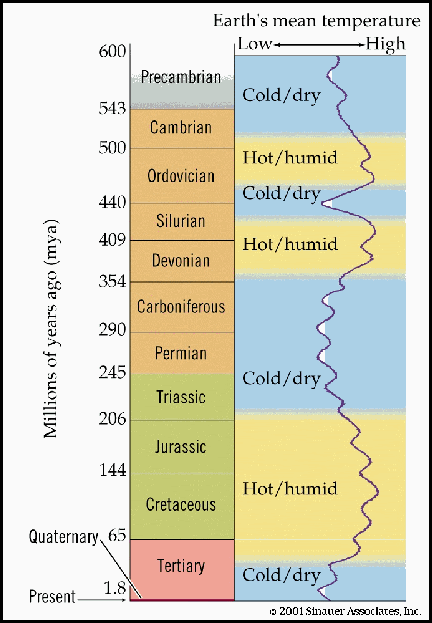
-
cruzn246 at 05:29 AM on 26 September 2010The Big Picture (2010 version)
"-2C in a century is free-fall and the current global +0.13C per decade (that's 1.3C per century) -- and more for the NH isn't a warmup you can believe in? " That's 1.3 per Century if it lasts a century. Don't confuse rate with actual amount. It's gone up about 1C in the last 100 years. That kind of change has happened before. Of course I believe it's warming. I am alive. I was also alive in the 70s. Thank God it's mot like that anymore, although I think our break from that kind of weather is about to end. -
cruzn246 at 05:11 AM on 26 September 2010The Big Picture (2010 version)
"There ARE cases where temperature peaked after CO2 did. For instance... now, various flood basalt incidents, the snowball Earth scenario ~650 million years ago, et cetera." These temps are not in any kind of peak now. They are just warm for the last 500 years. If they keep rising nonstop the next couple hundred years maybe. The flood basalt incidents were in a completely different type of earth climate. Snowball earth, another different climate. Things were so different 500,000,000 years ago, including continental placement, that comparing to those times is like comparing to another world. Our whole atmosphere was different. Let's try to keep this in the interglacial periods please. -
muoncounter at 04:55 AM on 26 September 2010The Big Picture (2010 version)
#72: "They will almost be in a free-fall. I would bet changes on the order of 2C in a century over the N hemisphere would happen easily." -2C in a century is free-fall and the current global +0.13C per decade (that's 1.3C per century) -- and more for the NH isn't a warmup you can believe in? -
ProfMandia at 04:50 AM on 26 September 2010The Phony War: Lies, Damn Lies and the IPCC
Despite strong political reasons for them not to endorse, the following countries endorsed the IPCC 2007 reports because the science was undeniable: United States of America - Fossil fuel-based economy, strong lobby efforts opposed to regulating fossil fuel emissions Saudi Arabia - World's largest producer/exporter of oil China - Rapidly industrializing using coal-fired power plants India - Rapidly industrializing using coal-fired power plants The IPCC WGI Report (2007) concluded: “Most of the observed increase in globally averaged temperatures since the mid-20th century is very likely due to the observed increase in anthropogenic greenhouse gas concentrations.” 130 countries endorsed the reports, and since 2007, no scientific body of national or international standing has maintained a dissenting opinion. Politics? Hardly. -
muoncounter at 04:49 AM on 26 September 2010CO2 measurements are suspect
Following Tom D.'s use of the thread-shifting rule, this is a reply to johnd's comment on The Big Picture thread: "Interestingly even when the stations are located in heavily industrialised regions the same seasonal variation still occurs" The magnitude of seasonal variation is hardly the same at all locations. Equatorial and southern hemisphere locations have much smaller seasonal swings. High northern latitude locations have much larger seasonal differences. Heavily industrial areas (like those downwind of power plants) have the largest annual amplitudes -- and tend to have higher annual average concentrations as well. The only thing that is more or less consistent is the rate of increase from year to year, which has crept up from 1 to >2 ppm/year over the 50 years of modern records. Oddly enough, in areas with stringent pollution controls, the annual amplitude may decrease, as reported by Schmidt et al. 2003 in a study of 30 years of CO2 records in Germany: The average seasonal cycle (peak to peak) amplitude has decreased slightly from 13.8 ± 0.6 ppm in the first decade (1972–1981) to 12.8 ± 0.7 ppm in the last two decades (1982–2001). Not too much of a decrease. But it is becoming clear that not only do we add CO2 to the atmosphere by burning fossil fuels, we can modify the annual variation in its concentration. Aren't those what we call anthropogenic effect? -
Daniel Bailey at 04:41 AM on 26 September 2010The Big Picture (2010 version)
Re: cruzn246 (72, et-way-too-many-al) Nothing you've said at any point shows you have an understanding of science. At all. Or that you're anything less superficial than what you seem to be. You ignore every scientific rebuttal of your, um, "opinions" (since they're obviously not based on science) and continue blithely on your rambling way. Give us something solid to go on that shows we should ever take you seriously again. Or that you're here to learn something and not just here to waste everyone's time. Because as of now, we've no other conclusions to draw. The Yooper -
CBDunkerson at 04:29 AM on 26 September 2010The Big Picture (2010 version)
cruzn246 #71: "I disagree with the whole premise because I have never been shown that CO2 is responsible for most of our current warmup. It's that simple. You can throw some sort of "science" at me, but when it flies in the face of the past, not just the recent past, I just don't buy it." And when you are presented with evidence that it DOESN'T 'fly in the face of the past', as for instance my comments in post #55, you simply ignore it. Which is how you maintain your beliefs in the face of overwhelming proof to the contrary. Deny the evidence to the contrary and you are free to continue believing what you want to believe... truth be damned. -
cruzn246 at 04:27 AM on 26 September 2010The Big Picture (2010 version)
I do think that when, and if, the climate goes back into glaciation it will be very sudden in the N hemisphere, as far as temperature change is concerned. I think the N hemisphere drives global change. I also think the shutdown of the Gulf stream is the trigger. Will worldwide tamps show the same quick drop. heck no. It'll take time to cool of all that water in the S Hemisphere. But that doesn't mean N Hemisphere tempos will drop slow. They will almost be in a free-fall. I would bet changes on the order of 2C in a century over the N hemisphere would happen easily. I also think that could go on for 500 years or so. -
cruzn246 at 04:20 AM on 26 September 2010The Big Picture (2010 version)
God, hit me for typos (probability) and hit me for not using the terminology you all use (trip rather than tip). I meant to complete the sentence differently when I used probability, and didn't go back to fix it. I think of the big change in climate like a trip wire. I disagree with the whole premise because I have never been shown that CO2 is responsible for most of our current warmup. It's that simple. You can throw some sort of "science" at me, but when it flies in the face of the past, not just the recent past, I just don't buy it. -
beam me up scotty at 04:15 AM on 26 September 2010The Big Picture (2010 version)
May you live in interesting times. Or "It's better to be a dog in a peaceful time than be a man in a chaotic period" (寧為太平犬,不做亂世人; pinyin: níng wéi tàipíng quǎn, bù zuò luànshì rén -
beam me up scotty at 04:07 AM on 26 September 2010The Phony War: Lies, Damn Lies and the IPCC
The critique as spoken by the critic is very reasonable. http://www.pbs.org/wnet/need-to-know/the-climate-desk/audio-after-glaciergate-un-panel-on-climate-change-mulls-reforms/3673/ When the information gets into the hands of the deniers... different story. I doubt there are many sincere skeptics anymore. There are of course many members of the denier cult. I don't think they can be reached. -
johnd at 03:58 AM on 26 September 2010The Big Picture (2010 version)
It's interesting, or perhaps amusing, that this thread wants to take a step back because "often we can't see the forest for the trees". Nothing wrong with that in itself, however given that one theme that consistently plays here is that sceptics don't have just one argument to rebutt AGW but numerous ones, or numerous trees. The response then almost inevitably is that whilst there may be some correlation from the evidence presented, the individual trees, unless there is 100% correlation, then the argument presented fails. What is apparent from that general treatment of the various arguments presented is a lack of understanding that perhaps the climate, the forest, does not respond to just one dominant driver or tree, in the case of the AGW argument, CO2, but instead responds to numerous drivers that vary in timing and magnitude as to what force, positive or negative, they contribute to the overall nett result. The tree and forest analogy is very appropriate I feel given the weight given to tree rings as a means of establishing proxy temperatures. Just as many sceptic arguments do not show 100% correlation, nor do all the trees in the forests used to collect tree ring data show 100% correlation, In fact the majority of the trees don't, and it comes down to selecting just a few that show high correlation in order to compile the data sets required. -
Doug Bostrom at 03:56 AM on 26 September 2010The Big Picture (2010 version)
For my part I'm not a researcher studying matters of climate, but I follow the topic fairly closely and that's why I can't help but notice cruzn246's disagreement with vast swathes of established research findings, a sweeping dismissal that is boldly conspicuous. Take a moment to summarize what cruzn246 disagrees with and then ask, "what's the probability 'cruzn246' knows better?" My guess is that he/she will disagree with anything smacking of an attribution of significant climate change to anthropogenic influences. The big picture, again. -
Daniel Bailey at 03:41 AM on 26 September 2010The Big Picture (2010 version)
Re: cruzn246 For someone who wants to be a Climatologist, you know very little about the field. or about science or the scientific method. You are telling people here on this thread, with lifetimes of experience and working knowledge in the field, the the science they know (which is itself based on the accumulated lifetimes of study and research of hundreds of thousands of scientists) is wrong. Do you not see a problem with that? I would suggest, at the very least, going here and follow the links and try to gain a base understanding of what's actually going on in the field. If you want to learn, first admit you don't know everything. That's a prerequisite. The Yooper -
Doug Bostrom at 03:37 AM on 26 September 2010The Big Picture (2010 version)
"Tripping point?" "till.......the trip happens?" Are you sure you've got your terminology straight, Cruzn246? -
cruzn246 at 03:29 AM on 26 September 2010The Big Picture (2010 version)
Archiesteel "Actually, we're past the climate optimum for this interglacial period, so temperatures should be (slowly) going down instead of rising." So some think. That is for folks who really don't know what the real tripping point is. Fact is, it is probability ocean currents/sea levels, and when that happens a slow fall is not what you will see. It'll be a very sharp drop. There is some chance we may not warm up fast enough to bring the sea levels up to catch the right Milankovitch cycles, but that is still something we are waiting to see. The ocean current drive may be so strong that it will even overcome what is thought to be the "wrong" time in the Milankovitch cycle. It also may be that we could miss the glacial period if we hold seal levels down for a few more thousand years. Of course that's gonna be hard to do. when you are in the warm cycle, as we are, oceans just seem to keep rising till.......the trip happens. -
johnd at 03:25 AM on 26 September 2010The Big Picture (2010 version)
cruzn246 at 02:26 AM, this review of the most recently published study Fresh water may have cooled North Atlantic putting that "the decrease recorded in the Earth's temperature between the 1940s and 1970s was caused by a sudden cooling of the oceans in the northern hemisphere" may be of interest to you. -
johnd at 03:14 AM on 26 September 2010The Big Picture (2010 version)
CBDunkerson at 19:09 PM, the CO2 levels recorded at the surface stations used in this study Mechanisms for synoptic variations of atmospheric CO2 in North America, South America and Europe clearly indicate the huge seasonal variation in CO2 levels which coincides with increased uptake by plants during the growing season. The annual cycle shows variations of generally 20-40ppm but can be in excess of 50ppm depending on location. Interestingly even when the stations are located in heavily industrialised regions the same seasonal variation still occurs but with some of the highest annual variations of all the locations sampled, the station at Heidelberg Germany, described as having a fairly strong industrial influence to the east being the prime example with annual variation in excess of 50ppm.Moderator Response: Wrong thread for continuing this conversation. See the Moderator's Comment on Tom Dayton's comment. -
archiesteel at 03:02 AM on 26 September 2010The Big Picture (2010 version)
@cruzn246: "We know it was warmer than this during the Holocene many times." Actually, it wasn't (as far as global averages are concerned). Also, you should put cited text you reply to in quotes, it makes it easier to understand the points you are trying to make. -
archiesteel at 02:59 AM on 26 September 2010The Big Picture (2010 version)
@cruzn246: "26% today? How about when CO2 was at 180 or so 10,000 years ago." Temperatures were about 8 degrees colder at that time. So, 46% less CO2 (roughly half) means 8 degrees colder. That's more than the 3C climate sensitivity currenly estimated, actually, and evidence of positive/negative feedback when CO2 levels change. -
cruzn246 at 02:52 AM on 26 September 2010The Big Picture (2010 version)
We are breaking an increasing amount of temperature records, we are at the end of the warmest decade in recorded history, and the increase matches what the climate models predict. What more proof do you want? People's clothes catching on fire when they go out for a stroll? Don't be ridiculous, please. Recorded history. Big deal. We know it was warmer than this during the Holocene many times. So we are at the warmest in the last 200 years. That isn't a big enough sample to say warmest ever. Cripes, pull some reality glasses on. These temps are well within norms. So the models got it right. Whooppeee!Moderator Response: See the argument It's Not Bad. -
cruzn246 at 02:48 AM on 26 September 2010The Big Picture (2010 version)
As to how warm it would be without CO2. CO2 accounts for about 26% of the 33 C greenhouse warming. That yields about 8.6 26% today? How about when CO2 was at 180 or so 10,000 years ago.Moderator Response: See Does high levels of CO2 in the past contradict the warming effect of CO2?. Discuss the topic on that thread. -
archiesteel at 02:46 AM on 26 September 2010The Big Picture (2010 version)
@cruzn246: "30C colder? Are you nuts? No frickin way. Wherever you got that from is crazy." Such brilliant rhetoric has convinced me. *rolleyes* I'm sorry, cruzn246, I though you were a serious commenter, but now I see you're just a common troll. Mods, can we remove cruzn246's post and this reply? They add nothing to the discussion. -
michael sweet at 02:43 AM on 26 September 2010Climate Change: The 40 Year Delay Between Cause and Effect
Nerndt at 14 and others, The oceans temperature is controlled by its interaction with the atmosphere. AGW causes the atmosphere to warm. When the atmosphere warms, it warms the ocean under it. Because the ocean is so much larger than the atmosphere, it takes a long time for the ocean to warm to equilibrium. The time lag described in this article is largely due to the long time it takes for the ocean to be warmed by the hot atmosphere. The ocean cools the atmosphere as it warms up. When the ocean finally reaches equilibrium, the atmosphere is hotter than it was at the start because the ocean no longer cools it. Since we live in the atmosphere, we are most concerned with the temperature rise in the atmosphere. The rise in atmospheric temperatures is slowed by the thermal mass of the ocean. Thus the atmosphere warms immediately when the forcing on it increases. As the ocean (slowly) warms, the atmosphere warms even more, even if the forcing no longer rises. Unfortunately, the IPCC estimates of climate sensitivity of 2-4.5C per doubling are for short term warming, not equilibrium warming. The equilibrium warming, in say 1000 years, is higher than the short term warming. -
archiesteel at 02:42 AM on 26 September 2010The Big Picture (2010 version)
@cruzn246: "The whole thing about CO2 just leaves me baffled." Clearly, but just because you're ignorant of the science doesn't mean you should assume it's wrong. "Of course it is explained that CO2 lags for whatever reason when a warmup occurs." CO2 Lags Temperature "Face it people, the big greenhouse gas here is water vapor." We are not adding new water vapor to the atmosphere, but we are adding CO2 that has been sequestered for millions of years. The current warming is due to rising CO2, which is likely to increase the amount of WV in the atmosphere, thus increasing the warming. "but till we really see some temperatures out of the norm, which we are not close to seeing" We are breaking an increasing amount of temperature records, we are at the end of the warmest decade in recorded history, and the increase matches what the climate models predict. What more proof do you want? People's clothes catching on fire when they go out for a stroll? Don't be ridiculous, please. "We are still in what has been a relatively warm period called the Holocene, and the simple fact is that we will probably see higher temps then this before this whole climate system flips." Actually, we're past the climate optimum for this interglacial period, so temperatures should be (slowly) going down instead of rising. "And CO2 has little or nothing to do with it. it is a minor player in the whole climate system. Greenouse gases allow us to trap heat, but they are not the big players in climate change. [...] The whole system is so complex we barley know how it works but the balance of solar factors, albedo, and ocean temperatures and currents are all bigger players." Science disagrees with you. "Anyone who knows anything about our glacial climatology should know that we are bound to stay warm until we see a radical change in ocean currents." Why do you believe you know more than the experts in the field? Please educate yourself. -
Daniel Bailey at 02:38 AM on 26 September 2010The Big Picture (2010 version)
Re: cruzn246 (46), doug_bostrom (47) OK, I'll take my turn at the plow, Doug."Can someone tell me how warm it would be if no CO2 was in the atmosphere?"
To even ask this questions is telling as to your state of awareness of the science. But let's pretend you have honestly asked that question. Here's a quick, quasi-sciency answer:If an ideal thermally conductive blackbody was the same distance from the Sun as the Earth, it would have an expected blackbody temperature of 5.3 °C. However, since the Earth reflects about 30%[4] (or 28%[5]) of the incoming sunlight, the planet's actual blackbody temperature is about -18 or -19 °C [6][7], about 33°C below the actual surface temperature of about 14 °C or 15 °C.[8] The mechanism that produces this difference between the actual temperature and the blackbody temperature is due to the atmosphere and is known as the greenhouse effect.
So, essentially a global average temp of -2 degrees F, or about -18 degrees C. Thus, no liquid water anywhere and no life. All very well understood for over a hundred years. Water vapor acts to enhance the warming of greenhouse gases, which can then elevate CO2 levels even more, which can then enhance temps even more. This usually dampens itself out over time; temps & CO2 levels eventually reach an equilibrium. These all are quantifiable due to the physics of radiative gases (no computer or fancy GCM's required). It does get a little complicated sometimes, depending upon the rates at which CO2 changes. But, hey, no one said it would be easy to learn. BTW, CO2 is the most important of the greenhouse gases, even including water vapor. You really ought to watch this for a clear explanation. The Yooper -
CBDunkerson at 02:38 AM on 26 September 2010The Big Picture (2010 version)
cruzn246 #50: "So why the heck can you never go anywhere in the temperature history and find one stinking time that temperature peaked after CO2 peaked?" More denialist fiction. There ARE cases where temperature peaked after CO2 did. For instance... now, various flood basalt incidents, the snowball Earth scenario ~650 million years ago, et cetera. -
muoncounter at 02:35 AM on 26 September 2010The Big Picture (2010 version)
#46: "how do you all explain the big drops in the CO2 chart from Beck?" Easy. From a presentation (not published?) by Massen and Beck 2006: The historic measurements have horrible standard deviations. See Fig 10: 398+/-62 ppm, Fig 11: 327+/-23ppm, Fig 12: 339+/-33. -
Tom Dayton at 02:33 AM on 26 September 2010The Big Picture (2010 version)
I have replied to cruzn246 over on the more appropriate thread for further discussion: CO2 measurements are suspect.Moderator Response: Good point.
For continued wrangling over C02 measurement accuracy, go here: CO2 measurements are suspect
To further discuss sensitivity: A detailed look at climate sensitivity
If you're not familiar with the comments policy here and would like to know why comments swerving deeply into specialist topics will likely vanish after more appropriate threads are pointed out, see Comments Policy -
Tom Dayton at 02:30 AM on 26 September 2010CO2 measurements are suspect
This is a response to cruzn246's posting of Beck's CO2 graph on a different thread. CBDunkerson gave an excellent reply on that thread, and a followup. RealClimate has more details in Beck to the Future. Additional perspective is supplied by Eli Rabbett in his posts Amateur Night and then GOGI. -
CBDunkerson at 02:29 AM on 26 September 2010The Big Picture (2010 version)
cruzn246 #46, the 'big drops' in Beck's chart are actually returns to more accurate results. The anomalous peaks exist only because he used fragmentary records rather than a consistent series. This wasn't a matter of taking regular readings at fixed sites. Callendar gathered any and all old historical measurements he could find and Beck re-used those same records. The difference is that when Callendar found anomalously high readings in individual years / particular areas he discarded them as corrupted data while Beck decided these were indicative of a global trend which somehow magically didn't appear in the other readings. Seriously, your continued insistence on treating Beck as anything but a bad joke is a classic example of why there is so much disdain for 'skeptics'... there is NOTHING skeptical about it. Ice core records, sediment proxies, modern CO2 monitoring stations all over the world, satellite readings, and basic logic ALL say that Beck's analysis is complete nonsense. Yet still you prefer the insane ramblings (and CO2 fluctuating +/- 100 ppm over the course of a mere decade IS insane) of a high school teacher to absolute and irrefutable scientific findings by hundreds of specialists in a half dozen different fields over the course of decades. As to how warm it would be without CO2. CO2 accounts for about 26% of the 33 C greenhouse warming. That yields about 8.6 C. However, if it were 8.6 C cooler there would also be less water vapor in the air... which would make it cooler still... which would mean more ice cover and thus a higher albedo... which would make it even colder. In short, we can't determine the precise value. However, it is safe to say that most of the planet would be a frozen ball of ice. Maybe a narrow 'temperate' zone around the equator. -
cruzn246 at 02:28 AM on 26 September 2010The Big Picture (2010 version)
30C colder? Are you nuts? No frickin way. Wherever you got that from is crazy. -
cruzn246 at 02:26 AM on 26 September 2010The Big Picture (2010 version)
The whole thing about CO2 just leaves me baffled. Of course it is explained that CO2 lags for whatever reason when a warmup occurs. OK, so after that it becomes a driver. So why the heck can you never go anywhere in the temperature history and find one stinking time that temperature peaked after CO2 peaked? I mean if it's driving then.........Face it people, the big greenhouse gas here is water vapor. I am not saying it is a zero factor, but till we really see some temperatures out of the norm, which we are not close to seeing, I can't buy this notion about CO2 causing some big change here. We are well within norms. We are still in what has been a relatively warm period called the Holocene, and the simple fact is that we will probably see higher temps then this before this whole climate system flips. It happened before and it will happen again. And CO2 has little or nothing to do with it. it is a minor player in the whole climate system. Greenouse gases allow us to trap heat, but they are not the big players in climate change. The whole system is so complex we barley know how it works but the balance of solar factors, albedo, and ocean temperatures and currents are all bigger players. Anyone who knows anything about our glacial climatology should know that we are bound to stay warm until we see a radical change in ocean currents. That is probably the big tripper in the system. When that gulf stream doesn't flow to Europe anymore, usually about the time FL is mostly water covered, things flip. -
archiesteel at 02:24 AM on 26 September 2010The Big Picture (2010 version)
...sorry, I meant "30C colder". -
archiesteel at 02:21 AM on 26 September 2010The Big Picture (2010 version)
@cruzn246, first, please answer this simple question: are you here to learn, or simply repeat denier arguments you've read elsewhere? Because if it's the latter, then kindly abstain from it. Instead, look up those arguments in the list compiled on this site to get an accurate rebuttal. Thanks. "So how do you all explain the big drops in the CO2 chart from Beck?" Beck's chart is inaccurate, so who knows what the drops and bump means. For example, if Beck's primary sources were in Germany, then it would make sense for the big bump during WWII, as the country's industry went into overdrive. In any case, the graph (and the paper it came from) was thoroughly debunked. "BTW, Ice cores are not that accurate. The most recent do not show the so called increase we are seeing." Perhaps not (I'd have to check), but the older one disprove Beck's graph. "Can someone tell me how warm it would be if no CO2 was in the atmosphere?" Off-hand, I remember it being something akin to 30C, but I could be wrong. What's that got to do with it? -
Doug Bostrom at 02:18 AM on 26 September 2010The Big Picture (2010 version)
"...if no CO2 was in the atmosphere?" Is anybody going to rise to that bait? Take the refusal to acknowledge CBDunkerson's remarks concerning Beck as a hint as to whether the little sardine is worth biting. -
cruzn246 at 02:07 AM on 26 September 2010The Big Picture (2010 version)
So how do you all explain the big drops in the CO2 chart from Beck? Did folks quit burning coal in those years? did winds mysteriously change directions for years? BTW, Ice cores are not that accurate. The most recent do not show the so called increase we are seeing. Can someone tell me how warm it would be if no CO2 was in the atmosphere? -
Doug Bostrom at 01:29 AM on 26 September 2010The contradictory nature of global warming skepticism
Baz, when a site such as WUWT includes work such as Steven Goddard's pieces along with other content, how are readers to feel confident they're learning anything trustworthy if they do not already know enough of a given topic to distinguish between fact and fiction? What is the point of reading articles there? For instance, let's say that I'm intrigued by a story on Arizona's big meteor crater presented at WUWT but I don't already know much about Arizona's big meteor crater, not enough to distinguish truth from fiction. Let's suppose I do know enough about climate to know that Steven Goddard's depictions of climate science are generally unreliable, in many instances are downright incorrect, that this has been shown to be the case many times, yet WUWT continued to publish Goddard's work, refused to help readers by making corrections. Knowing how WUWT lends a patina of authority to unreliable work, why would I want to read about meteor craters on WUWT? How would I know I'm not being told something wrong? Why would I want to waste my time doing fact checking on my own, or trying to tease out the truth by following a thread of dozens or hundreds of comments? Once a track record of including Steven Goddard-level material has been established, once we -know- there's fiction styling itself as fact infecting the content of a site, for any topic with which we have little familiarity how do we know whether or not we're not only wasting our time but having our minds filled with errors? There's no way of telling short of reading about the topic somewhere else, meaning the site is essentially useless as a fundamental learning tool. How can such a site be termed "very good?" It's not a matter of any single or occasional mistake condemning the reputation of a publication; the very best publications sometimes must issue retractions or correctons. In the case of WUWT we see an extended history of publishing what is clearly incorrect and-- worse-- a general refusal to acknowledge error once it's been identified. In the matter of climate, WUWT has refused to help its readers understand the topic, to the contrary appears to have frequently actively promoted misinformation. That's not "very good," that's very bad. -
Daniel Bailey at 01:14 AM on 26 September 2010Climate scientists respond to Monckton's misinformation
Re: CoalGeologist (40,41) Thanks for posting the links. I pulled this statement out of the Opening Statement by Representative Edward J. Markey, Chairman of the Select Committee on Energy Independence and Global Warming:"Meanwhile, concentrations of heat-trapping pollution continue to rise in our atmosphere, committing us to further warming in the decades ahead."
Strong statement from a politician. Thanks again! The Yooper -
archiesteel at 00:57 AM on 26 September 2010A detailed look at Hansen's 1988 projections
@angusmac: "The point that I am trying to make and that you, and some others, are ignoring is that the real world is not following Scenario B. This is a case of right emissions in - wrong (too high) temperatures out." We understand your point, it is simply wrong. We perfectly understand that Scenario B is a case of right emmissions in - wrong temps out. What the article tries to explain is how wrong (and how right) Hansen 1988 was. The only way to find out the divergence between his predictions and reality is to pick the scenario that uses parameters that are closer to reality. That scenario is scenario B. The fact that scenario C looks closer to reality is that it contains *two* erroneous components that cancel each other out and make it appear similar to real-world outcomes (for a while, at least). It is a curiosity, a coincidence, nothing more. "What is required is a model that gives real world emissions in - real world temperatures out. I have not seen one yet, probably because this would mean revising radiative forcings and/or temperature sensitivity downwards from currently accepted norms." Did you even read the article? The reason Scenario 2 (near real-world emmissions in) gave inaccurate results was because of a wrong climate sensitivity value (4.2C instead of 3.4C). -
CoalGeologist at 00:53 AM on 26 September 2010Climate scientists respond to Monckton's misinformation
UPDATE: Unless I missed it the first time, the hearing proceedings have just been posted: http://globalwarming.house.gov/pubs?id=0023#main_content -
archiesteel at 00:47 AM on 26 September 2010The contradictory nature of global warming skepticism
@Baz: "As you see if you look there now (as I just have) WUWT run non-climate pieces very often like the present Google-Earth meteor crater, and solar storms." Must be a slow news day in the denialosphere. "I certainly wasn't rude (I never am)" Saying we were close-minded for not being WUWT fans is quite rude. So is suggesting that people with no statistical background might better analyze the temperature record than eminent statisticians. "On the subject of Open mInd, no the 'typo' wasn't fixed while I was there, but I never went back to find out. I couldn't even hope to find it now." How convenient. "Archie, you've achieved what you wanted. I'm leaving this forum as I cannot devote my precious time to construct meaningless posts like this that serve no purpose in AGW debate." None of your posts in this thread have helped move the AGW debate forward, because (as you admitted yourself) they were not logical arguments. We all tried very patiently to explain to you why you were wrong in your original assertion, but you refused to hear it. Anyway, you're mistaken (again): my goal was not to make you leave, but simply to admit you were wrong. It seems you are incapable of this, and that's sad. "As an ad hominem is just not me, I'm going to leave it there for you to think over." This is what I don't understand: either you want scientific discussion, or debate opinions. You made it clear this was about opinion for you - even if it isn't the goal of this site - but then acted in one of the most hypersensitive ways I've ever seen someone react in an opinion debate. All in all, it becomes clear you probably weren't here to learn, or listen, and you began to pump out the faux outrage when confronted to this simple fact. -
CoalGeologist at 00:35 AM on 26 September 2010Climate scientists respond to Monckton's misinformation
I've learned from an informed source that at hearings on "Extreme Weather in a Warming World" held two days ago (Thurs., 23-Sep), convened by the U.S. House Select Committee on Energy Independence and Global Warming that one Committee member requested that the scientists' rebuttal of Monckton be entered into the official record. The importance and value of this document is that it directly addresses Monckton's arguments, without requiring people who are less well grounded in the scientific evidence to juxtapose this evidence on their own. Bravo, again, to the climate scientists who worked on this. By the way... This led me to an interesting and potentially valuable information resource related to climate change I hadn't seen previously, providing a compilation of testimony presented before the Committee, plus lots of other multi-media resources. Nothing posted yet from Thursdays hearings. -
Daniel Bailey at 23:14 PM on 25 September 2010The contradictory nature of global warming skepticism
Re: Baz (350) Baz, despite our early differences, I've grown to enjoy the exchanges between us. I think early on we got off on a wrong foot because there were clear differences between how we internalized knowledge, but I also think that to some degree we've managed to work around that. You display a clear interest in learning, which is why sites like this exist. Which is also why I'm here. I'm still trying to increase my knowledge and further my understanding of the science as well. Which is also why I do not frequent sites like WUWT, which you aptly describe as not scientific. The problem we here have with WUWT is this: they knowingly masquerade AS a scientific site. Too many unknowing people, looking for understanding and knowledge, go there and either fall behind where they should be, or are lost forever to science. And that is a travesty. As would be your leaving Skeptical Science forever. I am not one to ever readily give up on someone, Baz. I think you really want to know and understand. When you're ready, I hope you come back here to learn and to help others learn. And I will still be here to welcome you back. BTW, I hope temps do not rise and OHC is flat as well. The science, however, says differently. Our descendants will inherit a very different world from that of our parents. The Yooper -
muoncounter at 23:10 PM on 25 September 2010The Big Picture (2010 version)
44: "Since we see locally elevated amounts AND a positive trend it is clear that carbon sinks are not able to handle all of the additional CO2. " Agreed. But if elevated amounts of atmospheric CO2 are in close context with power plants, urban areas, etc, on the local level, it would be completely illogical to insist that the global total fossil fuel emissions does not result in increased global atmospheric CO2. -
Phil at 23:05 PM on 25 September 2010The Phony War: Lies, Damn Lies and the IPCC
The actual acronym is IPoCC not - as miekol @1 implies - IPfCC. Roger @4 is right- it should have been defined. If it had been then RSVP @8 wouldn't have needed to do the research he clearly didn't do. So although the advice "The Yooper" @9 presents is good, actually simply reading the correct title (rather than miekol's misrepresentation) would have been sufficient. The Intergovernmental Panel on Climate Change
Prev 2171 2172 2173 2174 2175 2176 2177 2178 2179 2180 2181 2182 2183 2184 2185 2186 Next


