


 Arguments


Recent Comments
Prev 2178 2179 2180 2181 2182 2183 2184 2185 2186 2187 2188 2189 2190 2191 2192 2193 Next
Comments 109251 to 109300:
-
adelady at 20:36 PM on 5 October 2010Carbon Dioxide - Everyone's Favorite Pollutant
Breathing does increase CO2 in direct proportion to the population. And every mammal sequesters some carbon in the carbon-based life form tissues. It's a circular argument. Either we eat carbon containing life forms and release CO2 rather than allowing them just to die, decay and release CO2. Or parts of some plants sequester more CO2 in their structures because we don't harvest them as an alternative to us eating some plant parts and sequestering carbon in our bodies. -
alan_marshall at 20:28 PM on 5 October 2010What constitutes 'safe' global warming?
Thanks John for the timely warning. A temperature rise of 2 degrees is definitely not safe, at least not in the long term. Sea-level rise is the elephant in the room. The IPCC projections of less than one metre are based mostly on thermal expansion of the ocean, as the rate of breakup of the ice sheets is very difficult to model. Hansen has stated that “Proxy measures of CO2 amount and climate simulations consistent with empirical data on climate sensitivity both indicate that atmospheric CO2 amount when an ice sheet first formed on Antarctica (34–35 million years before present) was probably only 400–600 ppm" (Hansen and Sato, 2007b). Elsewhere he writes “equilibrium sea level rise for today’s 385 ppm CO2 (2008) is at least several meters, judging from paleoclimate history" If that is so then the CO2 concentration we are tracking to reach in this century is sufficient to eventually melt most of the ice in Greenland and West Antarctica. (East Antarctica may be somewhat safer as the ice sheet has increased the altitude.) The only consolation in this grim scenario is that the thermal inertia of the ice sheets is apparently longer than the thermal inertia of the upper layers of the ocean. In my post on this site titled "Climate Change: The 40 Year Delay Between Cause and Effect", I estimated 40 years as the time for global warming, responding to a step increase in forcing, to reach 1 – 1/e = 63.2% of its final equilibrium value. The sea level rise for the last interglacial, which John quotes as 6.6 to 9.4 metres higher than current sea level, is the equilibrium sea level rise. I expect a 2 degree warming will produce a rise of 2 or more metres by the end of this century, with the remainder being reached some centuries later. What we do know from paleoclimate history is that if nothing is done to reduce greenhouse gas emissions, most of the world's great cities will eventually be inundated. That is why the task facing mankind is not just to quickly move to a zero carbon economy. We will also need to extract the bulk of the CO2 emitted from 1750 up till now. That will require either carbon sequestration on an industrial scale, or geo-engineering. Both these solutions will involve decisions we make as a species, not as competing peoples. If sufficient CO2 can be removed this century, we can limit the sea level rise even if global warming temporarily reaches 2+ degrees. I live on the island of Tasmania. The first inhabitants of the island arrived during the last ice age. They did not arrive by boat. They were able to walk across 300 km of sea floor because the sea level was 120 metres lower than it is today. I wish our politicians could comprehend that as they push temperatures and sea level in the other direction! -
CBDunkerson at 20:02 PM on 5 October 2010An underwater hockey stick
Joe Blog #75: You say that you have the data showing that the surface temp anomaly is less than the ~400 m ocean temp anomaly for the Gulf of St. Lawrence... please show it. Given that most of the area around the North Pole has warmed more than 3 C I doubt your claim is correct. On your theory that ocean temperature anomalies in the area are more due to currents than warming directly at that location I might normally agree with you (and point out that global warming is... global, and thus would also have warmed the waters carried in by the current), but... this is the Gulf of St. Lawrence. It is blocked by several land masses which logically should prevent any major ocean currents from running through the area. That said... if an ocean current IS running through the Gulf it would have to be an offshoot of the Labrador current which comes down from the Arctic and hugs the coast all along the possible entrances to the Gulf of St. Lawrence. The Arctic is, as noted above, the region which has experienced the greatest temperature anomalies due to the enhanced greenhouse effect. So even if you are right about the water temperature anomaly being due to currents... it's right back to AGW again. -
RSVP at 19:58 PM on 5 October 2010Carbon Dioxide - Everyone's Favorite Pollutant
As the level of CO2 is planetary, this issue at any rate can only be dealt with seriously via international accords. -
CBDunkerson at 19:43 PM on 5 October 2010Billions of Blow Dryers: Some Missing Heat Returns to Haunt Us
There is a document explaining the changes shown in Charlie A's #75 at the NODC URL he provides. The top level summary from that document is; "1. Changes due to data additions and data quality control, both at NODC and by originators. Substantial quality control has been carried out by the Argo community on the profiling floats, mainly to correct pressure offsets. A substantial amount of data for recent years has been added to the analysis. 2. Changes due to switch of our base climatology. The website and 2009 paper used an interim (L09) climatology (between WOA05 and WOA09) incorporating XBT corrections and a mean of five decadal climatologies to remove temporal bias. These changes were formally completed with additional data and quality control in WOA09. 3. Changes due to revised XBT bias calculations. With additional XBT and CTD data, the bias calculations were improved. This is an ongoing process, but as we receive less new data from earlier time periods, this recalculation will mostly affect more recent years." These show how many calculations and assumptions go into the OHC estimates and thus further highlight why it is so ridiculous to point to a five year 'trend' in these values as evidence of anything. We can tell that the long term trend is increasing, but making claims based on fine detail is just irresponsible. Note that the new updates don't include any attempt to factor in the deep ocean warming identified by Purkey & Johnson in the paper discussed above. So the NEW results are still not 'perfect'... as also evidenced by the comments about the need for further corrections in the explanation of the changes. -
RSVP at 19:43 PM on 5 October 2010Carbon Dioxide - Everyone's Favorite Pollutant
CBDunkerson #69: You really can't do this math? Seriously? Petrolium has placed the carbon equilibrium as sequestered in all living things (including man) beyond its "natural" origin. Breathing does increase CO2 levels in direct proportion to the increase in population. -
CBDunkerson at 19:33 PM on 5 October 2010Carbon Dioxide - Everyone's Favorite Pollutant
RSVP #68: You really can't do this math? Seriously? Prior article: Breathing does not increase atmospheric CO2 levels because all carbon exhaled into the atmosphere came FROM the atmosphere in the first place. Basically, the human body recycles CO2. Current article: Something becomes a pollutant when the level of it in the environment increases to the point where it becomes harmful. Ergo... breathing is not causing CO2 to become a pollutant and there is no reason to regulate it... despite obnoxious fear mongering, on the level of 'death panels', nonsense to the contrary. -
JMurphy at 19:23 PM on 5 October 2010We're heading into an ice age
Tom Loeber, there was no "widespread cold in the northern hemisphere over the last couple of years", just as there has been no "widespread record cold" over the southern hemisphere more recently. You would save yourself a lot of bother if you look into the facts and figures of these situations, rather than rely on exaggerated and over-the-top headlines, especially those from the likes of ICECAP.COM. -
johnd at 19:02 PM on 5 October 2010Uncertain Times at the Royal Society?
scaddenp at 10:40 AM, I'm not sure what you are getting at, or where you are coming from for that matter. Please explain. -
Baz at 18:21 PM on 5 October 2010Uncertain Times at the Royal Society?
gallopingcamel. Ah, I'm glad you said that! There are indeed sharp upturns in temp throughout the record, and all were natural. You're right, we're told that this time, this time, it is man-made (and we have a suitable cause). What intruiges me when I look at the graph of modern temps is indeed THAT sharp uptick. Would you agree that it would fit better if the temp slowly rose up, rather than it being quite sharp? -
adelady at 17:26 PM on 5 October 2010It's not bad
This PNAS abstract shows decreasing rice yields under higher night time temperatures if you're looking for non greenhouse based work on (dis)advantages of higher CO2 on crop growth. -
RSVP at 17:21 PM on 5 October 2010Carbon Dioxide - Everyone's Favorite Pollutant
CoalGeologist #65 "The U.S. Supreme Court, which CORRECTLY (beyond question) identified CO2 as a pollutant,..." Just a few articles back, "Does breathing contribute to CO2 in the atmosphere?", it was being said that it was OK to breathe, (and I might add, if this is, it should be OK to burn wood as well). Meanwhile, the US Constitution guarantees the right to life, (i.e., "nor shall any State deprive any person of life...")... yet you go on to say that the Supreme Court... "merely gave the EPA the authority to regulate its discharge " Considering the possibilities, (and the level of misinformation going around), "merely" sounds like a gross understatement. And perhaps the real problem stems from a need to use a different word. Pollution is the wrong word. "Surplus" might be better. -
dana1981 at 16:27 PM on 5 October 2010Carbon Dioxide - Everyone's Favorite Pollutant
For those arguing that the benefits of increased CO2 will outweigh the negatives, or that the negatives aren't significant, or what have you, I recommend actually reading the 'How Much Warming is Dangerous?' section of the article and the links it references. -
Marcus at 16:16 PM on 5 October 2010Carbon Dioxide - Everyone's Favorite Pollutant
Here are a couple of very good examples of how something that is good in very small quantities is actually *harmful* in larger quantities. Digitalis is a toxin which, in very small quantities, can prevent heart-attacks yet, in higher concentrations, can lead to a very swift death. Similarly Botulinus Toxin (aka Botox) can be used to reduce the visible signs of aging but-in large enough quantities-can lead to extreme illness & even death. I see CO2 & the like in a very similar light. Its worth noting though that, even if CO2 were considered utterly benign-at all quantities-the other by-products of burning fossil fuels are sufficiently toxic to warrant that we use far less of them. Burning petrol generates particulate emissions & benzene-both extremely hazardous to health, & burning coal generates particulate emissions, cadmium & mercury (amongst a host of other toxic by-products). Not exactly good for our health! -
Doug Bostrom at 15:24 PM on 5 October 2010NASA-GISS: July 2010-- What global warming looks like
Another statistical way of looking things: From CapitalClimate
-
CoalGeologist at 15:07 PM on 5 October 2010Carbon Dioxide - Everyone's Favorite Pollutant
Thingadonta @#50: There are several interrelated sets of issues regarding climate change that tend to become muddled in the skeptical debate, in particular: 1) Is the climate changing, and at what rate?, 2) What is causing this change?, 3) How might climate continue to change in the future, particularly if nothing is done to limit human impact? 4) What is the likely impact of [anthropogenic] climate change on human civilization as well as on natural ecosystems?, and finally 5) What can or should we do, if anything, to reduce the impact of anthropogenic climate change? The first four questions fall ostensibly within the realm of science, while the last (#5) falls within the realm of values, priorities, and politics--perhaps even religion. Unfortunately, I believe that a lot of "skeptics" allow their opinions regarding #5 to influence their judgment regarding #'s 1 through 4... and that pertains both to those who would wish to reduce human impact to as close to zero as possible, and those who, like Rhett Butler in regards to Scarlett O'Hara, frankly don't .....er... care. The U.S. Supreme Court, which CORRECTLY (beyond question) identified CO2 as a pollutant, merely gave the EPA the authority to regulate its discharge into the atmosphere. The Court did not indicate what should be done to limit CO2 emissions... but only that it falls under the EPA's authority. Trade-offs need to be weighed in any such circumstances. We face a lot of serious questions regarding our priorities for the future. Although I'm by no means sure what can or should be done regarding CO2, there is one thing I do feel sure of... that 7+ billion of us can't all simultaneously do whatever the hell we want, and not affect everyone else. We need to consider the consequences of our actions--or inaction, as the case may be--as opposed to denying that such consequences are real. In the meantime, libertarians should give serious consideration to finding another planet to live on. -
scaddenp at 14:38 PM on 5 October 2010Uncertain Times at the Royal Society?
"The big difference is that this time the upturn could be caused by humanity's fondness for burning growing quantities of fossil fuel." - that and the lack of the forcings that dictated such change in the past. If comparing past 750,000 make sure you put instrumental record on same scale so you get a real understanding of "sharp". Though fortunately current change does not appear to be as rapid as NH suffered in Younger Dryas and Heinrich events that occur when coming out a glaciation. -
scaddenp at 14:33 PM on 5 October 2010Carbon Dioxide - Everyone's Favorite Pollutant
GC - well I am not going to comment on an US political matter. As to ice ages, perhaps comment on CO2 lags temperature (after reviewing argument)? -
Doug Bostrom at 14:30 PM on 5 October 2010Carbon Dioxide - Everyone's Favorite Pollutant
GC, you're typically a pretty articulate fellow. I've got to say, there's a wide gulf of understanding here based on your remark that the EPA is behaving ludicrously by taking up C02 as a pollutant; a single adjective doesn't begin to explain your perspective. The trouble is, "ludicrous" is what's on offer, versus this: Endangerment and Cause or Contribute Findings for Greenhouse Gases under the Clean Air Act (PDF) (52 pp, 308K) Technical Support Document for the Findings (PDF) (210 pp, 2.5MB) Beyond its immediate findings, EPA bent over backwards to entertain a vast number of comments and criticisms. I'm willing to bet the word "ludicrous" may be found in the compilation of this interaction but more to the point, lots of people devoted more effort than launching a single adjective to attacking the regulation of C02 by EPA, only to be found less than compelling. There are 11 volumes of comments and responses in all, but the key discussions from the perspective of vistors to this site are probably mostly to be found here: Volume 1: General Approach to the Science and Other Technical Issues Volume 2: Validity of Observed and Measured Data Volume 3: Attribution of Observed Climate Change Volume 4: Validity of Future Projections Volume 9: Endangerment Finding The thing is, after all of the disparagement about vague and nonspecific bureaucrats is brushed away as silly irrelevancy, we're left with the fact that EPA actually has a track record of successfully dealing with a range of pollution issues at various scales from relatively miniscule to quite huge. EPA's got a huge reservoir of expertise to tap into, they've been mobilized to look at this C02 challenge and you can see the results above. Against that, a single adjective? -
Phila at 14:29 PM on 5 October 2010Carbon Dioxide - Everyone's Favorite Pollutant
It is very disappointing to find the (mostly) sane denizens of this blog going along with what amounts to a denial of 9th grade science. "9th grade science" from which decade? Science does evolve, you know. If you want us to understand why classifying CO2 as a pollutant is "ludicrous," you need to present an actual argument, and back it up with evidence. -
gallopingcamel at 14:26 PM on 5 October 2010Uncertain Times at the Royal Society?
Baz, (#94), you ask: "What else could have caused a fairly-sharp upturn in temps?" That is a fair question but have you considered the fact that sharp upturns and downturns are the norm in "Climate Change". If you doubt me take a look at the ice core records that go back over 750,000 years. It is true that we are experiencing a "sharp upturn" but it is not unprecedented. The big difference is that this time the upturn could be caused by humanity's fondness for burning growing quantities of fossil fuel. -
archiesteel at 14:16 PM on 5 October 2010Carbon Dioxide - Everyone's Favorite Pollutant
@GC: CO2 is a pollutant, because too much of it is harmful to us. That point has been made to you over and over again, and you have yet to offer a convincing counter-argument. This is how debating works, by the way. You can't just restate your original position, or claim that everyone but you would fail 9th grade science, and expect to convince others that you are right. -
Phila at 14:13 PM on 5 October 2010Carbon Dioxide - Everyone's Favorite Pollutant
Thingadonta: Using the argument that everything that is 'bad' for the envrionment is no good would mean no houses (cuts down habitat), no roads, no mines, no anything. The only people I've ever seen using this argument are "skeptics" who'd rather build strawmen than address their opponents' objections in good faith. C02 obviously is necessay for life, but too much might not be good. But there is a danger in giving bureacratic agencies legislation which classifies something as a 'pollutant' which is also necassary for society to function. I'm sure we're supposed to be frightened by the word "bureaucratic," but the fact is, we routinely put bureaucracies in charge of serious and dangerous things, from epidemic disease to military forces to nuclear weapons. If AGW is half the threat that mainstream, peer-reviewed science says it is, then the legislation you decry is really the only reasonable response to it. To imagine otherwise is childish, IMO. It is not about whther or not something is harmless, but whether the 'harm' outweighs the benefits, in other words, is a certain amount of harm acceptable, or can the hamr be reduced to an acceptable level? Acceptable to whom? Many of the people who will suffer most from the effects of AGW have little or no voice in this debate. Note, also, that to the extent that reducing harm is possible, it'll probably be accomplished by people who've accepted the scope of the problem, instead of sticking their heads in the sand (i.e., by the "greens" and "bureaucrats" who worry you so much). -
Daniel Bailey at 14:12 PM on 5 October 2010Carbon Dioxide - Everyone's Favorite Pollutant
Re: gallopingcamel One could also posit the lack of understandings of ice ages as a denial of 9th grade science as well. But that would also be wrong. ;) The Yooper -
gallopingcamel at 14:01 PM on 5 October 2010Carbon Dioxide - Everyone's Favorite Pollutant
scaddenp (#40), Yes, I am still having trouble understanding ice ages but there are other threads for that. This thread does not condemn the ludicrous position taken by the EPA with regard to naming CO2 as a "pollutant". It is very disappointing to find the (mostly) sane denizens of this blog going along with what amounts to a denial of 9th grade science. -
Daniel Bailey at 13:59 PM on 5 October 2010Climate Change: Past, Present, and Future
Re: doug_bostrom (76) Thanks, Doug. The graph, not found in the paper (nor can I locate it on the GISP2 website), must be what he was referring to. The graph hardly has the resolution to make any claims about the Central Greenland location of the core during the LIA or the MWP, let alone any further extrapolation outside that area. Maybe I can find it on Alley's website. Re: scaddenp (77) Nice hauling out the secret weapon! The Yooper -
scaddenp at 13:47 PM on 5 October 2010Climate Change: Past, Present, and Future
GC - I am extremely puzzled by your summary of what the paper purports to show. For starters perhaps, how is ice core supposed to show us anything at all about last 100 years? How about this graphic then? Of course you could write to Richard Alley and ask his opinion of your interpretation. -
CBW at 13:45 PM on 5 October 2010Carbon Dioxide - Everyone's Favorite Pollutant
thingadonta @50, you are creating a bit of a straw man. Calling something a "pollutant" is not the same thing as saying that all sources of the thing must be completely eradicated. We live every day with pollutants, and society must constantly evaluate the costs of those pollutants against the benefits of the activities that generate them. Climate (and other) science is trying to get a handle on the costs of CO2 emissions, not the benefits. Human society as a whole will bear those costs, regardless of anyone's arguments for or against global warming. Without an accurate understanding of the costs, there is no way for society to make rational decisions on cost versus benefits. That is why the people intent on obscuring the truth are doing such a disservice to mankind. -
Doug Bostrom at 13:31 PM on 5 October 2010Climate Change: Past, Present, and Future
I just have a thing about trying to supply links for complete articles instead of abstracts, Daniel. No way can I read 'em all, heh! I suspect GC's conclusions are largely based on the graph found at the URL he supplied but GC can say better. -
Daniel Bailey at 13:29 PM on 5 October 2010Climate Change: Past, Present, and Future
Re: doug_bostrom (74) Thanks, Doug. I took the time to read it first...to find you beat me in posting the actual link. Re: gallopingcamel (73) Are we reading the same paper? Alley's 2000 paper deals with the termination of the Younger Dryas event, circa 11,500 BP...nowhere in the paper is a discussion of the LIA, the MWP or temperatures over the last 10,000 years. Please give us the actual source(s) for your point 1-5 claims. The Yooper -
Doug Bostrom at 13:22 PM on 5 October 2010An underwater hockey stick
JMurphy JohnD's email quote appears to have been sourced here. It's worth reading the whole thing, a familiar refrain as we've yet again been treated to a rhetorically expedient selection. There's some discussion here further indicating things were not as simple as they've been portrayed. Not on-topic; maybe there's a better place here, such as "Models are unreliable." -
muoncounter at 13:08 PM on 5 October 2010Carbon Dioxide - Everyone's Favorite Pollutant
"greenhouse gases in the atmosphere may reasonably be anticipated both to endanger public health and to endanger public welfare." The public health crowd has something to say here: It is now widely accepted that climate change is occurring as a result of the accumulation of greenhouse gases in the atmosphere arising from the combustion of fossil fuels. Climate change may affect health through a range of pathways, for example as a result of increased frequency and intensity of heat waves, reduction in cold related deaths, increased floods and droughts, changes in the distribution of vector-borne diseases and effects on the risk of disasters and malnutrition. The overall balance of effects on health is likely to be negative and populations in low income countries are likely to be particularly vulnerable to the adverse effects. The experience of the 2003 heat wave in Europe shows that high-income countries may also be adversely affected. Sounds unhealthy. A bit like a pollutant, no? -
Doug Bostrom at 13:01 PM on 5 October 2010Climate Change: Past, Present, and Future
Full text of Alley 2000 as mentioned by GC is here (pdf). -
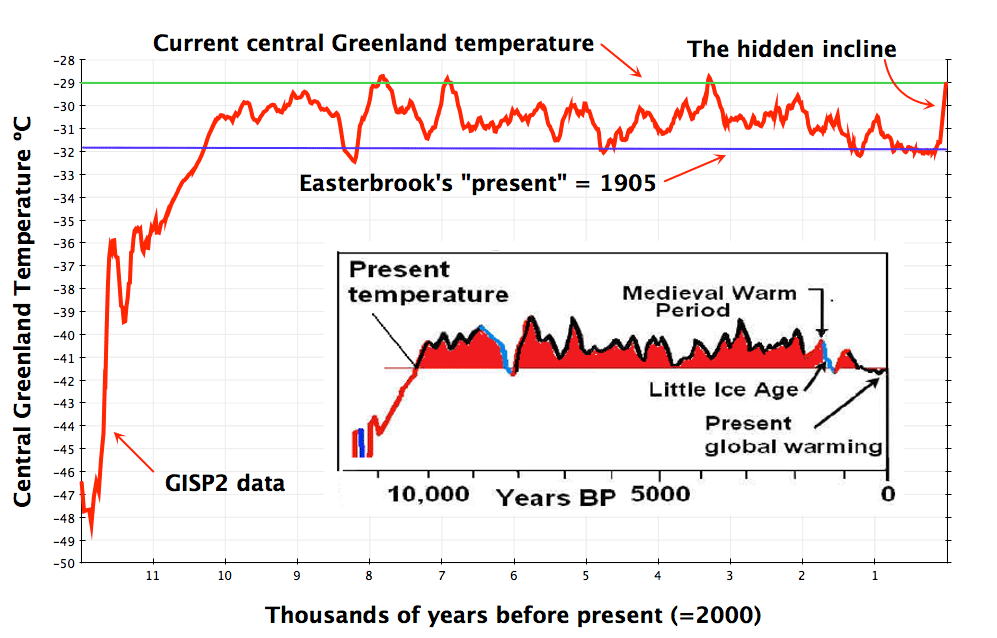
gallopingcamel at 12:48 PM on 5 October 2010Climate Change: Past, Present, and Future
Albatross, (#72), Thanks, the Leaf sounds quite similar to the EV1 and the price is in the right ball park. John Cook, Picking up on what you said at the top of this thread: "Of course, it's also important to realise that this is the global average. Warming at high latitudes may be 3 times as much." This appears to be an accurate statement. The evidence from ice cores shows temperature swings of greater than 20 degrees Kelvin as the planet undergoes cycles of glaciation. It follows that it should be easier to measure warming or cooling by studying temperatures at high latitude. Back in 2000, Richard Alley published a paper on temperatures in Central Greenland at a latitude of 73N: http://www.ncdc.noaa.gov/paleo/pubs/alley2000/alley2000.html This paper shows a number of interesting things, at least for central Greenland. 1. The temperature swings ARE much greater than shown in reconstructions for low latitudes. 2. Current temperatures are higher than during the LIA. 3. Current temperatures are lower than during the MWP and various earlier warm periods. 4. The temperature has been higher than today for 8,500 years out of the last 10,000. 5. Ice accumulation increases during warm periods so declining ice volume is not necessarily evidence of warming. -
TOP at 12:08 PM on 5 October 2010An underwater hockey stick
Thanks scandenp #62. That's what I was looking for. -
Doug Bostrom at 11:59 AM on 5 October 2010Carbon Dioxide - Everyone's Favorite Pollutant
But there is a danger in giving bureacratic agencies legislation which classifies something as a 'pollutant' which is also necassary for society to function. Like, say, oil in tankers and pipelines. Goodness knows, the petroleum industry willingly did such good a job with self-regulation, the as-usual-vaguely-characterized-government-bureaucracies have been simply dangerous in their overweening regard for keeping oil inside of the various things oil is supposed to be inside of. I tend to agree with Lonborg that money would be better spent on alternative energies and mitigation effects... Sounds like a believer. To get a broader perspective on economics of mitigation, etc. see Real Climate Economics (not related to "RealClimate") -
archiesteel at 11:58 AM on 5 October 2010Carbon Dioxide - Everyone's Favorite Pollutant
@Ned: no problem, we provided two different links, thereby adding weigh to our shared position. -
archiesteel at 11:57 AM on 5 October 2010We're heading into an ice age
@TL: "Ah, me thinks the idea of Milankovitch cycles borders on blaming astrology for the ice ages." Cute. Completely wrong, but cute. "There is a much better explanation and it is lighting up the skies over both hemispheres ever more with each year." TSI has been going down, and we are past the Holocene Climatic Optimum. If it was up to natural cycles, we should be cooling, not warming up. -
Ned at 11:56 AM on 5 October 2010Carbon Dioxide - Everyone's Favorite Pollutant
Argh, beaten by one minute. Congrats, archiesteel. -
Ned at 11:55 AM on 5 October 2010Carbon Dioxide - Everyone's Favorite Pollutant
thingadonta ... you may think you agree with Lomborg, but Lomborg has apparently reconsidered, and he no longer agrees with you. -
archiesteel at 11:54 AM on 5 October 2010Carbon Dioxide - Everyone's Favorite Pollutant
@thingadonta: You seem to be behind on the news: Bjorn Lomborg now admits that Global Warming to be one of the world's greatest threats. In the case of Anthropogenic Global Warming (which it seems you believe now), the bad outweighs the good. -
Doug Bostrom at 11:51 AM on 5 October 2010We're heading into an ice age
Oh, don't get me going on the widespread cold in the northern hemisphere... Agreed, it's apparent there would be little point in that, so please don't start. Clearly you're not a fellow to be swayed by collated data permitting of useful conclusions, meanwhile the strong preference here is to stick w/exactly that sort of information. -
Ned at 11:49 AM on 5 October 2010We're heading into an ice age
Tom Loeber writes: Ah, me thinks the idea of Milankovitch cycles borders on blaming astrology for the ice ages Please don't be a troll. The association between Milankovich geometry and glacial/interglacial cycles is very, very well established. The mechanisms by which this works are not completely understood, but we do know a lot about it. The very short version is that a reduction in seasonal insolation during high-latitude Northern Hemisphere summers allows snowpack to persist through the summer, leading to the inception of ice sheets. When summer insolation around 65 North begins increasing again, this process reverses itself. If you don't understand how this works, check out Bill Ruddiman's textbook (Earth's Climate) or David Archer's eminently readable book (The Long Thaw). -
thingadonta at 11:48 AM on 5 October 2010Carbon Dioxide - Everyone's Favorite Pollutant
The nature of "pollution" and what it means is where alot of greens go wrong in science. The question is not whether something does 'bad' to the environment, the question from a human nd ecological perspective is whether the bad outweighs the good. Using the argument that everything that is 'bad' for the envrionment is no good would mean no houses (cuts down habitat), no roads, no mines, no anything. The question is one of balance, and that mean looking at things from a broader perpsective. This is general government policy in Australia, weighing up the environmental, social and economic costs and benefits of various policy decisions. With regard to 'pollution', the issues are the same. A pollutant can also be 'good', it depends on the degree of the relative effects. Eg DDT saves lives, and causes cancer at the same time. Mines damage an area and create jobs. Radiactivity creates energy and causes cancer. etc etc. This is also the general argument of the Skeptical Environmentalist by Lomborg. C02 obviously is necessay for life, but too much might not be good. But there is a danger in giving bureacratic agencies legislation which classifies something as a 'pollutant' which is also necassary for society to function. Have a look at the first definition, it is completely circular and doesn't define what a pollutant actually is: "The term “air pollutant” means any air pollution agent..." .......ie 'a pollutant is a pollutant'. the 2nd definition, doesnt weigh up the costs and benefits: "....anticipated to endanger public health or welfare". So do cars. This is not the issue, it is "whether the danger to public health or welfare" outweighs the benefits. Again, it is only half a definition. The third: "in some harmless form", which again fails to mention the cost/benefit issue. It only refers to whether somethng is harmless or not. By this defintion cars would have to stay in garages, otherwise they would be harmless. It is not about whther or not something is harmless, but whether the 'harm' outweighs the benefits, in other words, is a certain amount of harm acceptable, or can the hamr be reduced to an acceptable level? The argument over c02 as a pollutant depends on whether the IPCC worst-case scenarios turns out to be correct, and whether there is any practical way of mitigating greenhouse gas warming by other methods (eg large scale c02 extraction from the atmosphere and suitable capture). I tend to agree with Lonborg that money would be better spent on alternative energies and mitigation effects, than various other policies such as Kyoto nad issues relating to eg 'pollutants'. etc -
kdkd at 11:46 AM on 5 October 2010New temperature reconstruction vindicates ...
KL #133 Just to clarify: if you come up with something that has good validity with sound logic and empirical support then I'm happy to accept your argument. However the two main arguments that you repeat constantly are both fatally flawed with poor logic, lack of empirical support and confirmation bias. Yet another example of confirmation bias is that you take my statements on the empirical validity of your work and make the assumption that there's some non-empirical reason that I find your argument lacking. Anyway, as others have said, I'm not sure where this stuff is on-topic where it hasn't already been done to death. -
Charlie A at 11:40 AM on 5 October 2010Billions of Blow Dryers: Some Missing Heat Returns to Haunt Us
Updated OHC posted at NODC: http://www.nodc.noaa.gov/OC5/3M_HEAT_CONTENT/ A blink comparator of the old vs new heat content values: http://i54.tinypic.com/24178ur.jpg from Bob Tisdale's blog: http://bobtisdale.blogspot.com/
-
Daniel Bailey at 11:38 AM on 5 October 2010What constitutes 'safe' global warming?
Re: ocrow (31)"I keep seeing articles that refer to particular atmospheric CO2 levels corresponding to particular global temperature changes. Is there a graph that shows the relationship between the two?"
Depending upon what you're interested in: Near-Term (Recent History) Mid-Term (The Age of Civilization; i.e., Old-As-Dirt) no CO2 levels on this one, but gives a neat perspective. The Last 5 De-glaciation Events superimposed on each other for comparison. Kinda Old (400,000 BP) Paleo (Really Old - 800,000 BP) Leave it to the public servants at the EPA to give us something useful. Note that while other forcings exist (some positive, some negative), the resulting temperatures comes from the summary balance of all of them, and forcings can and do change over time (albeit slowly). Until humans messed with the biggest control knob of temperatures. The Yooper -
Ned at 11:38 AM on 5 October 2010Carbon Dioxide - Everyone's Favorite Pollutant
The Inconvenient Skeptic writes: The warming at the end of the last glacial is a serious problem for computer models that depend on CO2 levels. If the feedback of the global climate is so sensitive to CO2 levels then the any change in CO2 would cause unbounded feedback and thermal runaway. Since the Earth is stable (within a temperature range, +/- 7C over the past 1 million years) there has never been a thermal runaway. The reason is that the Earth is a stable system. The idea that positive feedback implies an "unbounded" increase in temperature (or "thermal runaway") is both common and completely mistaken. See the article on Does positive feedback necessarily mean runaway warming? for an explanation. Positive feedback will not lead to a "runaway" increase if the feedback factor f is less than 1. And, in fact, modest (f < 1) positive feedbacks are a necessary feature of the climate regime as seen in the glacial/interglacial cycles. So ... I'm sorry, but your ideas expressed in the quote I've excerpted above are pretty much completely wrong. I hope you'll continue reading this site. John Cook and the rest of the community here have developed an exceptionally high-value resource for exploring many of the common questions and misconceptions that persist around climate change issues.Moderator Response: And put comments about that topic on that page, not this one. -
Riduna at 11:32 AM on 5 October 2010What constitutes 'safe' global warming?
http://www.onlineopinion.com.au/view.asp?article=9370 might be of interest. The debate is no longer about whether temperature increase above pre-industrial temperatures can be limited to 2C. by 2100. Given our desire to burn increasing quantities of fossil fuels, we can be certain that temperatures will rise more than 2C by 2100 and that is unavoidable. The effects will of course include accelerated melting of the polar ice sheets and, as noted by others above, a sea level rise of at least 1m by 2050 and over 2m. by 2100. The effects on river delta’s sustaining much of the global population is also well known. It is already evident that global warming is responsible for accelerated retreat of glaciers. Normally, glaciers store and release fresh water which flows into rivers and underground aquifers that are drawn on for agriculture and human consumption. This source of fresh water is imperiled by retreating glaciers and by burgeoning population growth. We will not have to wait until 2100 to observe the combined effects of rising sea level and retreating glaciers on the ability of humans to feed themselves. We are starting to see those affects now. They will certainly become increasingly obvious over the next 20-30 years and catastrophic long before 2100. And we still cheerfully increase the level of CO2-e greenhouse gas we pump into the atmosphere, despite repeated warnings by scientists of the consequences. Why? -
Tom Loeber at 11:29 AM on 5 October 2010We're heading into an ice age
Ah, me thinks the idea of Milankovitch cycles borders on blaming astrology for the ice ages. There is a much better explanation and it is lighting up the skies over both hemispheres ever more with each year.
Prev 2178 2179 2180 2181 2182 2183 2184 2185 2186 2187 2188 2189 2190 2191 2192 2193 Next


