


 Arguments


Recent Comments
Prev 2218 2219 2220 2221 2222 2223 2224 2225 2226 2227 2228 2229 2230 2231 2232 2233 Next
Comments 111251 to 111300:
-
John Hartz at 10:22 AM on 14 September 2010Pielke Sr and scientific equivocation: don't beat around the bush, Roger
Albatross, As it turns out, I had already been to the NODC webpage that you provided the link to. The only narrative provided on this webpage is a link to: “Global ocean heat content 1955–2008 in light of recently revealed instrumentation problems,” S. Levitus,1 J. I. Antonov,1 T. P. Boyer,1 R. A. Locarnini,1 H. E. Garcia,1 and A. V. Mishonov1 Received 31 December 2008; revised 26 February 2009; accepted 18 March 2009; published 11 April 2009 GEOPHYSICAL RESEARCH LETTERS, VOL. 36, L07608, doi:10.1029/2008GL037155, 2009 As best I can tell, this paper does not provide answers to the questions I had posed in #208. I have a contact in NODC and will pose the set of questions to him. -
John Hartz at 09:59 AM on 14 September 2010Pielke Sr and scientific equivocation: don't beat around the bush, Roger
Albatross, Thanks for the link. I posed the questions in #208 because there are two basic issues about the OHC as computed by the NODC embedded Dr. Pielke's hypothesis. One is the slope of the trend line and the other is the "missing heat." Most of the discussion on this thread appears to be focused on this issue. Everything else being equal, if there are undetected flaws in the methodology used by the NODC to compute the OHC of the upper layer, those flaws could very well produce underestimates of the OHC. If this were the case, the "missing heat" may not be missing after all. Personally, I believe that most of the “missing heat” is in the lower layers of the oceans. -
MattJ at 09:56 AM on 14 September 2010The contradictory nature of global warming skepticism
I see this article has generated a lot of comments. No surprise there. But where there is a surprise is this: none of the comments home in on WHY the 'skeptics' rest content with such glaring contradictions. The answer is all too simple: stark and simple. The 'skeptics' have figured out what eludes many readers of Skeptical Science": they have figured out that their target audience doesn't care about the contradictions. "How can this be", the reader may justifiably wonder? The answer to that is also stark: the average citizen/voter in their target audience has never learned the value of logical/critical reasoning. Instead, to the extent that they think about it at all, they think that illogical arguments are perfectly OK, as long as they mesh with your feelings. It doesn't matter to them that their feelings are uninformed, and formed in an uninformed environment. They never read the saying of Ben Franklin, "He who rides a passion rides a mad horse". Nor does it matter to them that entire industries have arisen to take advantage of the gullibility such an acceptance of the illogical implies. Nor did they ever read about the theorem Aristotle first proved concerning the vanity of allowing contradiction: if you allow one logical statement to be both true and false, then ALL of them must be both true and false. But without ever leaning of either of these two principles, is it really any wonder they are content to remain in their fantasy lands? It is no source of wonder to me. The ideas of the "Age of Reason" never really did sink that deeply into the larger society's consciousness, and that Age is long over now anyway. We are now in an age of a new irrationality. But that is exactly why I gave the link a few weeks back for one of the first 'scientific' works on the subject of persuading such an audience, The Rhetoric of Aristotle. For despite being such a supreme logician himself, having practically invented the first Logic single-handed, he understood that the rhetorician's target audience is highly illogical -- and ironically, did a brilliant job of logically analyzing their psychology and the techniques to persuade them of the truth. There were, of course, other authors on rhetoric who taught their readers how to persuade of whatever conclusion -- true or not. But I won't mention their execrable names here;) So yet again: if you REALLY want to write persuasive articles to defeat the propaganda campaign, you MUST read this book -- and others that have built on his insights ever since. -
Albatross at 09:01 AM on 14 September 2010Pielke Sr and scientific equivocation: don't beat around the bush, Roger
Badger, go here for more information: http://www.nodc.noaa.gov/OC5/3M_HEAT_CONTENT/ -
John Hartz at 08:51 AM on 14 September 2010Pielke Sr and scientific equivocation: don't beat around the bush, Roger
Anyone, How did NOAA/NODC develop the methodology for computing OHC from the data collected by the ARGOS buoys? Was it done in-house, or through contract? Was an advisory committee of outside-the-agency experts involved in the development process? Has the methodology that was produced and used since been reviewed in a published paper? Has the methodology been tweaked since it was first used? -
Albatross at 08:29 AM on 14 September 2010How Monckton got his IPCC predictions wrong
Thanks for all the hard work Alden! The AOGCMs are actually doing quite well Christopher: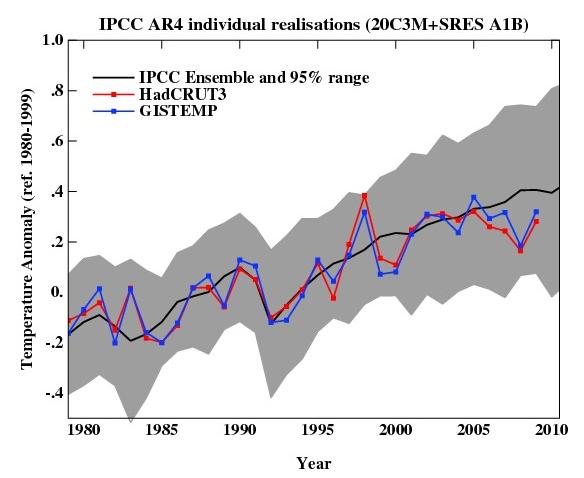 Image from RealClimate
-
Albatross at 08:12 AM on 14 September 2010The contradictory nature of global warming skepticism
Baz, This is getting tiresome. The 0.1 decrease on the pH scale is what has been observed to date for a 40% (or so) increase in CO2, and we are easily going to double CO2 this century. The pH is going to continue to decline, a concern given that the impacts stemming from that relatively small decrease are already being felt . The lowering of pH is going to be yet another stress on marine life (i.e., cumulative impacts). There are plenty of useful resource son the web from reputable groups doing research into this issue. There are also some helpful links on this very site. I encourage you to get past your dislike of the term (as I did) and view the science with an unbiased eye. It took me quite some time to formulate my questions to you on global records, please do reply when you have a chance. If not, fine, but you should know that most of your objections/complaints etc. have been addressed by John and others on this very site, so there is no need to deal with them on this thread b/c as far as I can tell they are off topic. -
Paul Daniel Ash at 08:01 AM on 14 September 2010The contradictory nature of global warming skepticism
what WOULD be acceptable for those that believe in man-made warming HadCRUt is made up on land and sea temperature measurements only. Even if the temperature stayed level or cooled over a statistically significant period, but measurements of, say, ocean heat content continued to increase, I'd find that unconvincing. The case for anthropogenic warming is based on multiple converging lines of evidence. It simply does not follow that looking at a limited subset of one measurement can throw the whole thing into question. I know you're not claiming to be rational, so this critique is not aimed at you. You asked; I'm answering. -
Albatross at 08:01 AM on 14 September 2010Pielke Sr and scientific equivocation: don't beat around the bush, Roger
VeryTallGuy @206, I concur. I would also add that while practically everyone here agrees that OHC is a good metric, it is only so if it can be measured properly/accurately. The disagreements amongst the various analysis techniques of the Argo data suggest that there are issues that preclude making definitive statements. Dr. Pielke has still not stated why he has chosen the NODC data over the other datasets available (e.g., Hadley, PMEL, von Shuckmann et al., Lyman et al., Trenberth). -
JMurphy at 08:00 AM on 14 September 2010The contradictory nature of global warming skepticism
Baz wrote : "To answer your question (as I have done above plenty of times - even when people didn't answer mine) I have learned that some of you think that if warming doesn't continue for 15-20 then you will change your mind. As I said (again) I chose to after only five years - my choice." Actually, you haven't really answered any questions except by stating what you believe and what you reckon. Nothing substantial and no detail as to why you believe such things. Your response shown above gives a good example : It has been pointed out how one needs a longish period of time (you give it as "15-20" but I would say it should be more like 20-30 years - there's a good explanation why, here) to determine a valid climatic trend, but not in isolation - the reasons behind such a trend also need to be understood. Your response ? "I chose to after only five years - my choice". How can anyone respond to an assertion like that ? How can you possibly, rationally, arrive at such a position ? Actually, maybe the best response to you is this : "I choose to believe that you are not being totally honest and credible. My choice." But I do have some back-up to my assertion, which is another sentence of yours : "I did want to engage to get some answers on what believers in warming think." So, did I imagine reading you saying you used to be a 'believer' ? And you don't know what 'believers' think ?! Pull the other one... -
Paul Daniel Ash at 07:49 AM on 14 September 2010The contradictory nature of global warming skepticism
Baz, a "straw man" is an argument based on misrepresentation of an opponent's position. It's a descriptive term. Unless you provide some evidence that your accusation is correct, I'd ask you to let it go. -
archiesteel at 07:48 AM on 14 September 2010The contradictory nature of global warming skepticism
Also, you have yet to provide the correct term for lowering the pH of oceans... -
archiesteel at 07:46 AM on 14 September 2010The contradictory nature of global warming skepticism
@Baz :"archie, yes I can prove that - I have the emails!" You don't get it. The fact that a conversation with Phil Jones should not be a valid reason to distrust GISS in itself. Anyway, that's irrelevant, since the CRU data shows a warming trend for the last 10 years. Logically, this should convince you we are still in a warming trend. "We've had "troll" now "strawman"." Well, since AGW theory-proponents are not certain this is what will happen (only that it is highly probable), then it's fair to say claiming they are *is* making a strawman argument. So, you really have only two choices here: either you take back your assertion that AGW proponents are certain of what's going to happen, or you have to accept the fact you are making a strawman argument (a logical fallacy). -
pbjamm at 07:45 AM on 14 September 2010The contradictory nature of global warming skepticism
Greetings everyone. I have been lurking on this site for 1+ years now and have never felt the need to make my voice heard before. Now I am going to defend Baz. Baz at 07:06 AM on 14 September, 2010: "If I don't change my views based on a few replies, that most certainly doesn't make me a troll either." This is a perfectly reasonable stance. You can not expect someone to change their mind instantly. It will take time to digest the info you have presented. If he is really interested in the data (and I have no reason to believe otherwise) then he will be back to learn more. Pressing him to reverse himself now is only going to push him away from this resource. -
The contradictory nature of global warming skepticism
archie, yes I can prove that - I have the emails! Paul. For the third time I did not say that I have theories about what WILL happen - I did not. We've had "troll" now "strawman". Sorry, but it's very poor Paul. There's only "ad hominem" to go and we'll have the set! From my observation of the HadCRUt data I see no reason to be alarmed at postive feedbacks. 10 years of reasonable stability (you'll not that I didn't include: 0.29 0.27 ...to show 12 years! Now, that's 'unscientific' - granted. But you'll remember I was trying to tease out what WOULD be acceptable for those that believe in man-made warming. -
The contradictory nature of global warming skepticism
Albatross, it IS a valid reason for dismissing it. I work with acid. If we change the value from 8.1 to 8.0 we would NOT say that we have "acidified" it! Although it's logarithmic, it's too small a change to justify the term. Not sure about RSS and UAH. I've read a bit on it, and there could be satellite drift, so I'm not at all sure. Are you asking me about HadCRUt? If so, then the answer is that it excludes much of the Arctic. -
archiesteel at 07:26 AM on 14 September 2010The contradictory nature of global warming skepticism
@Baz "archiesteel. Going from 8.1 to 8.0 isn't "acidification". It's simply the wrong term, but is used so much now." Sure it is. It is making the water less basic and more acidic, therefore it's acidification. I don't understand your opposition to that term. I'm curious, though. What would be the correct term for that phenomenon? -
Paul Daniel Ash at 07:25 AM on 14 September 2010The contradictory nature of global warming skepticism
For the third time, my point is that you do have some guesses or ideas or expectations about what you think may happen. You base those guesses in, as you've said, a reading of the HadCRUt temperature data. You allow for uncertainty in those guesses. Except for a certain rigor, this is exactly the position of mainstream scientists. Your accusation of certainty is a straw man. Please either provide an example of any such assertion or move on to a different argument. -
archiesteel at 07:24 AM on 14 September 2010The contradictory nature of global warming skepticism
@Baz: "If I don't change my views based on a few replies, that most certainly doesn't make me a troll either." True, however if you present opinions that are not supported by a rational argument on a science-based site, then chances are you are, in fact, trolling. For example, we've explained why you shouldn't make up your mind on a five-year time frame. You haven't put forward any rational argument as to why you should. Considering this is a science site, you kind of have to if you want to be taken seriously, or admit you were wrong (there's nothing wrong with that). "And no, not "wild-ass guesses" just observation - of the HadCRUt 10 year data, as I have explained." Looking at the HadCRUt data for the last 10 years shows a positive warming trend. So, I guess you'll go back to being a believer now? (I mean, if you're consistent with yourself.) http://www.woodfortrees.org/plot/hadcrut3vgl/from:2000.5/trend/plot/hadcrut3vgl/from:2000.5 "my distrust of GISS relies on a email conversation with Phil Jones" That's hardly a valid argument - especially since you can't prove such an exchange ever took place. It's usually a bad idea to use such unverifiable claims as arguments in a scientific discussion... -
The contradictory nature of global warming skepticism
Paul Daniel Ash. You said that "you have your own theories about what WILL happen". You still haven't pointed out where I said that. Please state or retract. Thank you. -
Albatross at 07:21 AM on 14 September 2010The contradictory nature of global warming skepticism
Gaz, "I cannot put any faith in GISS due to the Arctic proxies." I am not sure what these "proxies" are that you are referring to in the operational NASA record-- they do not use proxies in GISTEMP. Or did you mean to say that you have issues with the method they employ to interpolate sparse data over the Arctic? Did you know that NCDC use similar data and interpolations techniques as NASA does? Moreover, NASA include data from Arctic stations which, as far as I know, HadCRUT does not. Those data have value. Do you know exactly how HadCRUT estimates the anomalies over the high Arctic Gaz? Do you have any faith in the RSS MSU data over the high Arctic, or that product in general? Sorry for all the questions, but it seems that you are opining about things about which you do not have much experience, so I'm trying to establish what you do and do not know. For better, or worse, the experts use the term ocean acidification. Sorry, like it or not, we have to deal with that. It is certainly not a valid reason for dismissing it. -
The contradictory nature of global warming skepticism
archiesteel. Going from 8.1 to 8.0 isn't "acidification". It's simply the wrong term, but is used so much now. -
scaddenp at 07:13 AM on 14 September 2010Climate change: Water vapor makes for a wet argument
Colder temperatures closer to the ground is a temperature inversion and it needs specific conditions to occur. Maybe your BOM stations have the data to check it. Firstly, it needs still night air so that cold dense air can accumulate close to the ground. Next you need clear skies and dry air. Why? because under these conditions backradiation is reduced allowing the ground cool efficiently by radiation to space. Got a BOM station in northern Queensland to compare with? This is text book stuff. Say "Essentials of meteorology: an invitation to the atmosphere". And yet again, in discussion of water vapour and evaporation effects on climate, your BOM stations are largely irrelevant because the processes that matter happen at sea. As far as I can see, you dont study either the text book or basic physics because you believe both wrong. However, I dont think you can make a cogent argument for them being wrong until you first understand what our best model is. -
ClimateWatcher at 07:12 AM on 14 September 2010A history of satellite measurements of global warming
"Further to the acronym comment, can we have the expansion of MSU please." MSU is the Microwave Sounding Unit. It is a measurement system of radiometers which, not surprisingly sample electromagnetic energy in the 'microwave' portion of the spectrum. The National Oceanic and Atmospheric Administration (NOAA) has operated satellites which have had various generations of MSU instruments on them since late 1978. The MSU samples energy that is emitted by oxygen atoms. The theory of operations is that the higher the temperature at a given region of the atmosphere the greater the energy that will be received at the satellite. The energy at this wavelength is not particularly large in terms of earth's energy budget, but the unique nature of the emissions in theory makes it suitable as a temperature record. -
The contradictory nature of global warming skepticism
Paul Daniel Ash. That "theory" was about warming - held until five years ago. And no, not "wild-ass guesses" just observation - of the HadCRUt 10 year data, as I have explained. -
The contradictory nature of global warming skepticism
archiesteel, no my distrust of GISS relies on a email conversation with Phil Jones! -
Riccardo at 07:07 AM on 14 September 2010A detailed look at climate sensitivity
Berényi Péter, the millenium prize problem has a completely different goal than "simply" solve the Navier–Stokes equations. Are you just making noise to not let people understand? -
The contradictory nature of global warming skepticism
archiesteel, As I said, my choice, whether that's 'wrong' or not. No I know he didn't call me a troll otherwise I assume the site owner would delete the comment, but I've seen this 'type' of posting before, and I'm not in favour of it. I would have thought that the fact that I've been completely upfront on my opinions shows I'm not "trolling". If I don't change my views based on a few replies, that most certainly doesn't make me a troll either. -
archiesteel at 07:05 AM on 14 September 2010The contradictory nature of global warming skepticism
@Baz: "Albatross, yes, I too have read that the changing pH really is an issue - but it isn't "acidification"." If the pH is being lowered, how is that not acidification? "I cannot put any faith in GISS due to the Arctic proxies." Yet, their figures are corroborated by the Danish Meteorological Institute, which relies less on proxies than GISS. Again, your distrust does not seem rooted in logic, but rather seems heavily influenced by the disinformation campaign waged by climate change deniers... -
ClimateWatcher at 07:05 AM on 14 September 2010A history of satellite measurements of global warming
Some time ago, in order to understand this, I plotted the GISS Model E (upper-left) versus the RATPAC sonde data (lower-left), the RSS MSU (upper-right) and the UAH MSU (lower-right)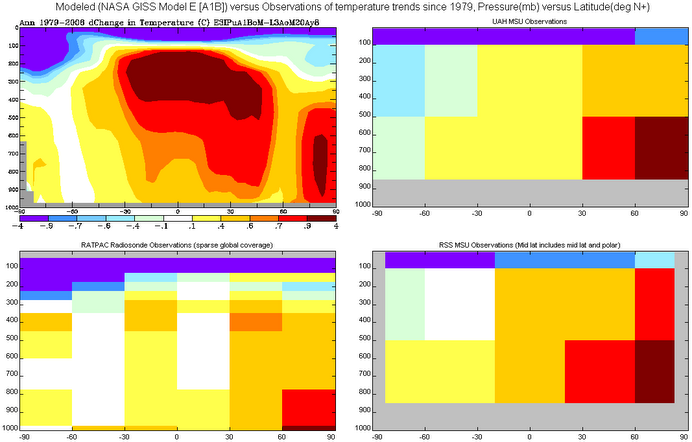
-
Paul Daniel Ash at 07:03 AM on 14 September 2010The contradictory nature of global warming skepticism
DON'T have my own theories about what will happen! If I wrote anywhere here that I did, can you point it out so that I can correct it? 04:39 AM on 14 September, 2010: "my theory about warming" My point is that you do have some guesses or ideas or expectations about what you think may happen. You hedge them about with caveats about how you don't really know for sure, and are open to change with new information. This is exactly what every climate projection says. The only difference, as I said above, is that climate scientists use data, and mechanisms rooted in well-established physical principles, to make their projections. You, on the other hand, rely on what are technically referred to as WAGs: Wild-Ass Guesses. -
archiesteel at 06:59 AM on 14 September 2010The contradictory nature of global warming skepticism
@Baz: one more thing. You said: "I have learned that some of you think that if warming doesn't continue for 15-20 then you will change your mind. As I said (again) I chose to after only five years - my choice." Right, and as we've explained, five years is too short a time period to establish a statistically-significant trend. Note that we all said 15 to 20 years *if* the cooling couldn't be explained by other sources (such as a dramatic increase in aerosols that would last that long, for some reason...) "Please don't name-call, it's puerile." To be fair, VTG didn't call you a troll. He simply stated that "asking provocative questions, hearing answers but not changing your views" is trolling. He's giving you a chance to avoid that label by giving a rational response to the points brought to you. Science isn't about opinion and feelings, it's about logically interpreting observed facts. -
Chris Colose at 06:59 AM on 14 September 2010Why positive feedback doesn't necessarily lead to runaway warming
The Paltridge paper is a re-analysis product, it's not observations. No one really thinks that these are appropriate to use to diagnose water vapor trends, which suffer from changes in instrumental over time. For instance, Soden et al (2005) quote: "“Although an international network of weather balloons has carried water vapor sensors for more than half a century, changes in instrumentation and poor calibration make such sensors unsuitable for detecting trends in upper tropospheric water vapor (27). Similarly, global reanalysis products also suffer from spurious variability and trends related to changes in data quality and data coverage (24).” A relevant reference to look at here is Trenberth, K. E., J. Fasullo, and L. Smith, 2005: Trends and variability in column-integrated atmospheric water vapor. Clim. Dyn., 24, 741-758 Note also that other reanalysis products show different results. Josie-- my interests are mostly in the physical science rather than impacts, but I read Lynas' book a while ago. I think it was a good read. You need to be careful about extrapolating conditions in the past, such as "it was 3 degrees warmer before and this happened, therefore it will happen again" or that things which didn't happen before won't now. It's hard to look at other examples to use as a template for future impacts because we don't have any past analogs for human-induced climate change in the past, but again, this isn't my area of heavy interest. -
The contradictory nature of global warming skepticism
I take the points aboput certainty in science. Yet, as I said, if you actually listen to what is said by believers in warming (if you listen with a critical ear) you might be surprised at what is said with some real certainty. -
Climate change: Water vapor makes for a wet argument
johnd - Cold air right at ground level, warmer up 1.2 meters; sounds like the classic conditions for radiation fog. The ground cools via radiation after the sun goes down, radiation that will only be absorbed (80%+?) after ~100 meters or so), air right at the ground (~1 meter) cools with the ground by conduction. 1 meter of air isn't going to stop much of that ground source IR! Keep in mind that the back radiation numbers are for a deep mass of air, not 1 meter layers. Exactly what I would expect, quite frankly. No inconsistency whatsoever. Measuring back radiation is of considerable use if you're calculating the Earth energy budget. If you disagree, I suggest you run that disagreement past Trenberth :) -
The contradictory nature of global warming skepticism
Albatross, yes, I too have read that the changing pH really is an issue - but it isn't "acidification". As the owner of this site can confirm from my registration details, I work with acids, and I hate the ter "acidification" as it's just plain wrong. I cannot put any faith in GISS due to the Arctic proxies. -
Adam C at 06:55 AM on 14 September 2010The contradictory nature of global warming skepticism
@Baz I do not "know" that the sun will rise tomorrow. Nevertheless, I make an evidence-based prediction that it will, and most likely I will be correct. Science is all about uncertainty and prediction. Nothing in science is known. Telling an audience of scientists that they don't "know" what will happen is completely unnecessary and doesn't make your case at all. -
archiesteel at 06:54 AM on 14 September 2010The contradictory nature of global warming skepticism
@Baz: "In all the sites I read, it would appear the exact opposite." Saying something has a high probability of occuring doesn't mean you're certain it will occur. For example, if you're playing Blackjack and you haven't seen a figure in several rounds, chances are higher than normal that the dealer has a figure as his hidden card. Of course, you can't tell that for sure, but it'd be unwise to bet he doesn't... -
The contradictory nature of global warming skepticism
VeryTallGuy. That's a shame you posted that. As you'll see above, I HAVE responded. How did you miss it? Is it a standard response to trot out the word "troll"? I did want to engage to get some answers on what believers in warming think. To answer your question (as I have done above plenty of times - even when people didn't answer mine) I have learned that some of you think that if warming doesn't continue for 15-20 then you will change your mind. As I said (again) I chose to after only five years - my choice. Please don't name-call, it's puerile. -
Albatross at 06:52 AM on 14 September 2010The contradictory nature of global warming skepticism
Baz, Fair enough about gravitating towards HadCRUT, but as for your claim that "I don't think GISS is valid", that is a rather odd statement, especially given that HadCRUT, NCDC, GISS and JMA (and even the ECMWF reanalysis) are all in excellent agreement (see the latest post at RealClimate). GISS has been shown to be "valid". Is it perfect? No. But then neither are the other global temperature (surface and satellite) datasets. Yet they all present a coherent, robust and remarkably similar picture of long-term warming. Mojib Latif has warned about people drawing incorrect conclusions from noise in the global SAT record arising from internal climate variability. The climate system is not going to warm monotonically, climate scientists know that. And that is why they look at trends over periods of 20-30 years and not <15 years, or worse still <5 years. Anyhow, this post is about contradictions, so I'm not sure how your comments on the SAT record fit in with this. Also keep in mind that the pH is logarithmic. Please email the experts at NOAA (specifically PMEL) and Scripps Institute of Oceanography and Woods-Hole Oceanographic Inst. and tell them that you think ocean acidification is not an issue and that they have it all wrong. Personally, I do not like the term, but I still undertsand that the science has shown it to be a very real issue for marine life. -
The contradictory nature of global warming skepticism
Paul Daniel Ash. With all due respect, I don't think you're really reading what believers in warming actually write. I don't recognise "I don't know of anyone who seriously thinks they know the future". In all the sites I read, it would appear the exact opposite. No, Paul, I DON'T have my own theories about what will happen! If I wrote anywhere here that I did, can you point it out so that I can correct it? Being sceptical isn't a theory, Paul. And I don't know what "WAGs rooted" is - please explain. -
Josie at 06:40 AM on 14 September 2010Why positive feedback doesn't necessarily lead to runaway warming
Thanks for your comment Chris, that is really helpful. I have been wanting a public discussion of the idea of 'runaway' for ages- it seems very hard to get one. Mark Lynas in his book "6 degrees" created a scenario in which we pass 2 degrees C above pre-industrial and then things are taken out of our control by a sequence of events and we rise inexorably to 6. This did not seem to me like the picture I got from reading science, apart from as a tiny possibility, hardly one that is regarded as likely. But I have not heard any climate expert address it specifically, and many have been very positive about Lynas's book, which I found odd considering what they said elsewhere. What do you think about this? -
VeryTallGuy at 06:39 AM on 14 September 2010The contradictory nature of global warming skepticism
Baz "No, in a word, I'm not here to argue, but to learn." Can you enlighten us as to what you have learned please Baz, because asking provocative questions, hearing answers but not changing your views has a name: *trolling* Either you've learned something, or you're trolling. Which is it ? All the people here who've honestly engaged with you deserve a response. -
VeryTallGuy at 06:32 AM on 14 September 2010Pielke Sr and scientific equivocation: don't beat around the bush, Roger
Dr Pielke, first of all, sincere thanks for engaging so positively here, it is genuinely appreciated. Unfortunately, there is nothing in your response which in any way addresses my fundamental point, which is that the variability in the monthly data is not just a small amount, but at least an order of magnitude too large to justify your claim that a monthly snapshot can provide a planetary heat balance on that timescale. I must confess I find it disappointing that you haven't effectively responded on this. I do agree that, in principle, looking at a planetary heat balance in Joules rather than degrees would be better, however in practice the long term data is simply not available at the moment. Also, temperature is much more easily understood by the layman, enabling the science to be more accessible, which is vital if the right response is to be made. -
John Hartz at 06:11 AM on 14 September 2010Pielke Sr and scientific equivocation: don't beat around the bush, Roger
@ Radar30331 A key assumption made by Dr. Pielke is that there has been no significant warming of the deep ocean layers during the 2004-2009 period. Even Dr. Pielke admits that this key assumption an neither be proved or disproved because the requisite database simply does not exist. The "accuracy" of Pielke's postulate will therefore likely never be proven or disproven. -
archiesteel at 06:10 AM on 14 September 2010The contradictory nature of global warming skepticism
@Baz: "The term "acidification" is bizarre." It's not, really. The oceans' pH has lowered at unnaturaly high rates, hence they are "acidifying" according to a very well-understood metric. "I never claimed to be rational!" Well, science is a rational enterprise. You don't have to be rational all the time (I know I'm not), but when discussing something so important developing a rational argument is paramount. "Five MORE years has done nothing to change that, but hey, if warming picks up again significantly then I'll change sides." Warming has picked up significantly since 2006, and even more so since 2008 (if you like looking at short time spans). "I think the trouble (from looking out of my tent) is that too many of you 'think' you know what will happen to the temperature in 20-30 years time. You do not!" As Paul Daniel said above, no one does know, however we can map out some degree of probability. If there is even a one in ten chance of a catastrophic outcome (I believe it's much more than than), then it makes sense to try and mitigate it, especially since the best way to mitigate it is to transition away from fossil fuels, something we should be already doing for *other* reasons. -
johnd at 06:04 AM on 14 September 2010Climate change: Water vapor makes for a wet argument
scaddenp at 07:52 AM and KR at 23:09 PM. With regards to the question "how fast would temperatures have dropped if there was NOT back radiation", that really is not what we are seeking to understand. What I would like to understand is why with soil temperatures radiating warmth from below, and air temperatures measured at about 1.2m above ground level supposedly providing back radiation, why then do the minimum temperatures AT ground level fall so low. We know that normally temperatures quickly fall as distance from the surface increases, but as these terrestrial minimum temperatures indicate, whatever warmth contained in the air just 1.2 m above the ground is not enough to stop even more warmth being lost at ground level. Whilst focusing on this difference of minimum temperatures over a short 1.2m distance, we should also consider what differences we would find between the maximum temperatures recorded by a thermometer in the shaded enclosure and an exposed thermometer at ground level, especially when considering just what factor direct solar radiation has on evaporation as against back radiation. Whilst stations such as Alice Springs may measure back radiation, the network of stations that BOM use from across all of Australia to collect data for agricultural use are exactly the appropriate ones to use in a thread regarding water vapour, in that determining the conditions that drive evaporation is perhaps the most important part of understanding why the water vapour in the atmosphere varies as it does. What is there to tell us that conditions in the atmosphere drive the evaporation instead of evaporation driving conditions in the atmosphere? It is of little use to measure back radiation unless this can then be measured in how it manifests itself as heat arriving and being absorbed at the surface, and whilst the BOM data only gives the nett result without breaking it down as to individual inputs that determine the nett result, those nett results expose an situation that is inconsistent with what input back radiation is supposed to have. With regards to clouds, firstly I don't think the climate has ever been stable, a quick look at any cycle over any time frame indicates short term cycles within longer term cycles within even longer cycles. However I have seen some information from NASA that concludes that overall, clouds have a nett cooling effect, rather than a warming effect on the earth. -
Albatross at 06:00 AM on 14 September 2010Pielke Sr and scientific equivocation: don't beat around the bush, Roger
radar30331, Google "global warming has halted". -
Paul Daniel Ash at 05:48 AM on 14 September 2010The contradictory nature of global warming skepticism
No, I can't give you an "internally-consistent thesis" because I don't know... too many of you 'think' you know what will happen to the temperature in 20-30 years time. I don't know of anyone who seriously thinks they know the future. Most everyone has some expectation of what they think it may be. You say right in that same comment that "I was a 'warmist' in 1999, and thought that the warming would continue... By 2005 I figured that I may have my theory about warming wrong... if warming picks up again significantly then I'll change sides." So you have your own theories about what will happen. The only difference is that climate scientists' are systematic and evidence-based, and yours seem to be WAGs rooted in a rather selective reading of the available data. It's an OK place to start, but for someone who claims that you're "not here to argue, but to learn," you're doing an awful lot of argument by assertion. -
michael sweet at 05:45 AM on 14 September 2010European reanalysis of temperature confirms record warmth in 2010
Humanity Rules: Here is the temperature map for J-F-M from the NCDC:While Siberia has large cold areas, the USA is not that cold. Canada is hot and evens out Siberia. The majority of the world is hot or warm. The temperature anomaly was 0.66C, the fourth highest on record. Fourth highest out of 130. For me that is a hot period. It just happened that the cool areas were the USA and Europe. By contrast, this summer has been RECORD heat in many areas.
Prev 2218 2219 2220 2221 2222 2223 2224 2225 2226 2227 2228 2229 2230 2231 2232 2233 Next


