Climate Science Glossary

Term Lookup

Enter a term in the search box to find its definition.

Settings

Use the controls in the far right panel to increase or decrease the number of terms automatically displayed (or to completely turn that feature off).

Term Lookup

Settings


All IPCC definitions taken from Climate Change 2007: The Physical Science Basis. Working Group I Contribution to the Fourth Assessment Report of the Intergovernmental Panel on Climate Change, Annex I, Glossary, pp. 941-954. Cambridge University Press.

Home Arguments Software Resources Comments The Consensus Project Translations About Support

Twitter Facebook YouTube Mastodon MeWe

RSS Posts RSS Comments Email Subscribe


Climate's changed before
It's the sun
It's not bad
There is no consensus
It's cooling
Models are unreliable
Temp record is unreliable
Animals and plants can adapt
It hasn't warmed since 1998
Antarctica is gaining ice
View All Arguments...


Username
Password
New? Register here
Forgot your password?

Latest Posts

Archives

Urban Heat Islands: serious problem or holiday destination for skeptics?

Posted on 31 August 2010 by mothincarnate

The Urban Heat Island Effect (UHI) is a phenomenon whereby the concentration of structures and waste heat from human activity (most notably air conditioners and internal combustion engines) results in a slightly warmer envelope of air over urbanised areas when compared to surrounding rural areas. It has been suggested that UHI has significantly influenced temperature records over the 20th century with rapid growth of urban environments.

Scientists have been very careful to ensure that UHI is not influencing the temperature trends. To address this concern, they have compared the data from remote stations (sites that are nowhere near human activity) to more urban sites. Likewise, investigators have also looked at sites across rural and urban China, which has experienced rapid growth in urbanisation over the past 30 years and is therefore very likely to show UHI. The difference between ideal rural sites compared to urban sites in temperature trends has been very small:


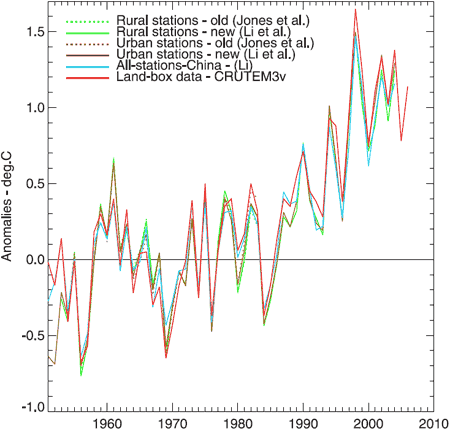
Figure 1. Annual average temperature anomalies. Jones et al (dotted green and brown) is a dataset of 42 rural and 42 urban sites. Li et al (solid green and brown) is an adjusted dataset of 42 rural and 40 urban sites. Li (blue) is a non-adjusted set of 728 stations, urban and rural. CRUTEM3v (red) is a land-only data set (Brohan et al., 2006). This plot uses the 1954–83 base period.

Another way to explore the UHI would be to look at where the majority of warming has occurred across the globe. The UHI should match where most people live. However, if you look at the 2006 global temperature anomaly (figure 2.), you find that the greatest difference in temperatures for the long term averages where across Russia, Alaska, far north Canada and Greenland and not where major urbanisation has occurred.


Figure 2. Using source data from NASA/GISS, this illustration shows the amount of change in global surface temperatures in 2006 from 1885.

The Urban Heat Effect has no significant influence on the record of global temperature trends.

This post is the Basic version (written by mothincarnate) of the skeptic argument It's urban heat island effect.

0 0

Printable Version  |  Link to this page

Comments

1  2  Next

Comments 1 to 50 out of 68:

  1. "...results in a slightly warmer envelope of air over urbanised areas when compared to surrounding rural areas.." Why not express this in degrees centrigrade?
    0 0
  2. RSVP, presumably because it varies, this is a 'basic' writeup, and the urban - rural anomaly is completely irrelevant? As the article explains, absolute temperature of any given location doesn't impact anomaly readings... we are looking at the change in temperature over time, and that is consistent between urban and rural locations. You might as well ask why not list the difference in temperature between Nome and Miami? Because that is no more irrelevant than the urban vs rural difference you ask for.
    0 0
  3. #1 RSVP at 00:10 AM on 1 September, 2010 "...results in a slightly warmer envelope of air over urbanised areas when compared to surrounding rural areas.." Why not express this in degrees centrigrade? It is about 0.2-0.3°C per doubling of local population density for a very wide range of initial population densities. This rule also works for sites considered "rural", although the exact value of the coefficient should depend on level of economic development as well. This is the reason behind similar trends in urban vs. rural sites. That is, even if scientists have been very careful to ensure that UHI is not influencing the temperature trends, they could only make sure the influence was about the same over all kinds of sites. Population density distribution is always fractal-like and population on average grows by the same percentage everywhere. The net result is "urbanization", when ever higher proportion of the population lives in really densely populated areas. But as UHI is proportional to the logarithm of local population density, it is no wonder its effect on trend is not smaller for low population density areas. In fact it is expected to be a bit stronger there, because much smaller absolute numbers are needed to increase population density twofold. The only correct check for the actual magnitude of the temporal UHI effect is to calculate temperature trends for sites where local population density has decreased for an extended period and compare them to the rest. Of course it is not easy to find such regions, because global population has doubled twice since the beginning of the last century (therefore about 0.4-0.6°C of the global trend is due to UHI). However, the quest is not impossible. For example several regions of the US experienced multi-decadal population decrease (southern West Virginia, Northern Maine, many regions of the mid-west). There are also excellent census data in the US, so it is pretty easy to locate such regions. Basically one should choose all the counties where population has decreased for the last thirty years, with a decreasing population in all the neighboring counties as well and which have climatic data for the entire period (something like Beckley city, Raleigh County, West Virginia). That's the job to be done for scientists, provided of course there are some who really want to be careful.
    0 0
  4. As I recall, IPPC states: In the past warming from UHI is insignifikant. In the future it may be signifikant. Please consider to included this in writing about UHI.
    0 0
  5. but... but... I was sure if you dropped urban stations there would be an obvious decline in global temperatures! (just kidding)
    0 0
  6. "But as UHI is proportional to the logarithm of local population density, it is no wonder its effect on trend is not smaller for low population density areas. In fact it is expected to be a bit stronger there, because much smaller absolute numbers are needed to increase population density twofold." I fail to see how rural stations are affected by this. For the UHI to be noticeable, the immediate surroundings of a station have to be affected. Many rural stations are in areas where there has been little development, and I have yet to read a convincing argument that modest rural development (such as what we have seen in the last 50 years) could have an impact that would skew the temperature records. Do you have credible studies that support your various affirmations?
    0 0
  7. #3, BP, do you have any actual research to cite, or do you just make this stuff up?
    0 0
  8. BP writes: It is about 0.2-0.3°C per doubling of local population density for a very wide range of initial population densities [...] global population has doubled twice since the beginning of the last century (therefore about 0.4-0.6°C of the global trend is due to UHI) I'm curious how this unique and unsourced analysis takes into account the 70% of the planet covered by ocean. Are the lower troposphere and sea-surface temperature trends also affected by UHI? It seems improbable given the lack of pavement in the middle of the Pacific, not to mention at the 600 km altitude of Aqua/AMSU.
    0 0
  9. As I recall, having looked at some of the "logarithmic population vs. temperature change" articles on WUWT, it was shown that all of the regions showed a similar temperature change. If the temperature trend was caused by UHI/population growth, it's necessary to show that in areas without population growth the trend is not present. I have seen no data to support this. As it stands the data indicates that (a) temperature trends have gone up, and (b) the world population has gone up. There is as yet no demonstration I'm aware of that temperatures have not gone up where the population has not gone up, which would be a minimal criteria for a cause-effect relationship. Correlation is not causation, as demonstrated here. Add to this the fact that the satellite temperature records have independently shown the same temperature trends, as Ned points out, and evidence for a UHI/population influence on temperature trends is awfully weak. Temperature trends appear to be independent of any UHI effects.
    0 0
  10. BP Cite your source. here Dr. Hanson gives data that shows the UHI effect is small. Your claim of .2-.3 per doubling is in need of data. Dr. Hanson shows that ignoring the UHI effect does not alter the data analysis. Your claims recently have not been at the level you used to have. Maybe you need to review your assessments of the data.
    0 0
  11. Please note form IPPC TAR: "These results confirm the conclusions of Jones et al. (1990) and Easterling et al. (1997) that urban effects on 20th century globally and hemispherically averaged land air temperature time-series do not exceed about 0.05°C over the period 1900 to 1990 (assumed here to represent one standard error in the assessed non-urban trends). However, greater urbanisation influences in future cannot be discounted." http://www.grida.no/publications/other/ipcc_tar/?src=/climate/ipcc_tar/wg1/052.htm To me it looks like we can't exclude UHI effect in the future. This is an important point.
    0 0
  12. There was already a long intermittent discussion of UHI here. Follow the thread.
    0 0
  13. "Are the lower troposphere and sea-surface temperature trends also affected by UHI? It seems improbable given the lack of pavement in the middle of the Pacific, not to mention at the 600 km altitude of Aqua/AMSU." What about space junk? And the international space station? (no, I'm not being serious, but neither is BP ...)
    0 0
  14. BP, I just went back and read a bunch of your posts that you linked above and I hope that you do not waste our time again as you did on the linked thread. As I said above, your stuff used to have some ideas that you could defend. This does not rise to your old standards. Please cite peer reviewed material or at least something that can be pretended to be accurate, not a blog post on WUWT.
    0 0
  15. Berényi - I read through much of the thread you linked to, but I didn't see any published papers. Can you repost links to anything published on this logarithmic UHI effect? The only reference I saw was to something blogged by Spencer, and given his track record (!) I want something published and reviewed before I take this UHI issue seriously.
    0 0
  16. I approached this thread with nervous trepidation, fearing at last that the true cause of global warming was to be finally unmasked. That those stalwart souls, laboring long into the night, would finally reach the pinnacle of their aims & finally discredit AGW... ...and to see them come SO close...and fail, yet again! Oh, my anguish, my anguish! Guess that means that yet another hope of avoiding what seems to be our fate is gone. I didn't think it would end this way. Oh, well. Time for a beer. Hey, something shiny... The Yooper
    0 0
  17. Daniel - Thank you for a lovely commentary here. Fortunately, I had already started on my beer (a homebrew vanilla oak barrel stout) before reading it :)
    0 0
  18. Beautiful piece of work by The Yooper.
    0 0
  19. For many reasons, generally well-covered in the previous thread, I am skeptical about Berényi Péter's claim (that UHI explains 0.4-0.6°C of the observed 20th century warming). The evidence for it seems to be scant to nonexistent. But, for the sake of argument, let's grant it. Land, of course, occupies only 29% of the Earth's surface, so a UHI effect of 0.4 to 0.6 C/century on land would represent 0.12 to 0.17 C/century globally. For comparison, the current (satellite-era) trend is +1.6 C/century. So BP's (inflated, IMHO) estimates would still mean that UHI explains 10% or less of the observed trend. But it's worse than that. Over much of the 29% that is land, the population density is effectively zero -- think Antarctica, Greenland, the Sahara, the Gobi, vast expanses of Siberian peatlands, etc. Just by eyeballing maps of world population density, I'd guess that around half the land surface of the Earth is effectively uninhabited. That would suggest that, based on BP's own figures, UHI explains between 2-5% of the post-1970 warming trend globally.
    0 0
  20. OK, so I thought about this some more last night, and did some calculations this morning. According to Berényi Péter, the urban heat island (UHI) effect causes a spurious trend of +0.2C to +0.3C per doubling of local population. If the population around a point went from 1000 people in 1900 to 8000 people in 2000, this (according to BP) would bias the true warming trend (if any) by +0.6C to +0.8C/century at that location, because the population doubled three times during that period. To determine the magnitude of this effect for the globe as a whole, it's not appropriate to use the overall global increase in population. You need to look at it spatially -- adding two billion people to areas that are already densely populated would have a relatively low impact, but adding the same number of people to sparsely populated areas would have a very large effect (because it would produce many more doublings on average). So, I downloaded the global 2.5-minute gridded population density data set from SEDAC. I did this for 1990 (the earliest year available) and 2010. I then calculated the number of doublings of population density for every grid cell (there are 30 million grid cells -- the data set doesn't include areas north of 85N or south of 58S, which are essentially uninhabited).[1] I then weighted each grid cell based on the cosine of its latitude. The weighted mean number of doublings of population density (1990-2010) is 0.050. Adjusting for the excluded areas at the north and south poles brings this to 0.046 doublings per 20 years. If this number seems small, consider that most of the world is covered by ocean. In addition, much of the land is essentially uninhabited (think of Antarctica, Greenland, various large deserts, much of Siberia, etc.) Having no population, these areas have of necessity experienced no doublings of population, and thus no UHI. Combining this global mean of 0.046 doublings of population density from 1990 to 2010 with BP's claimed UHI effect of +0.2C to +0.3C per doubling gives a UHI bias of +0.046 to +0.069 C/century worldwide. Over the same period, the global land/ocean temperature trend is around +1.7 to +1.9C/century, depending on which metric you use. Thus, using the "Berényi Method" for estimating UHI, over the past two decades we can say conclusively that the UHI effect has accounted for approximately 3% of the observed global surface warming trend. ------------ [1] To avoid numerical calculation issues involving 0, I recoded all grid cells with <1 person/km2 as 1.
    0 0
  21. Interesting Ned. Thanks for your work. Once again, this is the stuff you'd expect "skeptics" to do themselves if they were sincere.
    0 0
  22. #20: "calculated the number of doublings of population density for every grid cell" Ned, Nice work. But I wonder: Wouldn't the UHI become, in essence, saturated? Once an area became sufficiently 'urban', would each statistical doubling of its population actually add twice as much 'urban heat'? So wouldn't the calculated effect based solely on the number of doublings overstate the UHI?
    0 0
  23. Thanks, Philippe and muoncounter. The method used here (modeling a UHI bias based on log2 population change) doesn't seem super-convincing to me. But since BP proposed it, I thought I'd work out the quantitative implications, using a more realistic framework than the assumption that population increases uniformly everywhere. muoncounter, I agree on the "saturation" thing. But I think the bigger problem is in extrapolating the model in the opposite direction. Do we really expect a large UHI effect associated with the four doublings from 1 to 16 persons per km2? Sixteen persons per km2 is still a very sparse population. Bottom line, though ... even if you accept BP's model, you only get 3% of the global temperature increase coming from UHI.
    0 0
  24. I should also point out the UHI is affected by wind speed. I can think of well-sited stations where the prevailing wind off the sea means that no how big the urban center beside it is, there is no chance for heated air from the city to affect the bulb. BP's assumption for correlating UHI to change in urban size are too naive to be valuable.
    0 0
  25. #8 Ned at 04:13 AM on 1 September, 2010 Are [...] sea-surface temperature trends also affected by UHI? It seems improbable given the lack of pavement in the middle of the Pacific Of course they are not. Therefore where it is measured properly, in spite of the large excursions there is no trend whatsoever in ocean temperatures during the last three decades (probably due to the noticeable lack of pavement there).
    0 0
  26. BP, got a plot of the global sea surface temperatures?.
    0 0
  27. Dappledwater, since BP prefers not to provide it, here's a good figure showing global sea surface temperatures. This is from Kelly O'Day: Source code and data are available via the link. Note the unsurprising similarity to the other surface temperature records.
    0 0
  28. Let's be completely clear about what's happening here. BP proposed a model whereby there is a UHI-sourced bias in global temperature records. He claimed that this bias was large enough to explain much of the observed warming trend, but this claim was based on the unrealistic assumption of uniform population growth everywhere. I used his own model with actual spatially-distributed population growth data, and found that his model actually estimates a global mean UHI bias of around 3% of the observed warming trend. This took a fair amount of work on my part. Rather than acknowledging that inconvenient fact, BP is moving the goalposts around. I'm disappointed, frankly. This is not conducive to productive discussion.
    0 0
  29. I complete only Berényi Péter It is worth to make such a comparison for Africa. He soon joins the population - in particular cities - escape from poverty (shockingly fast - as fast as forests are cut or burn), leading to significant changes in the Earth's albedo and evaporation, the local "dry" glacier - eg Kilimanjaro (Between a logging and fire, Kilimanjaro has lost a third of its forest Since 1929. ) create strong NBL ... - because all this is also UHI ... particularly UI- warm effects. Of course most clearly in Africa.
    0 0
  30. #28 Ned at 22:51 PM on 2 September, 2010 I used his own model with actual spatially-distributed population growth data, and found that his model actually estimates a global mean UHI bias of around 3% of the observed warming trend. This took a fair amount of work on my part. Thanks for your work. However, we are not talking about global temperatures here with no further specification whatsoever, but land surface temperatures as they are measured by stations included in the GHCN (Global Historical Climatology Network) and about the bias the UHI effect may introduce into that dataset. Therefore your 3% is irrelevant. Anyway, the SEDAC/GPWv3 gridded population density dataset is really useful. Thank you for the pointer, I have not known about its existence. At least using that dataset some light could be shed on an old mystery. As all we know, the majority of GHCN stations were abandoned between 1990 and 2000, at least those outside the US of A. For USHCN (US Historical Climatology Network) this mass extinction process took somewhat longer, it was only completed by April, 2006. As SEDAC for some unknown reason fails to provide the datasets in plain ASCII beyond 2000 and I would rather not toil and moil with arcane binary formats, I have considered the decade between 1990 and 2000 and only GHCN stations outside the USA, because I was interested in the station drop out issue. There are 1152 such stations worldwide that provided some data both in 1990 and 2000. Let's call them "stable". On the other hand there are 1760 such stations that quit some time between these two dates, these are the "abandoned" ones. Now, average difference of base 2 logarithmic population densities around stable stations is 0.218, while the same figure for abandoned ones is 0.057. In other words annual population growth rate around stable stations is 1.52% (well above world average) while it is 0.39% around abandoned ones. This selection bias alone adds several tenths of a degree to the warming trend on a century scale. So station drop out could have some effect after all, contrary to what people claim. There is a wealth of information in this GHCNv2/GPWv3 pair, and the result above is only a preliminary one, needing further, more careful study. But now there is hope to be able to answer a lot of interesting questions. I wonder if there are some peer reviewed papers as well on GHCN quality checks using this dataset. Pointers are welcome.
    0 0
  31. Berényi Péter writes: Thanks for your work. However, we are not talking about global temperatures here with no further specification whatsoever, but land surface temperatures as they are measured by stations included in the GHCN (Global Historical Climatology Network) and about the bias the UHI effect may introduce into that dataset. Therefore your 3% is irrelevant. Well, I can only respond to what you actually write. In your first comment in this thread, you claimed about 0.4-0.6°C of the global trend is due to UHI. If we ignore the 71% of the world that is ocean, and apply the "Berényi Method" model with spatially distributed population growth, the estimated mean bias from UHI over land areas only would be +0.16 to +0.24 C/century. For comparison, over the same period, the mean of various land-only temperature reconstructions is +2.8 C/century.[1] Thus, over land, the "Berényi Method" suggests that UHI would be responsible for somewhere between 6% and 9% of the observed warming trend. ----------- [1] Based on averaging the trends from 1990-2009 annual land-only temperature reconstructions by CRU, NOAA, Jeff Id/RomanM, Zeke Hausfather, Joseph at Residual Analysis, Nick Stokes, and Chad Herman. The GISSTEMP "land stations" temperature record is not a true "land only" reconstruction.
    0 0
  32. Let's address the other point. In the second half of his comment, BP writes: Now, average difference of base 2 logarithmic population densities around stable stations is 0.218, while the same figure for abandoned ones is 0.057. In other words annual population growth rate around stable stations is 1.52% (well above world average) while it is 0.39% around abandoned ones. This selection bias alone adds several tenths of a degree to the warming trend on a century scale. So station drop out could have some effect after all, contrary to what people claim. Once again you're naively averaging stations without taking into account spatial autocorrelation or applying any kind of spatial weighting method. This is a completely invalid analytical method, as I've shown before. From that other thread:
    So ... a naive nonspatial analysis of these data give an erroneous "cooling" of -0.05C/decade. A spatially weighted analysis gives a warming of +0.18C/decade.
    This is why people use gridding, kriging, or other geostatistical tools for analysis of irregularly spaced sample data.
    0 0
  33. More followup to friend BP, who writes: Anyway, the SEDAC/GPWv3 gridded population density dataset is really useful. Thank you for the pointer, I have not known about its existence. You're welcome. I agree that it is useful, although not without its shortcomings (there are some apparent artifacts in places). In particular, it probably isn't that great a match for the GHCN stations, due both to the coarse resolution of the GPW data set (in many places the population density estimates seem to be based on averages over particular local administrative units, rather than being grid-cell specific) and due to the poor quality of the GHCN metadata (station lat/lon coordinates may be off by enough to put the station in the wrong grid cell). I think Ron Broberg has looked into this a bit -- see his post GHCN metadata: Horseshoes and Hand Grenades? Also, supposedly GHCN Version 3 is coming out this year ... so you might not want to expend too much effort exploring the nuts and bolts of Version 2.
    0 0
  34. I have selected 270 GHCN stations worldwide with a reasonably uniform distribution over land in such a way, that all of them had almost complete coverage of the years between 1990 and 2000. Then I have computed base 2 log population density difference of that decade for each station along with temperature trend at that location. The stations are divided into three classes according to population density around them in 1990: dense: more than 15/km2 medium: between 0.8/km2 and 15/km2 sparse: below 0.8/km2 (but at least 0.01/km2) As you can see the scatter plot is not very different for these categories. Therefore, if there is a dependence of UHI on local population density, it extends well below 1/km2 indeed with no breakdown of the relation in sight. But the most important finding is that there is a (not very strong) correlation between these two parameters, so a regression line can be computed. Average temperature trend for these stations was about 0.32°C/decade between 1990 and 2000. But part of this increase is due to the 0.2 increase in base 2 logarithmic population density during this timespan, so we have to consider the regression line at zero. It is about 0.15°C/decade there. So more than 50% of the trend is due to increase in local population density around GHCN stations (most of the rest is probably NH soot pollution over snow and ice). This effect is also known as UHI (Urban Heat Island), although as we have seen it has not much to do with urbanization as such, it's just the local effect of increasing population density, even in very sparsely populated areas. I think this is the proper way to look for an UHI effect in land surface temperature records. That is, one should analyze the connection between changes in local population density around measurement points and surface temperature trend at the same location. I am afraid it is not done (yet) by those, who are responsible for maintaining these datasets, although by now many thousand billion dollar political and business decisions are dependent on their correctness (or its lack thereof). Also, I can see the problems with the GPWv3 dataset. Perhaps satellite shots of night light distribution is a better proxy for UHI than population density trends averaged over administrative districts.
    0 0
  35. Nice, BP. Of course, I have a lot of reservations and concerns about your analysis, starting with the question of how representative the data are. You've narrowed the GHCN list down to a fraction of the list, and the time period to a single decade. That's going to make your analysis quite noisy, I would expect. And in fact, the mean trend you find (3.2C/century) before you apply your population correction is quite a bit warmer than most of the land-only reconstructions for that same decade (1990-2000). The seven I looked at averaged 2.25C/century for the same period. So there are two possibilities -- either your station sample is unrepresentative, or your process does not provide a good estimate of the final impact of UHI on the gridded (or otherwise spatially weighted) land temperature reconstructions that other people are doing. If we assume that your subset of stations is representative, and the actual 1990-2000 land trend (after correction for UHI) really is 1.5C/century as you report, this would reduce the global (land/ocean) trend over the same period by about 12% ... from 1.87C/century to 1.65C/century. Given the various weaknesses in your analysis, I think this 12% is probably an overestimate for the effect of UHI on the global trend. I don't know whether it's as low as the 3% calculated above, but I would be very surprised if it's as high as 10%. Oh, yes ... I probably agree with BP's comment here: Perhaps satellite shots of night light distribution is a better proxy for UHI than population density trends averaged over administrative districts.
    0 0
  36. BP #34 Actually your analysis is worthless until you report the statistical significance of your regression model. What's the value of its F statistic (does it predict better than change)? What's the value and statistical significance of the correlation coefficient (i.e. is the slope significantly different from zero)? Until you report these key parameters, it's not actually possible to determine whether your model is any use at all.
    0 0
  37. #34 kdkd at 00:20 AM on 4 September, 2010 Yes, pretty good job description. It's just not my job. In fact I am surprised it is not done already, because it is the only reasonable way to quantify temporal UHI effect on surface temperatures. Comparing trends for "urban" and "rural" sites is worthless.
    0 0
  38. Berényi Péter, there are a number of lines of reasoning that suggest that the eventual "downstream" impact of UHI on global temperature trends is pretty small. Given that, it's hardly surprising that most scientists who hold that view haven't focused on trying to quantify this effect better. There are plenty of problems worthy of investigation in science. What seems interesting and important to you won't necessarily seem equally interesting and important to others. But that doesn't address KDKD's question! Given that you have done a regression analysis that seemed convincing enough to be worth writing about here, what was the statistical significance of the model? You did the regression; I assume you must have the numbers for F-test, 95% CIs, things like that. Is your model relating population density and warming trend significant? You say the correlation between the two is "not very strong" ... can you be a little more informative than that?
    0 0
  39. BP: Since Dr. Hanson has shown here that the warming trend in the rural stations and at very dark stations is the same as at stations that have large urban developments, how can you claim that you have something worthwhile? You have cited a blog post on WUWT as your primary source. You claim your correlation is "not very strong" without saying what the correlation is. You have not said anything that Dr. Hanson has not already shown in a peer reviewed study is wrong. "I think" is no better than "I doubt it" if you have no supporting data. Your claim that one person moving into a 10 km2 area would raise temperatures significantly is completely unbelievable without solid data. Extraordinary claims require extraordinary proof. You have "not very strong" so far. That doesn't make the grade.
    0 0
  40. Thanks for the link, Michael. I agree that it's important to know how significant BP's regression model is. However, it's also very important to know how representative BP's set of stations is. As I noted above, his stations show a much larger warming than other people's reconstructions using station data over the same decade. That bias seems like an indication that his stations aren't necessarily representative of the actual land surface record. That wouldn't be as big a concern if he were using gridding, kriging, or some other method to compensate for the irregular distribution of stations. As we recently saw in another case, the "cooling" he reported after just averaging a bunch of met stations in Canada turned out to actually be "warming faster than the world as a whole" once the spatial autocorrelation in his data was taken into account. If the F-statistic indicates very low significance for his model, then it's probably not worth bothering about anything further. (And in fact, my purely uninformed guess is the model is not at all significant.) But if the model seems prima facie strong, I'd like to see a map of the stations used, or a table of their coordinates, or something like that.
    0 0
  41. #39 michael sweet at 05:47 AM on 4 September, 2010 Since Dr. Hanson has shown here that the warming trend in the rural stations and at very dark stations is the same as at stations that have large urban developments, how can you claim that you have something worthwhile? For once try to think please. Let's suppose (an alternate) Earth had a fairly stable climate with no average surface temperature trend whatsoever. Still, Urban Heat Islands would exist even there. Whenever you drive from the countryside to a city center, you can easily measure a several centigrade increase in air temperature. You can also measure a logarithmic dependence of this UHI effect on city size without referring to history. The only thing you have to do is to visit as many cities as you like multiple times and register temperature differences between centers and surroundings. An order of magnitude estimate of the effect is something like 0.2°C per doubling of city size. As the climate here is not changing, if the population of the same city grows in time, you'd expect the same temperature increase, that is a trend of about 0.2°C per doubling, right? Now, let's suppose population of this alternate Earth is increasing steadily with a fix doubling time of 55 years. Growth rate in different cities may be different, but the average rate would be the same as the global one. Therefore urban weather stations would measure a 0.36°C/century warming trend. Now let's suppose a scientist in this world, call him Dr. James E. Hansen for the sake of convenience, discovers the very same average temperature trend is measured even at rural stations, where local population density is extremely low. I have already mentioned climate is stable in this Earth, therefore in reality surface temperature trend is zero. Still, a global surface warming trend of 0.36°C/century is measured. How can we resolve this paradox?
    0 0
  42. BP #37 That's a cop out par excellence. If you do a regression model (which you have) then you can not demonstrate its statistical significance without presenting the results of the F test, to show whether it predicts better than chance or not. Seeing as it's a univariate regression you might as well do the statistical significance of the correlation coefficient as well, to show if r is significantly different from zero. If you're not prepared to do an essential part of the job, then don't make the claims.
    0 0
  43. Sorry, BP, that's not good enough. What are the statistics for the model? How confident are we that the data you used are actually representative (given that they apparently showed a rather different trend than the actual land surface temperature records)? I'm sure your handwaving argument in your later comment is convincing to you, but that doesn't mean it's going to convince anyone else. That line of reasoning is built on one hidden assumption after another. We can talk about those assumptions, but let's first answer the questions about your regression model.
    0 0
  44. BP: Since you claim that the UHI is proportional to population, the temperature trends in rural areas in the US where population has declined should show a decline in temperature. Many rural areas in the US have population declines over the past thirty years. Show three that show declines in their temperature trends. Urban and rural stations show the SAME trend in temperature increase. This shows that the temperature is increasing. Your claim for a logarithmic increase for population change made without any mechanism or data is simply an unsupported claim. You need to get some valid data or stop wasting our time. Your claims have become more and more shrill recently, while your data has declined in quality. Consider if you want to continue on this path.
    0 0
  45. BP #37 Actually I've revised my opinion somewhat here. Your failure to do the basic statistical tests to assess the validity of your regression is either an example of incompetence (i.e. you don't know how to do it and you won't admit it), or that you are afraid that doing the correct tests will show that your model is not valid (or that you have done this, and do not want to show the results), in which case it's not an example of incompetence, but of scientific fraud. Strong words, and I know that superficially it seems counter to the site's comments policy. However, this is in response to a clearly inadequate analysis of data presented on this site. BP's only options are to allow these charges to go unchallenged and thus demonstrate that one of the above is true, do the F test and correlation test himself and publish it here, and/or to release his raw data to allow someone who knows how to do it to do it for him.
    0 0
  46. I wouldn't read too much into a lack of response, kdkd. People go away on vacations, or they get busy and don't have time to follow up. There have definitely been times when I've posted things here but been too busy to follow the site for a week or so afterwards -- if people had posed a bunch of challenging questions to me they would have mostly gone unanswered.
    0 0
  47. uh, i'm no scientist, but if you have a world full of "urban heat islands", wouldn't that in itself warm the earth?
    0 0
  48. david: The urban areas of the world only add up to a few percent of the earths surface. Farms, forest, wiild areas and ocean account the bulk of the surface. Careful measurement of urban effects show the effects of UHI are very small.
    0 0
  49. michael sweet, -you're probably right. was just wondering, and where can i find some data on this particular subject (UHI)?
    0 0
    Moderator Response: One relevant post you can find by typing "It's Waste Heat" into the Search field at the top left of this page.
  50. Well as is usually the case, the IPCC WG1 has a good index to the data and literature. Overall though it appears that land use change is (eg forest to farm) increases albedo though urbanization with it asphalt surfaces obviously increases it locally. Some discussion
    0 0

1  2  Next

You need to be logged in to post a comment. Login via the left margin or if you're new, register here.


The Consensus Project Website

THE ESCALATOR

(free to republish)


© Copyright 2024 John Cook
Home | Translations | About Us | Privacy | Contact Us