


 Arguments


Recent Comments
Prev 2225 2226 2227 2228 2229 2230 2231 2232 2233 2234 2235 2236 2237 2238 2239 2240 Next
Comments 111601 to 111650:
-
Ned at 19:58 PM on 26 August 2010Warming causes CO2 rise
johnd writes: The magnitude of the nett increase of CO2 being about half of the estimated total emissions from fossil fuels, is very small against both the emissions and the sinks that occur naturally, so a very small error in the estimations and modeling of those natural processes could lead to the wrong conclusions being drawn. Think about this logically for a second. We know with a great deal of confidence how much carbon we're emitting. We also know with a great deal of confidence the magnitude of the increase in atmospheric CO2 over time. By subtracting the former from the latter, we can determine the net effect of all natural sinks and sources with a similarly high level of confidence. Let's say you look at your bank account. You've got various sources of income and expenses. You don't necessarily keep detailed track of them all. However, you do know two things: (1) You've recently added a new and highly quantifiable monthly expense (perhaps payments on a car you couldn't really afford). You know that every month X dollars are being taken out of your account to pay for this new expense. (2) Your monthly statement shows you that, over time, the bottom line on your account is dropping by X/2. At this point, you don't need to sit down and look at every ATM receipt. It's straightforward to conclude that, first, the decline in your account balance is due to the new car payments, and second, if this goes on long enough you'll be in trouble. Of course, it's always helpful to understand your budget in more detail, and the same applies to the Earth system! But uncertainty about some of the details doesn't prevent us from drawing conclusions about the things we do know. -
Rob Painting at 19:44 PM on 26 August 2010Climate Models: Learning From History Rather Than Repeating It
Your graph doesn't look right Argus. Where's it from?. This graph however, is an update to Church & White 2006 A 20th century acceleration in global sea-level rise
-
Ned at 19:37 PM on 26 August 2010Greenhouse effect has been falsified
I'm glad to see people talking about simple experiments that attempt to illustrate the infrared absorptance of CO2. But there are two larger points in danger of being neglected here: (1) There is a very extensive literature on laboratory measurements of the spectral properties of CO2. (2) It's not really possible to completely replicate the real-world greenhouse effect in the lab. Part of the physical process involves an increase in the effective radiating height of the earth's atmosphere, something most labs aren't really set up to simulate. But there are many scientific processes that are similarly unsuited for laboratory replication -- plate tectonics is a great example. The fact that we're logistically incapable of recreating plate tectonics in a laboratory doesn't in any way invalidate it as a scientific theory. Like plate tectonics, we're able to make predictions based on the theories involved in anthropogenic global warming, and verify those predictions using observations. Some of those observations can be made under controlled conditions in the lab, but others can only be done in the real world environment. That's perfectly OK. -
Rob Painting at 19:25 PM on 26 August 2010Arctic sea ice... take 2
HR, Polyakov has an interesting take on the Arctic, including this from his 2002 paper: " Extending our SAT time series by 25 years back to 1875 (years associated with an extended and cold negative LFO (phase) leads to a two-fold increase of the arctic trend compared with the Northern Hemispheric trend (Table 1,Figure 3). While this appears consistent with polar amplification, we believe it is more appropriately described as a statistical artefact resulting from biased sampling of the LFO." "In an analysis of long-term air temperature changes Vinnikov et al. [1980] used gridded northern-hemispheric SAT for 1891–1978, the first half of which was dominated by the negative, cold LFO phase prior to the 1920s, and the second by the positive, warm LFO phase of the 1930–40s. Averaging these data within zonal bands they also found a two-fold polar amplification of SAT trends (Table 1)." Of course much has happened in the Arctic since 2002. -
Argus at 19:22 PM on 26 August 2010Climate Models: Learning From History Rather Than Repeating It
I wonder why graphs showing sea level rise, on this site, always start in the latter half of the 20th century. If you start with a year about 100 years earlier, apparently you get a different picture: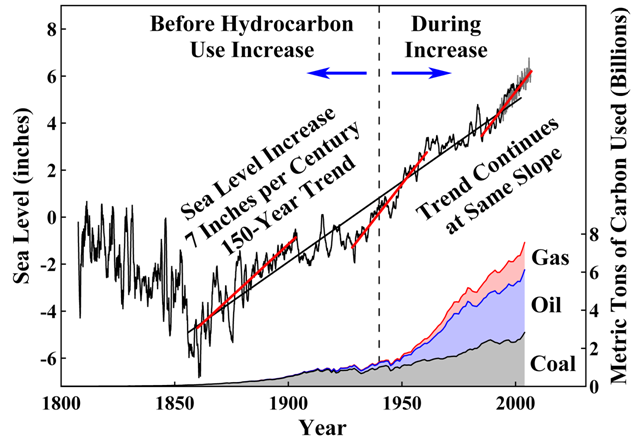 If this graph is right, the sea level started to rise at a steady pace almost 100 years "too early". That is, long before the use of hydrocarbons started to explode around the middle of the 1900's.
So, maybe the proposed reason for the sea level increase (i. e. CO2) is debatable?
If this graph is right, the sea level started to rise at a steady pace almost 100 years "too early". That is, long before the use of hydrocarbons started to explode around the middle of the 1900's.
So, maybe the proposed reason for the sea level increase (i. e. CO2) is debatable?
-
Ned at 19:19 PM on 26 August 2010Greenhouse effect has been falsified
Will writes: Thermal radiation is heat. Vibrating matter. Gas molecules are vibrating matter. They cannot pass through solid glass. You are confusing matter with energy. It is the energy which passes through the glass not the vibrating molecules which cause heat. In the vacuum of space full spectrum EMR produces no thermal radiation, heat. This is just absolute rubbish. Sorry, but there's no better way to put it. Thermal infrared radiation is merely a subset of the electromagnetic spectrum at wavelengths from around 3 to 1000 micrometers. The label "thermal" comes from the fact that this is the range in which the peak emittance occurs from objects at normal earth-surface temperatures. This is important because thermal infrared radiation is the only significant mechanism by which the Earth loses heat to space. If your claims were correct and longwave infrared radiation were unable to propagate through a vacuum, the Earth would rapidly heat up to the point where the oceans boiled away. Your willingness to write articles dismissing the greenhouse effect and accusing scientists of "fraud" when you don't understand even the most basic relevant physics is frankly shocking. It's far and away the best demonstration of the Dunning-Kruger Effect that I've seen in a long time. -
Ned at 19:00 PM on 26 August 2010Greenhouse effect has been falsified
Berényi Péter, in your comments about Venus, I think you may be neglecting Venus's albedo. -
HumanityRules at 15:59 PM on 26 August 2010Arctic sea ice... take 2
http://www.gi.alaska.edu/~bhatt/publications/polyakovetal_2010.pdf A more upto date paper about trends versus natural ossilations in the north atlantic. The indroduction is worth reading just to get the sense of how the author seems to think there is still much to argue for on the subject. -
John Chapman at 15:21 PM on 26 August 2010Climate Models: Learning From History Rather Than Repeating It
Now I've done some internetting and found the answer I was after. The tide gauges are a pipe which has a small hole at the bottom which acts as a capacitor and smooths out the short term fluctuations from waves. Readings are taken every 6 mins. Where were we ... oh yes predictions. -
Tom Dayton at 15:08 PM on 26 August 2010Station drop-off: How many thermometers do you need to take a temperature?
daisym, I'm glad we were helpful. ARGO measures ocean, not air, temperature. There is an excellent site put up by the Argo project. To answer your question specifically, look at the section How Argo Floats Work. There is an excellent video animation at the Argo home page; click on the little picture at the bottom of the section "Why do we need Argo?" A ton of further info at varying levels of technicality are linked at the left side of that Argo home page. -
HumanityRules at 15:07 PM on 26 August 2010Arctic sea ice... take 2
13.Gordon "obsessed" is the wrong word to use but the intention was to show that the recent trend seems to have overtaken the long term variability of the arctic in many peoples minds. And certainly in the discussion of arctic and AGW. I was looking further into this idea and came across the website of Igor Polyakov , an arctic researcher. He seems to have published plenty on the subject and his website has some interesting short, but detailed write-ups. There are some extraordinary lines on the website and in some of his publications such as this. "If long-term trends are accepted as a valid measure of climate change, then the SAT and ice data do not support the proposed polar amplification of global warming. Intrinsic arctic variability obscures long-term changes, limiting our ability to identify complex feedbacks in the arctic climate system." From GRL, VOL. 29, NO. 18, 1878, doi:10.1029/2001GL011111, 2002 I know nothing about this guy except that he doesn't seem to be a perpherial figure in the science. -
Bern at 14:48 PM on 26 August 2010Climate Models: Learning From History Rather Than Repeating It
Further to scaddenp's response re tide measurements - you have similar issues measuring noise levels with a meter. The old-fashioned way was to watch the needle madly wave back and forth, and guesstimate the lower, middle, or upper points. These days, the meters no longer have needles, and *do* take measurements on millisecond timeframes, calculating the averages mathematically. This has led to a few changes in approach over the years, as the old "maximum" level is closer to the 10th percentile of the actual fluctuating values (known as the L10). Similarly, the "minimum" is now measured as the L90, or 90th percentile. But for climate studies, and sea levels in particular, the moment-to-moment variation isn't important, you only care about the average - what we in the noise business call the Leq, or "equivalent continuous level". In the noise case, it's the level with the same acoustic energy (due to logarithmic decibel scales, this isn't the same as the average level). For tides or temperatures, measured on a linear scale, it's just the average over a reasonable timeframe. For tides, you might pick a period of, say, 30 days, to average out a lunar cycle. Temperatures might look at an annual average, to smooth out the seasons - depending on what you're looking for. (sorry for wandering a bit off-topic there... :-P ) -
sailrick at 14:41 PM on 26 August 2010Hansen etal hit a Climate Home Run -- in 1981
factfinder I think perhaps you, like many skeptics, believe that the greenhouse effect is some new fangled idea dreamed up by liberals, like Al Gore. Here is a brief history of the early years. "These are the fundamentals of climate change science, and they are old hat: Fourier calculates colder earth without an atmosphere (1824) Tyndall discovers relationship between CO2 and long-wave radiation (1859) Arrhenius calculates global warming from anthropogenic CO2 (1896) Chamberlin models global carbon exchange including feedbacks (1897) Callendar predicts global warming increase catalysed by CO2 emissions (1938) Revelle predicts inability of oceans to sequester anthropogenic CO2 (1958) (From Spencer Weart's history of ACC - " http://www.aip.org/history/climate/index.htm) -
scaddenp at 13:54 PM on 26 August 2010Climate Models: Learning From History Rather Than Repeating It
Timing of the readings doesnt matter for tide guage. Its the average of the all the readings that counts, because that levels out the waves and lunar cycle. I sure you can find a tide guage near you for example of data. My local can be found at port otago. Of course, going from a change at individual stations to global sea level changes isnt trivial. Satellite altimetry doesnt have a wave or tectonic problem so more reliable when calibrated. Big literature - Stick JA Church into google scholar for starting point, then PL Woodworth for more tide guage orientated stuff. -
daisym at 13:39 PM on 26 August 2010Station drop-off: How many thermometers do you need to take a temperature?
#13, 14 and 15: Thanks for your input. Your points are well taken. Tom, I read the information at the links you provided and must concede that it was compelling. It is unfortunate that construction of the temperature record is such a messy business, and has been so poorly explained to the public. Thanks go to all of you for taking the time to share your knowledge with me. Not being a scientist, I have to get information wherever I can. In this regard, all of you perform a great public service through your discussions among each other on this and similar blogs. I have one final question for anyone with the answer: Do the ARGOS buoys measure temperature of the atmosphere at the surface, and (if so) are these measurements included in calculations of the average global atmospheric temperature? I know that satellite and radiosonde measurements are used, but I've not read where buoy measurements are also used. Once again, thanks. -
gallopingcamel at 13:35 PM on 26 August 2010Medieval Warm Period: rhetoric vs science
chris (#33), Scientists publish their ideas and the best way for their results to be assessed is for other people to reproduce their work independently. Steve McIntyre applied this test to Moberg's and Loehle's analysis and found fault with both. Here are McIntyre's reconstructions: http://climateaudit.files.wordpress.com/2007/11/moberg23.gif McIntyre commented: "The difference between Moberg’s results (in which the modern warm period was a knife-edge warmer than medieval) and these results rests entirely with proxy selection. The 11 series in the Moberg low-freq network are increased to 18, primarily through the addition of ocean SST reconstructions...." -
Gordon1368 at 13:30 PM on 26 August 2010Arctic sea ice... take 2
12. HumanityRules Thanks for your response. We'll see very clearly within a few years who's right about arctic ice volume. It will be interesting. I don't think people are 'obsessed' with this trend. Using the term slights people who disagree with you, implying they are not critical thinkers. The stakes are high, and therefore intense interest is justified. No one is unaware of past variability in arctic ice and weather conditions. People are not blindly extrapolating this trend indefinitely. Offhand, I can't think of any trend I've seen that continues indefinitely. Certainly, if the PIOMAS graph above is accurate, it will go horizontal in the not too distant future. Flatlining, so to speak. Let's hope the trend reverses before that. I'm all for that, I just see no sign of it now. -
John Chapman at 13:30 PM on 26 August 2010Climate Models: Learning From History Rather Than Repeating It
Thanks for the volcano info. Bath analogy doesn't help. Are the readings (tidal guages) taken every millisecond and then averaged and what of the satellite measurements with those big ocean waves? Academic question a bit off topic which is about predictions. -
Tom Dayton at 13:04 PM on 26 August 2010Greenhouse effect has been falsified
In addition to that video linked by Dappledwater, there are many more successful such experiments, Will. Look at the sample at the right side of the YouTube page after you click on Dappledwater's link. Here's an example of a child's experiment: -
scaddenp at 12:53 PM on 26 August 2010Climate Models: Learning From History Rather Than Repeating It
May be worth mentioning that in some climate models at least (if not all), the FIRST test is ensure that if there are no forcings, then there is no trend - ie all the cycles will be there but no trend of 30 years. John, an average can be very stable and measured with high precision even if individual reading are highly variable. Make some waves in a bath (but dont slop water out of it). You level readings will around the bath will be changing madly but the amount of water in the bath isnt so average will be stable. My understanding is that Eyjafjallajökull effects will be small - it small compared to Pinatuba and in the wrong place to have much effect. (A tropical volcano powerful enough to eject sulphur into the stratosphere is a climatic event). -
Rob Painting at 12:49 PM on 26 August 2010Climate Models: Learning From History Rather Than Repeating It
John, the impact of the Iceland volcano is limited by it's location, not only the size of the eruption. Were it situated closer to the equator, and of sufficient size, it's emissions would be taken up by the tropical circulations, originating at the equator, and distributed around the globe. -
Rob Painting at 12:39 PM on 26 August 2010Greenhouse effect has been falsified
Will @23 - "At my site you find direct reproducible experimental evidence that pure CO2 causes less warming than ordinary air." Interesting, this experiment indicates otherwise -
John Chapman at 12:15 PM on 26 August 2010Climate Models: Learning From History Rather Than Repeating It
I wonder what the modelling and real effect of the icelandic volcano will be? Was it grand enough to reduce the temp rise and will it give fodder to the 'skeptics' that the planet isn't warming? On the subject of tides, I'm curious to know how a value is assigned with an accuracy of a few mm to a water level that is fluctuating wildly by a few cm every second and a few metres every 6 hrs. Maybe someone can enlighten me? (I probably can find the answer instantly with google and I shouldn't be wasting readers' time and this valuable space!) -
scaddenp at 11:29 AM on 26 August 2010Greenhouse effect has been falsified
Hmm. So we have expensive experimental setups for quantifying greenhouse response of various gases to high degree of precision being invalidated by backyard experiement with cheap thermometers. I dont think so. I think this is a common experiment but the setup is difficult so you get "prove" or "disprove" greenhouse gas theory from physical processes that dont actually have anything to do with it. I prefer this setup for eliminating other possible effects. -
muoncounter at 11:25 AM on 26 August 2010Warming causes CO2 rise
#6:"It has been given some value solely because it happens to match somewhat with global temperatures" What? Given some value? There are multiple agencies responsible for these measurements; they all seem to agree. And please, do not say "Conspiracy!" "magnitude of the nett increase of CO2 being about half of the estimated total emissions from fossil fuels, is very small against both the emissions and the sinks that occur naturally," Well, no. You can take the world annual CO2 emissions from all fossil fuels (EIA.gov is a good place for such statistics) and match it to the annual increase in atmospheric CO2 pretty well. All you need do is convert Gtons CO2 at the surface to ppmV distributed in the atmosphere; there are several places that give that conversion. Then calculate that 39 Gtons CO2 (2009) is about 4ppmV during a year when CO2 went up by 2 ppmV; that means that half of anthropogenic (yes, that bad word) CO2 is absorbed by all sinks and the other half is still out there. I posted a graphic a couple of weeks ago demonstrating this on some prior thread; I'll have to go looking for it. -
dsleaton at 10:50 AM on 26 August 2010Greenhouse effect has been falsified
I suggest a new way of trying to start a learning dialogue with Will. Assume he is right in the findings of his backyard experiment. What, then, happens to our scientific understanding and the engineering that has been developed from that science? What do we have to unlearn about the universe due to Will's discoveries? Will, you seem very invested, psychologically, in your experiments. I wonder if you are capable of accepting constructive criticism. If not, then you are incapable of actual dialogue, and it would be worthless for anyone here to continue to engage with you. A number of posters have challenged your understanding of physics, and they have presented research that has been done with much greater rigor and care than has yours, yet you reject their findings out of hand. And then you expect them to accept your findings without question. -
HumanityRules at 10:40 AM on 26 August 2010Arctic sea ice... take 2
10.Gordon What I'm saying is that for the past two seasons the PIOMAS model has under-estimated the extent. In 2008 it estimated extent would be lower than 2007. This year it has a fairly low estimate of extent which looks like again being an under-estimate. There are some actual measurements of ice thickness. Here's one that's fairly easy to follow (http://epic.awi.de/Publications/Haa2010b.pdf). It's conclusion is that in 2009 there was very little difference in ice thickness compared to 2007. This is the first line from their conclusion "We conclude that older sea ice in much of the Arctic Ocean was of similar or even slightly larger thickness in April 2009 relative to conditions in 2007, but within the expected range of interannual variability." You might argue that this covers only a small fraction of the arctic but unfortunately this is probably as good as it gets. If ice thickness is roughly the same, maybe slightly higher and if the extent and concentration are both greater than 2007 then where does the recent dramatic fall seen by POIMAS come from? The PIOMAS authors in a 2008 paper highlight the fact that the 2007 conditions are weighing heavily on their 2008 predictions, my guess is it is still doing so. I think that this is an over-estimation of the influence that 2007 ice conditions is having on model outputs moving forward. I do think in general the past decade or two have shown a decline in arctic sea ice. It's worth concidering though how long this obsession with trend has been going on. The arctic ice and weather conditions have long been known to have high levels of natural variability. Comment on the arctic seems to blind itself from this variability to focus wholy on the recent downward trend, which is extrapolated forward indefinately as you seem to do. I think it's worth considering the recent conditions in relation to those long term natural variations. -
ProfMandia at 10:35 AM on 26 August 2010Arctic sea ice... take 2
See the article about John Cook at The Guardian. BTW, do not ask people there to donate to John's site because your comment will be removed. I wonder how I know this....? :) -
Berényi Péter at 09:23 AM on 26 August 2010Greenhouse effect has been falsified
#34 Will at 06:50 AM on 26 August, 2010 Even in direct sunlight the top canopy of leaves on any plants will be much cooler than bare earth That's true. Not because they reflect much light, but because of evaporation of water through pores on the back of leaves called stomata. If this vapor laden air rose high enough, it would cool by adiabatic expansion releasing the latent heat eventually by phase transition, producing rain and (relatively) hot dry air which leaves the cloud and radiates this heat into space. Cooling itself this way it sinks again, ready to take up some more moisture.
GHGs are very important ingredients in this process, for due to Kirchhoff's law of thermal radiation in local thermodynamic equilibrium (which holds up tu 50 km in the atmosphere) emissivity of stuff is the same as its absorptivity. That is, if a gas does not absorb thermal radiation (like nitrogen) it can't get rid of heat by radiation either.
If this vapor laden air rose high enough, it would cool by adiabatic expansion releasing the latent heat eventually by phase transition, producing rain and (relatively) hot dry air which leaves the cloud and radiates this heat into space. Cooling itself this way it sinks again, ready to take up some more moisture.
GHGs are very important ingredients in this process, for due to Kirchhoff's law of thermal radiation in local thermodynamic equilibrium (which holds up tu 50 km in the atmosphere) emissivity of stuff is the same as its absorptivity. That is, if a gas does not absorb thermal radiation (like nitrogen) it can't get rid of heat by radiation either.
-
johnd at 09:17 AM on 26 August 2010Warming causes CO2 rise
3 to 5 above, whilst the Mauna Loa CO2 indicates a consistent nett change both seasonally and long term for what occurs in both hemispheres, it provides no understanding of any of the processes that determine those nett variations. It has been given some value solely because it happens to match somewhat with global temperatures, but even there it didn't do so well with the cooling period from about 1960 diverging from the constant upward trend. The magnitude of the nett increase of CO2 being about half of the estimated total emissions from fossil fuels, is very small against both the emissions and the sinks that occur naturally, so a very small error in the estimations and modeling of those natural processes could lead to the wrong conclusions being drawn. The study I referred to earlier that measured how the CO2 varied not only in different regions, but seasonally shows that natural processes are able to reduce CO2 concentrations in the atmosphere by a factor about 10 times the rate that fossil fuels add CO2 to it, therefore the capacity is there within the natural system when the conditions are right. Whilst we might be able to make estimations and construct models that approximate what the nett results appear to be, that is far from being able to lay claim that each and every one of those processes is understood sufficiently to be sure that the values shown in the chart below and measured in hundreds are accurate to small single digit figures.
-
Berényi Péter at 08:43 AM on 26 August 2010Greenhouse effect has been falsified
#30 KR at 05:50 AM on 26 August, 2010 your half/double N2 comment really represents a red herring with respect to a conversation on the greenhouse effect. Not really. For example World Book at NASA - Venus has the following "explanation": "Most astronomers believe that Venus's high surface temperature can be explained by what is known as the greenhouse effect". Surface temperature on Venus is about 458°C and if an astronomer believes it is so high because of the greenhouse effect, he is not an astronomer at all, but a crackpot. It is a shame National Aeronautics and Space Administration of the US disseminates such nonsense. At the 1 atm level temperature of Venus is only 71°C, that is, 387°C cooler than at the surface. If you'd put the Earth at the same orbit, its average surface temperature would go as high as 66°C. The difference is only 5°C, that could be called the additional greenhouse effect due to an atmosphere almost entirely made of CO2 and covered by clouds of sulfuric acid droplets above haze of the same stuff. You get it for doubling the amount of CO2 almost 11 times relative to Earth. The rest is pressure (92 bar at the surface), this is what makes Venus so hot, not the "greenhouse effect". -
David Horton at 08:09 AM on 26 August 2010Medieval Warm Period: rhetoric vs science
Toby #34 - excellent summary. I think you are giving the deniers too much credit though. They seem to believe that greenland had no ice on it 500 years ago and this is why it was called Greenland and there were Vikings all over it growing crops and then the LIA came and wiped them out. So we don't need to worry about current warming. There is no sense, in any denier comment I have ever seen, that the Viking colonies were restricted to little coastal enclaves for a small number of people and that the rest of Greenland, then as now, was covered with the immensely thick and immensely old ice sheet. -
Phil at 07:41 AM on 26 August 2010Greenhouse effect has been falsified
Just to expand a bit more on my previous post. Molecules absorb EM radiation (sometimes loosely called "light" by lazy people like me - gulp!) by three mechanisms 1. Changes to Rotational Quantum states - in the microwave and low infra-red EM region. Molecules need a permanent dipole moment to absorb radiation. (N2 for example cannot, neither can CO2) 2. Changes to Vibration (of the nuclei against each other) - in the infra-red region. The vibration needs to change the dipole moment to absorb radiation (The one vibration in N2 cannot, 3 of the 4 vibrations in CO2 can) 3. Changes to Electron orbits - in visible and UV EM region. Again a change in dipole moment is required for absorption. This will depend on the lower and upper orbit, some N2 transitions will be allowed, and these occur in the UV region -
Will at 07:36 AM on 26 August 2010Greenhouse effect has been falsified
KR You are wrong, I have conducted these experiments on multiple surfaces. The CO2 bottle contains almost pure CO2. Enough to extinguish a burning match, see here: spinonthat.com/CO2.html At the end of the last video at the bottom of the page I demonstrate how much CO2 with a burning match. Still I am impressed at how you can convince yourself of almost anything based on pure guess work. Well done to you! -
Phil at 07:22 AM on 26 August 2010Greenhouse effect has been falsified
Will #36 Read it again; the first sentence refers to molecular vibrations, and visible radiation, the second to electronic absorbtion and UV (i.e non-visble) radiation. No contradiction -
Will at 07:19 AM on 26 August 2010Greenhouse effect has been falsified
Tom I should have said "caused by" vibrating matter are you happy now? The point I am making is that Ned is wrong about glass being opaque to thermal radiation because if it were, why would we need double glazing with reflective coatings? -
Greenhouse effect has been falsified
Will - in your experiment you lack the black cardboard representing the Earth. Therefore you don't have the visible light changing to IR and attempting to leave back through the air or CO2, hence your experiment isn't set up correctly, and hence your results aren't going to show anything. I'm also not certain you're going to have sufficient CO2 in your quite small sample from soda water fizz; I would try it with an empty soda bottle full of air, and another where you fill it with CO2, either from a tank or using a piece of dry ice (vented until the ice sublimates, to keep pressure the same). Otherwise the effect may be too small to show up on simple (and rather inaccurate) thermometers like the liquid crystal ones you show. -
batsvensson at 07:13 AM on 26 August 2010Can't We At Least Agree That There Is No Consensus?
chris at 01:34 AM on 25 August, 2010 There is a difference in saying: 1) Given what we know then this or that can happen. 2) Given what we know then this or that will happen. When we talk about predictions its important to know which case we are talking about, in particular if we want to connect a scientific consensus to the prediction. -
muoncounter at 07:07 AM on 26 August 2010Greenhouse effect has been falsified
#34: "Above all plants do not warm environments, they cool them" And here in plain English is why: Plants give off water through tiny pores in their leaves, a process called evapotranspiration that cools the plant, just as perspiration cools our bodies. On a hot day, a tree can release tens of gallons of water into the air, acting as a natural air conditioner for its surroundings. And that's why plants cool their surrroundings, which has nothing to do with UHI. But here is why this may be a new problem: "There is no longer any doubt that carbon dioxide decreases evaporative cooling by plants and that this decreased cooling adds to global warming," says Cao. "This effect would cause significant warming even if carbon dioxide were not a greenhouse gas." Its a double-whammy. CO2 traps heat requiring plants to do more evaporative cooling, but CO2 acts to decrease a plant's ability to cool itself. -
Will at 07:03 AM on 26 August 2010Greenhouse effect has been falsified
Tom Why don't you try it for yourself. The point is not to take my word for it. Its a simple test and yes children have done it and achieved the same results as I do. -
Gordon1368 at 07:02 AM on 26 August 2010Arctic sea ice... take 2
HumanityRules, you may be right, however, the graph shows a drastic acceleration in the decrease in ice volume, are you saying it is drastically wrong? If it is even 10% or 20% wrong, the decline is alarming. Furthermore, are you saying the declining trend it shows is wrong? Even if the apparent acceleration in decline in ice volume is exaggerated, that is small consolation, as the straight line itself is quite steep. Even if, as you say, the model is sometimes wrong, it is still very useful to see the problem we are facing. Unless it is always wrong? Is that what you are saying, that it is useless? -
Tom Dayton at 07:00 AM on 26 August 2010Greenhouse effect has been falsified
Will, you are incorrect. Thermal radiation is not vibrating matter, because "radiation" is not vibrating matter, it is instead electromagnetic energy. Use the internet to search for definitions of "thermal radiation." An example is a definition by the University of California San Diego Center for Astrophysics and Space Sciences. -
Will at 06:59 AM on 26 August 2010Greenhouse effect has been falsified
Phil "This is because, as has been explained to you above incoming solar radiation does not match the vibrational frequencies of the IR active vibrations - in visible light is too high a frequency for any molecular vibrations. Electron transitions do occur due to UV light, but the atmosphere is largely transparent to visible light. You have contradicted yourself here. -
Tom Dayton at 06:55 AM on 26 August 2010Greenhouse effect has been falsified
Will, your experiment that you describe on your web site is not novel. Students have been doing similar experiments for years. Maybe there is a flaw in your experimental design, or the effect you created was too small to be detectable by your temperature measuring apparatus. I've got relevant links on this comment. -
Will at 06:50 AM on 26 August 2010Greenhouse effect has been falsified
Ned "Will, glass is transparent to near-infrared wavelengths. It's opaque to thermal infrared wavelengths. See figure 2-3 here for an example." Lets just look at this statement for a minute. Thermal radiation is heat. Vibrating matter. Gas molecules are vibrating matter. They cannot pass through solid glass. You are confusing matter with energy. It is the energy which passes through the glass not the vibrating molecules which cause heat. In the vacuum of space full spectrum EMR produces no thermal radiation, heat. It is you who is confused or rather attempting to confuse. As for your comment about healthy green plants absorbing 90% of visible wavelengths, this is yet another stab in the dark generalisation. Some leaves are highly glossy/reflective and others are completely mat. It depends on the plant. Above all plants do not warm environments, they cool them, as per the urban heat island effect. Even in direct sunlight the top canopy of leaves on any plants will be much cooler than bare earth, and that is my point. So the point is, according to the bottom-up warming "greenhouse effect" hypothesis, an empty greenhouse should be considerably warmer than a full one, as attested to by the urban heat island effect, but this is not the case. With regards to false analogies, try implementing cap and trade without using the words "greenhouse gas emissions". -
Rob Painting at 06:23 AM on 26 August 2010Greenhouse effect has been falsified
Hey Will, still no answer to post #3 & 4. At least the hypotheses put forward by climate scientists match real world observations and measurements. Which is kind of the whole point isn't it?. -
Phil at 06:20 AM on 26 August 2010Greenhouse effect has been falsified
Will, The article on your web site that you've linked to includes serious factual errors. Diffusion of light by the atmosphere does not cause "the molecules also absorb some of that energy from the photon", and does not cause the molecules to vibrate. This is because, as has been explained to you above incoming solar radiation does not match the vibrational frequencies of the IR active vibrations - in visible light is too high a frequency for any molecular vibrations. Electron transitions do occur due to UV light, but the atmosphere is largely transparent to visible light. O2 and N2 are completely inactive to IR radiation, except for the tiny amount of isotopic variation which, as your own graphs show, are 1x10-30 less powerful than CO2 and are the wrong frequency for both incoming solar and outgoing earthlight. You should also be aware that the energy in photons is related to their frequency, not as you seem to assume, their intensity. Or do you really not believe Albert ? You are wrong to say all substances absorb IR radiation: use the search engine of your choice to look for "Dipole Moment" and "Vibration" and take your pick -
muoncounter at 06:12 AM on 26 August 2010Medieval Warm Period: rhetoric vs science
#31: "According to Moberg the MVP anomaly is a "blip" of around 0.2 Kelvin. " No. The data graphed above is straight out of Moberg, which clearly shows the MWP was 0.4 deg above the earlier (0-600 AD) baseline. Why state something that is so blatantly false? -
Ned at 06:10 AM on 26 August 2010Hansen etal hit a Climate Home Run -- in 1981
Thanks, muoncounter... :-) -
Ned at 06:06 AM on 26 August 2010Greenhouse effect has been falsified
Will writes: Please don't "Science of Doom" me. I'm not sure what you mean by that. Science of Doom offers admirably lucid, accurate, and detailed explanations of the physical basis for the greenhouse effect. They also manage to do so in a polite and respectful environment. It's hard to imagine a more appropriate resource for this particular thread.

Prev 2225 2226 2227 2228 2229 2230 2231 2232 2233 2234 2235 2236 2237 2238 2239 2240 Next


