


 Arguments


Recent Comments
Prev 2245 2246 2247 2248 2249 2250 2251 2252 2253 2254 2255 2256 2257 2258 2259 2260 Next
Comments 112601 to 112650:
-
daniel at 11:42 AM on 30 August 2010Sea level rise: the broader picture
Rupert has just wired me the first 50% of our agreed sum and so here we go.... That's nice David, you're right in saying that two poorly defined observations within the space of one lifetime are not enough to really determine anything and thankyou doug for your article that didn't cover our enlightening discussion a couple of months back. You remember the discussion where you tried to discredit me by comparing my lack of credentials against Donnelly's and then claimed that I therefore had nothing to say? You also misunderstood me in quite an amateur fashion and failed to understand the points I was making about the poor quality of work done in understanding paleo sea level rise? You see David what you don't realise is that much of the concern over the current sea level rise is based on comparisons to the past. We can't really say if the current sea level rise (and indeed global temperature, which is supposed to be driving the sea level rise) is unprecedented due to the lack of any really reliable paleo data. I encourage you to look into this yourself and do be careful of the deluded assertions of the true believers who write articles like that above without the competence or desire to critique the work put forward by supposed experts. Peter and others then took over trying to claim that I didn't have any evidence to suggest that there are any real drivers in the not too distant past to reproduce the current levels of SLR. Well that's a discussion I haven't had the time to have with them yet but I can say that i had a quick look a couple of months back and what i found in terms of the quality of paleo temperature records and also their comparison to modern temperatures gave me quite the confident grin. Yours truly David, from someone who actually knows what they're talking about :) Oh and peter, to claim that you are the ultimate authority on what is recognisable statistics or science was an absolute gem :D thanks for the laughs.... -
MattJ at 10:51 AM on 30 August 2010Sea level rise: the broader picture
This is basic version??? It is much too wordy and uses 'high-falutin' words like 'corroborate'. And what is "mutually corroborates" supposed to mean, anyway? It looks like the author thinks that sea-level rise confirms global warming, while at the same time, global warming confirms sea-level rise. But this is metaphysical impossibility (see http://plato.stanford.edu/entries/causation-metaphysics/ under 'Direction'). On a simpler note, am I the only one to notice that "Current sea level rise is after all not exaggerated, in fact the opposite case is more plausible" is a run-on sentence? -
David Horton at 10:40 AM on 30 August 2010Sea level rise: the broader picture
"Don't be mislead by only a carefully-selected portion of the available evidence being disclosed." They mostly don't bother with the graphs Doug. It is enough for the Murdoch media empire to send a middle-aged surfer to, say, Bondi Beach, and have him say that the beach doesn't look any different to what it did when he was a child. Now, that disproves all those silly measurements and graphs doesn't it? Just good common sense from a member of the public - who needs science? It's this kind of stuff that makes me doubtful that these very well-intentioned simple language arguments, as well done as they are, will make any difference to public discourse. Deniers, egged on by Rupert, will keep denying in the face of all and any evidence you throw at them. As can be seen on SS threads as well as elsewhere. -
actually thoughtful at 10:10 AM on 30 August 2010Human CO2: Peddling Myths About The Carbon Cycle
This is how the argument gets (ab)used by deniers 1) 29 gigatons is safely in the margin of error (given our measurement ability) of the natural carbon cycle (771 gigatons) 2)Regarding actions: The US is responsible for 25% of the global human induced CO2 emissions. Official plans call for very minor reductions, but even if you use 20% from a likely baseline, 20% of 25% of 2ppm (annual increase in CO2) is 0.1ppm and virtually unmeasurable. I myself come from the school of thought that says step one is to stop digging - any help for responding to the sophism I outline above? -
Chemware at 09:01 AM on 30 August 2010Human CO2: Peddling Myths About The Carbon Cycle
#7. HumanityRules, 20 million years ago sea level was about 90 m higher, Miller, 1996, and 100 million years ago it was about 145 m higher than it is today Müller 2008. That's what so special: global sea levels are intimately related to CO2 levels. Do you want sea levels like that in the near future ? -
Peter Hogarth at 08:40 AM on 30 August 2010Ocean acidification isn't serious
The first deep basin observations of Aragonite undersaturation in surface waters have already been observed in 2008 in the Arctic (Yamamoto-Kawai 2009), and in 2009 the extent of surface waters with undersaturated aragonite increased, although this is not yet region-wide. This means that these waters crossed the threshold where they are beginning to be corrosive to certain types of calcifying organisms. The trends in the Arctic regions have been a cause for concern for some time (Bates 2009), as the Arctic waters are subjected to the dual effects of decreasing alkalinity due to increasing pCO2 (directly due to uptake of the increasing atmospheric CO2 due to anthropogenic emissions), and increased sea ice meltwater due to increases in regional temperatures which are greater than the average global temperature rise. Models also predicted Aragonite undersaturation in these regions would occur in the near future, but the recent increased rate of ice melt has accelerated the process (eg Steinacher 2009). As both atmospheric CO2 and Arctic sea ice melt rates are on accelerating trends this will have a negative effect on populations of both planktonic and benthic calcifying organisms in the Canada Basin, and potentially over wider areas within a relatively short time span. -
Peter Hogarth at 06:53 AM on 30 August 2010Medieval Warm Period: rhetoric vs science
fydijkstra at 00:37 AM on 24 August, 2010 It seems no-one noticed (or commented) that my light hearted effort here was really a subtle poke at the Loehle methodology? (but with tree rings and 50 proxies) I tried taking the tree ring data out, - not much difference. With the 50 proxies and simple averaging that Loehle used the MWP appears slightly less warm than now. I could however easily cherry pick several proxy data sets and show a slightly warmer MWP... However every indication is that the late 20th Century multi-decadal warming trend will continue. -
rcglinski at 04:43 AM on 30 August 2010Ocean acidification isn't serious
Is there a way to read Pelejero 2010 w/o buying a membership with Science Direct? If not, this page would be improved by a summary of the proxies used and how they were validated. -
Peter Hogarth at 02:44 AM on 30 August 2010Can humans affect global climate?
HumanityRules at 19:51 PM on 29 August, 2010 Significant compared to the 20th century trend? The CET data shows the longer term trends better as there is even more data, which is why I included the CET data as a "sanity check". We also have to factor in the different forcing factors operating at different times, and uncertainties, which are high in the early data, compared with the modern data. Though this will sound a little perverse, a multidecadal slope in the early part of the data may be less statistically significant than a similar slope in the modern data where measurement errors are very small indeed. Anyone pointing to the very early CET temperature variations should bear in mind the Mercury thermometer was invented around 1714, and the Stevenson Screen around 1864. For Armagh, there were some documented 19th century thermometer errors of around 3 degrees Fahrenheit (if memory serves) which was a potential problem when trying to calibrate some of the early data.
-
Wayne Johnston at 02:32 AM on 30 August 2010Human CO2: Peddling Myths About The Carbon Cycle
You have a small typo in the Intermediate summary. The second sentence reads "Therefore human emissions upset the natural balance, rising ...". It should say "raising". -
Robert at 02:27 AM on 30 August 2010Human CO2: Peddling Myths About The Carbon Cycle
"100 million years ago pCO2 was three times it is today. 175 million years ago it was 7 times todays level." I understand why people raise this point, but if you think it through, you'll realize that the fact that a certain condition existed millions of years ago, prior to the entire period of the establishment and development of human civilization, does not mean that that condition isn't extremely dangerous and destructive, and an extreme change from the conditions that have existed for the thousands of years in which human societies have flourished. Suppose, for example, somebody said to you: "Who cares about nuclear war? Many times in the earth's history, we've been struck by giant meteors that exploded with the force of thousands of nuclear bombs. So what if it happens again?" I'm sure you understand my point: the earth has existed for billions of years. Just because something has an analogue somewhere in that history does not mean it is safe to bring it upon ourselves with our own actions. Giant meteor or nuke, you don't want to be standing next to it when it impacts. -
muoncounter at 02:07 AM on 30 August 2010Human CO2: Peddling Myths About The Carbon Cycle
#7: "100 million years ago pCO2 was three times it is today. 175 million years ago it was 7 times todays level." Point being? Don't neglect to mention that there was far more widespread volcanic activity during the Cretaceous than today. And highly variable climate as well. Although I hesitate to reference other blogs, this guy's pretty good with volcanoes. Of course that would suggest that CO2, whether 'natural' or emitted by fossil fuel use, influences climate in a GHG kind of way. So your comment suggest that you've come to accept the 'GHG hypothesis'? -
muoncounter at 01:56 AM on 30 August 2010Hansen etal hit a Climate Home Run -- in 1981
#23: "compared to some naive/null prediction? " The gray bars in Hansen's fig 7 are bounds on what temperatures would do if all climate variation was within 'the noise level of natural variation'. Temperature anomalies rose out of the noise in the mid-late 80's, as predicted. Isn't that the real key? When a natural phenomenon rises out of its natural range of observations, its time to go looking, via modeling runs or whatever tools are available, for the causes. -
HumanityRules at 01:14 AM on 30 August 2010Human CO2: Peddling Myths About The Carbon Cycle
What's so special about the past 20millions years? 100 million years ago pCO2 was three times it is today. 175 million years ago it was 7 times todays level. What is "the natural balance of the carbon cycle"? It seems like an unscientific statement. I can't imagine anything that is working for balance in this. -
RickG at 01:06 AM on 30 August 2010Why we can trust the surface temperature record
#2 thingadonta I guess that's why anomalies are used instead of actual temperatures. -
Peter Hogarth at 01:02 AM on 30 August 2010Climate's changed before
Svettypoo at 10:04 AM on 29 August, 2010 I’m not sure where your chart originates, but the temperature schematic is from Scotese, from around ten years ago. It is disheartening to see this schematic repeatedly being wheeled out on skeptical websites and venerated like the bones of some long dead saint, despite more than a decade of painstaking research since which makes it quite obsolete. It is a schematic only, meant to show very approximate periods of relative warmth and cold. The composite d18O proxy data used to estimate paleo-temperature variations, which has been gathered over many years is far more complex. I have charts if anyone is interested. Anyway, keeping it simple, the most recent chart showing Phanerozoic temperature variations estimated from updated d18O records compared with those which would result from (updated) paleo-CO2 data I have seen is from Royer 2009.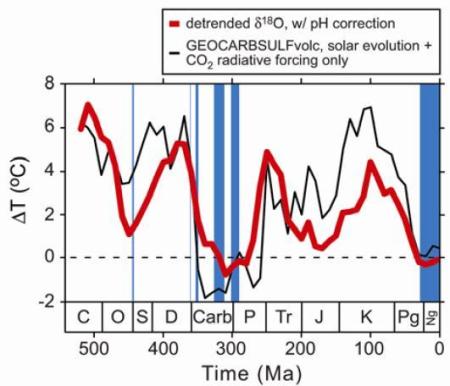 This includes recently revised (2009) paleosol CO2 estimates from Breecker 2010 but we must remember it is a compressed overview (each pixel is bigger than our entire ice core record). Over recent years, we have been able to address many gaps, uncertainties and lack of detail in our knowledge of paleo-CO2 data, from the Neogene to the Ordovician. Though much work is still to be done, as each new piece in the jigsaw is added, the link between carbon cycle and climate is strengthened. For those interested in more detail I have tried to find some free links to some good recent work, see: Seki 2010 (and see Seki 2010 supplementary data), Young 2010, Tripati 2009 (and see Tripati 2009 supplementary data).
Incidentally, for some longer term solar irradiance proxy data (9300 years) try
Steinhilber 2009, and on the NOAA paleo website there are much longer reconstructions based on the 10Be records from ice cores, though these should also be interpreted with a little care.
This includes recently revised (2009) paleosol CO2 estimates from Breecker 2010 but we must remember it is a compressed overview (each pixel is bigger than our entire ice core record). Over recent years, we have been able to address many gaps, uncertainties and lack of detail in our knowledge of paleo-CO2 data, from the Neogene to the Ordovician. Though much work is still to be done, as each new piece in the jigsaw is added, the link between carbon cycle and climate is strengthened. For those interested in more detail I have tried to find some free links to some good recent work, see: Seki 2010 (and see Seki 2010 supplementary data), Young 2010, Tripati 2009 (and see Tripati 2009 supplementary data).
Incidentally, for some longer term solar irradiance proxy data (9300 years) try
Steinhilber 2009, and on the NOAA paleo website there are much longer reconstructions based on the 10Be records from ice cores, though these should also be interpreted with a little care.
-
HumanityRules at 00:56 AM on 30 August 2010Can humans affect global climate?
31.michael sweet You read too many nefarious motives in what 'deniers' write. Everything is up for discussion in my eyes (although I accept this is OT). My original post explains the tenuous connection between the Armagh data and the article. One problem I have with AGW is that I think it understates natural variability, which might be the flip side of human induced change. The data was just meant to illustrate that. Even with Peter's useful post I don't feel fully satisfied it doesn't. (just to be clear those "limited number of years" would be the full, 200 years of one of the longest temperature records in the world) -
Tom Dayton at 00:40 AM on 30 August 2010Human CO2: Peddling Myths About The Carbon Cycle
Nerndt, that is explained in the Intermediate version of this post. In the green box at the top of this page, click the link to "Human CO2 are a tiny...." Once on that page, click the Intermediate tab. -
nerndt at 00:28 AM on 30 August 2010Human CO2: Peddling Myths About The Carbon Cycle
Can someone prove it is manmade CO2 that is being added or just extra CO2 since the planet has been warming for the past 30+ years? During periods of warming, more CO2 will be naturally released by vegetation decomposition, etc. It may take nature time to readjust the feddback cycle. -
Colorado Bob at 23:30 PM on 29 August 2010Human CO2: Peddling Myths About The Carbon Cycle
Another bug getting the upper hand - Coffee threatened by beetles in a warming world A tiny insect that thrives in warmer temperatures — the coffee berry borer — has been spreading steadily, devastating coffee plants in Africa, Latin America, and around the world http://www.guardian.co.uk/environment/2010/aug/27/coffee-threatened-beetles-warmingResponse: Global warming threatening my coffee? This time its personal! -
michael sweet at 23:10 PM on 29 August 2010Why we can trust the surface temperature record
Johnd, Your argument is false on its face. Why should I look up more data when you have not cited a single source for your extraordinary claim? You claim that spring is coming ealier AND fall is coming later due to seasons shifting. This is obviously impossible. It must be one or the other. Is spring coming earlier due to the supposed season shifting or fall later? What accounts for the shift in the other season, since both have been observed to change? In addition, the shift of spring and fall is 7-21 days in the last 30 years. You claim one day shift in 70 years. I suggest the scientists are right in saying there is not a shift in the seasons. Think about what you claim before you write it. The Milankovich cycles change where energy strikes Earth, not the season when it arrives. This is a completely unrelated topic from seasons shifting, you need to learn about the significance of the Milankovich cycles if you want to discuss them. Try Wikipedia for a start. -
RSVP at 22:33 PM on 29 August 2010Why we can trust the surface temperature record
As per Steve O's list #11: You might add snow line elevation in mountains, ski resort seasonal duration, or even locations chosen for mounting on ski lifts. -
michael sweet at 22:31 PM on 29 August 2010Can humans affect global climate?
Why are we having such a long discussion about a SINGLE weather station. The reason deniers point to Armagh is that they claim the data from this station contradicts global warming. That is, by looking at only a single station for a limited number of years the warming doesn't look that bad. As Peter has shown above, this argument is completely false. The data from Armagh is completely consistent with global warming. Scientists EXPECT the trend at single stations to vary more than the global average. This is exactly what is observed. HR what is your point that you think is relevant about this single weather station? -
gpwayne at 21:41 PM on 29 August 2010Human CO2: Peddling Myths About The Carbon Cycle
jondoig: good call on the first point - I'll amend that straight away. On the second point, it's from Tripati 2009 (quoted from the intermediate version). -
Rob Painting at 21:41 PM on 29 August 2010Climate's changed before
Svettypoo @119, I'll try again - Atmospheric CO2 concentrations during ancient greenhouse climates were similar to those predicted for A.D. 2100 -
boba10960 at 21:37 PM on 29 August 2010Ocean acidification threatens entire marine food chains
I wish I had seen the first figure of 31 Dappledwater before posting my previous comment. That figure illustrates the point that the chemistry of the WML responds almost immediately to rising CO2. -
boba10960 at 21:33 PM on 29 August 2010Ocean acidification threatens entire marine food chains
The principal response to the "ocean water is well buffered" argument is to note the contrasting time scales of the processes involved, as noted in several comments above. The pH of surface ocean water (WML) responds to rising CO2 in the atmosphere almost immediately, within a year or so. By contrast, hundreds of years are required for acidified surface water to be mixed into the deep ocean, and it takes thousands of years for reactions with calcium carbonate in the deep sea to buffer the acid. These processes and their associated time scales are incorporated into models, and that is why scientists know that buffering reactions are "too little - too late". Organisms living in the WML will feel the full impacts of acidification over the next century or so, long before the acidified water even reaches most regions of the deep ocean where buffering reactions can occur. -
Rob Painting at 21:28 PM on 29 August 2010Ocean acidification threatens entire marine food chains
Thingadonta @ 25 - Your latest speculative proposition has some problems. 1. The current rapid increase in atmospheric CO2, due to fossil fuel combustion, is being mirrored in CO2 dissolved in surface sea waters (those above 800 meters) & a corresponding decline in ocean ph. 2. This relationship between atmospheric CO2 and ocean ph dates back not only 800, 000 years ( See figure 1 of intermediate version here) , but likely many millions of years.
3. Note the scale of recent change (1800 to 2000) compared to changes in ocean ph for the last 20 odd million years. It's unmatched in the record because the natural processes (weathering & carbonate deposition) can't keep up with the rate humans are injecting carbon into the atmosphere.
2. This relationship between atmospheric CO2 and ocean ph dates back not only 800, 000 years ( See figure 1 of intermediate version here) , but likely many millions of years.
3. Note the scale of recent change (1800 to 2000) compared to changes in ocean ph for the last 20 odd million years. It's unmatched in the record because the natural processes (weathering & carbonate deposition) can't keep up with the rate humans are injecting carbon into the atmosphere.
 4. There is no evidence of an unprecedented super-ginormous increase in volcanic activity on land, why do you suppose (sidestepping issues with ocean mixing, increased stratification and time lags) there is for submarine volcanoes?
-
John Chapman at 21:07 PM on 29 August 2010Why we can trust the surface temperature record
You don't need thermometers to notice the temperature change was highlighted by a recent column I read by a vigneron in Victoria, Australia, who has records of when grapes were picked at his vineyard. These records went back many decades (being a family business) and he remarked that it was quite clear that over the past numerous decades the picking time has been advancing by a week each decade. The article was aptly titled "The proof is in the picking". -
Rob Painting at 20:26 PM on 29 August 2010Ocean acidification threatens entire marine food chains
My previous link was broken, Ocean Acidification in Deep time -
svettypoo at 20:09 PM on 29 August 2010Climate's changed before
I do not have a loner perspective on solar evolution doug_bostrom and KR, just like you I think that the young dim sun hypothesis is likely true. To quote myself "Perhaps the dim sun hypothesis is correct and the sun has been warming,I believe this is probable" Please don't commit a straw man. I stated it wasn't empirical because there is no record of it, which is also true. Which one of my points do you disagree with? The only reason why I mentioned it was not empirically proven was because the OP claimed that CO2 effect on the climate can be proven empirically. KR, there is a statistical reason why i wanted to leave out the warming sun. Its the whole point of the argument. Here is the statistical explanation. Radiative forcing hypothesis claims CO2 combined with solar irridiance to provide the closest correlation with temperature proxies. statistically speaking, this would mean that both CO2 and solar irridiance should be positively correlated with temp proxies when calculated alone. I however agree 100% that solar irridiance is heavily correlated with temperature proxies. I wanted to show the lack of correlation that CO2 had with temperature proxies in paleoclimate. This makes perfect sense statistically and in the context of the argument. Please try and understand the argument and the post before making a rebuttal. KR, Sadly, those graphs that you posted do not show temperature on any axis. So I don't know how you can claim that "the evidence others have presented indicate that CO2 levels and solar forcing together match quite well to temperature." I am beginning to think that you post first and think later. Actually, simply by looking at the graph you can see the holes in the solar forcing combined with CO2 argument. The Ordovician, Devonian, early Carboniferous, and Permian ice ages are not correlated with troughs in the graph.(the Permian ice age happens on a mini crest, look closely) Thats 4 out of six ice ages... This blows a pretty gaping hole in the argument... Also, the interglacial between the 4th and 5th ice ages makes absolutely no sense at the level of radiative forcing at that moment. -
HumanityRules at 19:51 PM on 29 August 2010Can humans affect global climate?
28.Peter Hogarth "The decadal average shows a very similar recent significant upwards trend in both records." Signficicant in relation to what? The 25year smoothing I did in comment #12 shows that the warming trend in the recent period is little different to other periods in the record. Such as the times around 1850 and 1950. Even your decadal smoothed data shows that to some extent. Yes the early data has to be qualified but it is all we have so have to either accept it or not. If you're going to make the statement that the recent period is in some way significant then you have to at least try to include as much of the record as possible to make that statement meaningful. -
jondoig at 19:48 PM on 29 August 2010Human CO2: Peddling Myths About The Carbon Cycle
Also, where's the data behind "A natural change of 100ppm normally takes 5,000 to 20,000 years."? I ask because delayers like my local MP say we're just "accelerating" natural climate change. But by what factor? Joe Romm claimed 14,000 times, but that's compared to the trend over the last 600,000 years (22ppm), not to the maximum natural rate of change. -
jondoig at 19:06 PM on 29 August 2010Human CO2: Peddling Myths About The Carbon Cycle
"Man-made CO2 in the atmosphere has increased by a third since the pre-industrial era" I think you mean "Man-made CO2 has increased the overall level of CO2 in the atmosphere by a third since the pre-industrial era". -
Glenn Tamblyn at 18:28 PM on 29 August 2010Ocean acidification threatens entire marine food chains
johnd @27 Agreed John. I once had a sceptic show me an analysis he had done, looking at the change in energy distribution around the planet over the course of a year and ocean temperature changes over the same period as an argument for why the oceans don't have a big thermal lag. All he had actually done was make a rough calculation of the size of the WML. Somehow he just couldn't see that though... -
Doug Bostrom at 17:18 PM on 29 August 2010Climate's changed before
Svettypoo I'm guessing you're pretty new to this topic, that or you're practicing some form of impressionism by ignoring important features of this topic. Notice that we've been adding C02 to the atmosphere in significant quantities only for the past 150 years, reaching close to 400ppm only in the past couple of decades. This means atmospheric temperature has not come close to equilibrating to the temperature it can be expected to reach at the present concentration, let alone where it'll eventually settle assuming we end up in the 800-1000ppm level where my intuition (cynicism?) suggests we'll sit given our indolence, complacency and proclivity to believe in comforting fairy tales. As to your loner perspective on solar evolution, yes I did read to the end of your version of "I doubt it" and found that part unpersuasive. Start here w/Spencer Weart's informative book on the topic of global warming to get caught up, if indeed you're fresh. -
Ken Lambert at 17:12 PM on 29 August 2010What caused early 20th Century warming?
muoncounter #35 I was rather looking forward to your reply to my post #36. It also is directly relevant to the latest topic concerning the surface temperature record. -
RSVP at 16:10 PM on 29 August 2010Comparing volcanic CO2 to human CO2
I planted eight trees about 15 years ago. Only one of these is still alive. Meanwhile, two or three autochthonous species sprang up where nature dictated. The "CO2 problem" is the unnatural "population problem" that CO2 has amplified. Arguments based on per capita oil consumption are only part of the story. Its not an issue about energy or heat, as much as taking stock in what nature is able to deliver. -
Climate's changed before
svettypoo - CO2 has, in the paleo record, been a component of climate change. In warming, as CO2 is forced out of warmer waters, it's been a positive feedback. When CO2 weathers into newly exposed rocks, dropping temperatures, it's been a forcing. Currently we're changing CO2 levels at 100x any paleo recorded rate. That makes CO2 the first to change, and thus it's the forcing on the climate. Doubling CO2 causes ~1°C, and with the various water vapor and other feedbacks, an estimated 3°C warming. As to solar activity - we have quite literally millions (billions?) of data points as to the evolution of stars of our sun's mass - via astronomy. Not to mention the various paleo proxies. We know that stars of our sun's type evolve warming over time. Unless you have solid evidence indicating basic astronomy and stellar lifetimes are wrong? As to your graph - You have quite clearly not incorporated the 'warming sun' into it. The evidence others have presented indicate that CO2 levels and solar forcing together match quite well to temperature. -
dsleaton at 13:10 PM on 29 August 2010Climate's changed before
Just so I'm clear on your position, svettypoo, what would you consider evidence of CO2 being the primary driver of the currently-occurring climate change? What would that evidence be? What would make you say, "Aha! Ok, I see it now"? Or do you think it's fundamentally impossible to provide, no matter what the conditions? -
svettypoo at 12:47 PM on 29 August 2010Climate's changed before
doug_bostrom, I hope you are not trying to argue paleoclimatic analysis with forest fire and beetle phenomena of the last several decades. I don't mean to be rude but please stay on topic. Secondly, I don't think you completed your thought in the third paragraph. You wrote "Levels of C02 unprecedented since ~15 million years ago when global temperatures were several degrees higher, is that the missing empirical evidence you're talking about, svettypoo?" I am going to assume you mean current levels of CO2 are unprecedented since ~15 mil years ago when global temperatures were several degrees higher. The logical question is if the CO2 is the major climate driver and ppm was matched 15 mil years ago and the average temp was several degrees warmer, why isn't it several degrees warmer now? I have not confirmed your statements anywhere but if they are true, they would only strengthen a AGW sceptic argument... I will give you a chance to explain what you meant with no judgement... I did form a conclusion. Did you not read my previous post? If I wasn't clear enough i will state it now. I concluded that CO2 has never been empirically shown with statistical significance to be the driver of climate and yet the IPCC models place it in that very position. I would also like to address my emphasis on empirical evidence. One can not claim to have a record of solar activity for the past 500 million years when such a record doesn't exist. If you would have kept on reading my post you would have read that even if we were to use the dim young sun hypothesized irridiation and combine it with the CO2 proxies as the major climate drivers we would not be able to explain prove causation of CO2 driven temperature. Lastly, I have tried to be as clear as possible in describing my argument and conclusion. Perhaps you could share some of your conclusions? Thanks. -
Doug Bostrom at 11:39 AM on 29 August 2010Why we can trust the surface temperature record
You tell me, johnd. You're the person saying "I doubt it." Look up the publications of the researchers you're contradicting, find the errors and oversights you imply invalidate their conclusions, show by persuasion how your speculations about confounding factors are relevant. -
johnd at 11:35 AM on 29 August 2010Why we can trust the surface temperature record
michael sweet at 10:17 AM, if the solstices and equinoxes are not moving then that calls into question the existence of the related Milankovitch cycle. You appear to be claiming that it doesn't exist as I believe is commonly accepted, or else has stalled. What research is there to support such a claim? -
johnd at 11:28 AM on 29 August 2010Why we can trust the surface temperature record
doug_bostrom at 09:56 AM, which point are you referring to, clouds or the Milankovich axis wobble cycle? -
Andy Skuce at 11:04 AM on 29 August 2010Comparing volcanic CO2 to human CO2
TOP: According to NASA there are about 400 billion trees on the planet. If 7 billion of us each planted 5 trees per year, then over 12 years, we'd have doubled that figure. That's a lot of grazing land, crop land or desert to convert to forest in such a short time. And I wish that each of the trees I planted recently would grow to be a ton in ten years - and I live in a temperate rainforest climate zone. For now. -
MattJ at 11:02 AM on 29 August 2010Ocean acidification threatens entire marine food chains
I see people are trying the "ocean water is well buffered" argument again. But wait a minute: we have managed to lower the pH _despite_ that buffering. What do you think that means will happen as we continue to pour yet MORE CO2 into the ocean? Soon, we will have only jellyfish to eat from the sea. Unless we wise up and do it FAST. -
Doug Bostrom at 10:52 AM on 29 August 2010Comparing volcanic CO2 to human CO2
Great, TOP. How many trees have you planted? Your immediate family? Friends? Coworkers? Out of your first circle of acquainted men, women and children, how many or what fraction have planted 5 trees this year? -
Doug Bostrom at 10:47 AM on 29 August 2010Climate's changed before
Beautiful blazing BC, burning bark and beetles. Today's climate sensitivity and models (at least issued by the IPCC) place an unprecedented emphasis on CO2, which simply isn't supported by the empirical record. Levels of C02 unprecedented since ~15 million years ago when global temperatures were several degrees higher, is that the missing empirical evidence you're talking about, svettypoo? I suppose we can dodge forming a conclusion by sticking with an appropriate definition of "empirical evidence." -
TOP at 10:44 AM on 29 August 2010Comparing volcanic CO2 to human CO2
If every man, woman and child on the planet plants 5 trees a year the fossil fuel CO2 problem is fixed. Consider that each tree grows to 1 ton in ten years. -
MichaelM at 10:20 AM on 29 August 2010Why we can trust the surface temperature record
johnd at 09:15 AM on 29 August, 2010 Flowers blooming earlier now than any time in the last 250 years The paper Climate Change and Cherry Tree Blossom Festivals in Japan shows how the date of flowering for some is now two or three weeks earlier than it was in their youth. From checking records going back to the 11th Century it states that "while temperatures have varied over this period, recent decades have been warmer on average than any time during the past 1000 years"
Prev 2245 2246 2247 2248 2249 2250 2251 2252 2253 2254 2255 2256 2257 2258 2259 2260 Next


