


 Arguments


Recent Comments
Prev 2251 2252 2253 2254 2255 2256 2257 2258 2259 2260 2261 2262 2263 2264 2265 2266 Next
Comments 112901 to 112950:
-
Ned at 03:55 AM on 26 August 2010Greenhouse effect has been falsified
And, of course, Figure 1 in the very post at the top of this thread is direct evidence of the CO2 greenhouse effect. -
Ned at 03:50 AM on 26 August 2010Greenhouse effect has been falsified
Will, the troposphere is mostly heated from below, not from above, as KR notes above. The use of a glass greenhouse to illustrate the greenhouse effect is only appropriate at a coarse "end result" level, not as an actual model of how the CO2-induced GHE actually works. But in any case, the sunlight entering a (glass) greenhouse warms all dark surfaces within the space (floor, plant leaves, whatever). It doesn't significantly provide any direct warming of the air molecules inside the greenhouse. The air is warmed by contact with the various surfaces that are absorbing sunlight. Photosynthetic efficiency for most plants is less than 2%, and less than 10% in virtually all cases. Most of the sunlight absorbed by plant leaves just raises their temperature (directly) and that of the air around them (indirectly). Finally, there's experimental verification of the CO2 greenhouse effect -- see here or here (and continue on to parts two and three as well). -
Will at 03:30 AM on 26 August 2010Greenhouse effect has been falsified
Ned: The Thermosphere is not a sphere it is a bulge. The Diurnal Atmospheric Bulge and the Thermosphere are one and the same. The Diurnal Atmospheric Bulge (Thermosphere) is caused entirely by incoming EMR. I never said there was a connection between the "greenhouse effect" and the Thermosphere. I said there is no "greenhouse effect". I have proven this with experimental verification on my website at the following link: "The Diurnal Atmospheric Bulge, giant 1200º bulge of rapidly heated and expanding gases circling the Globe 24/7." KR: The atmosphere (air) is a excellent insulator and therefore a poor conductor. It exhibits various temperature gradient inversions. Partly because it is such a good insulator and partly because it is heated from the top-down by incoming EMR. All mysteries explained. Which way up is the temperature gradient in a greenhouse? Like I said before, a greenhouse still functions perfectly well with a full canopy of leaves shielding the ground completely from direct sunlight. 40-50% of the incoming sunlight hitting the leaves is locked in by photosynthesis and the rest is reflected as short-wave. No direct sunlight reaches the ground yet the greenhouse still warms that same as an empty one would. Where is the "greenhouse effect" bottom-up warming in this scenario? When your theory generates more questions than it answers, this is a clue that you are traveling away from the truth. When your theory is still awaiting experimental verification after 200 years . . . . . ? -
CBDunkerson at 03:12 AM on 26 August 2010Pakistan flood: many more will die unless more aid is delivered quickly
The high human population of the planet does play in to CO2 emissions, but population GROWTH specifically does not... precisely because that growth occurs in the areas which do NOT have high CO2 emissions. Environmental problems in general are different (and off topic) than CO2 emissions specifically. Getting back down to 350 ppm does not require a return to pre-industrial technology. If it did it would never happen. Instead, the obvious path to lower CO2 emissions is power generation from sources other than fossil fuels. -
muoncounter at 03:00 AM on 26 August 2010Warming causes CO2 rise
#2:"seasonal variations of these magnitudes must make it extremely difficult to be sure that the annual global increase of perhaps 2ppm is being accurately isolated. " I disagree. Seasonal amplitude is not the same as year-to-year rate of increase. Look from year to year at successive peaks and troughs and you find consistency in the annual growth rate.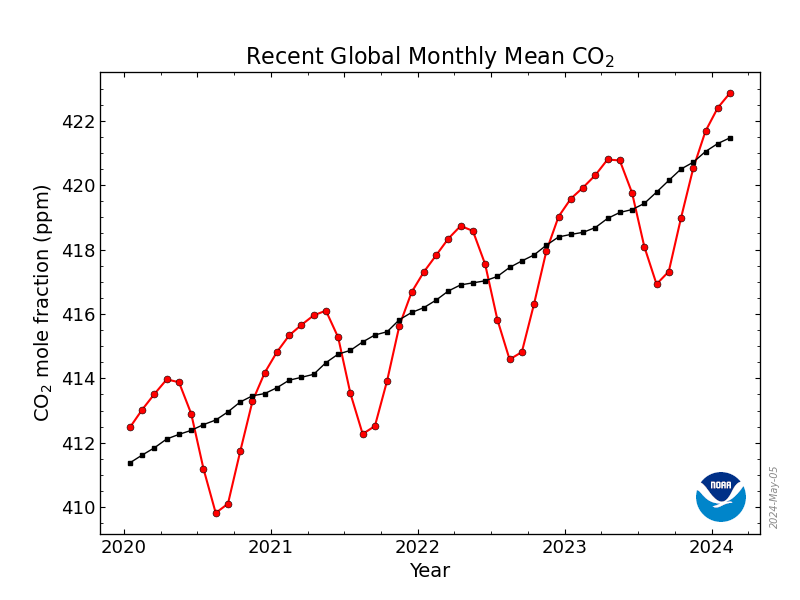 I've done this with several arctic stations where the seasonal amplitude is as high as 15ppm; what was 1-1.5 ppm in the '70s is now 2-2.25 ppm. And that rise matches the growth in CO2 emissions from fossil fuel use quite well.
-
Kernos at 02:42 AM on 26 August 2010Pakistan flood: many more will die unless more aid is delivered quickly
CBDunkerson #15: "China and India have long had huge populations... but their CO2 emissions were virtually non-existent until they began to industrialize." Which they are doing now and will be doing more of in the future. And, is it not largely farmers that clear land to grow crops? I think saying human population, global or regional, has nothing to do with global warming and other human environmental impacts is simply specious. "So again... no significant 'negative feedback' on CO2 emissions from natural disasters. At least not any time in the near future. " Is not one of the causes of environmental problems, short term thinking/ Should we not be thinking in the long term, say a millennium from now? "...how well technology has kept up with allowing us to adapt to the climate." I think the goal to not to adapt, but to turn back to pre-industrial levels, or say to 350 ppm, as some suggest. I certainly don't want coastal city dwellers inundating my grandkids as they all run for higher ground. Besides, these human disasters may be the only thing to get the politicians thinking beyond the next election. Or is that just wishful thinking? I do not think the environmental problems can be solved without taking human population(s) into account. -
Greenhouse effect has been falsified
Will - on your note that 79% of the atmosphere is completely missing: I assume you mean N2? Nitrogen doesn't absorb/emit in the IR, and in fact most of it's absorption is in the UV. Hence it's usually not shown on most charts of greenhouse gases - it's irrelevant to the IR spectra. -
Greenhouse effect has been falsified
Will - There's definitely heating from the sun involved in atmospheric expansion. Looking at the energy balances from Trenberth 2009 roughly 78 W/m^2 of sunlight are directly absorbed by the atmosphere. Another 161 get absorbed by the ground/water. However, what's emitted by the top of the atmosphere (as LW radiation) is ~169 W/m^2 - partly re-emission of atmospheric energy, mostly emission from ground/water thermal energy that has percolated up through multiple absorption/emission events. And the temperature profile of the atmosphere shows warming of the troposphere and cooling of the stratosphere - if this was all top-down warming you would see a hot stratosphere and colder troposphere, relatively speaking. The observed temp profile is one of the fingerprints of the greenhouse gas effect. So yes, some top-down heating does occur. But it's mostly bottom-up, as most of the solar irradiation goes through the atmosphere to the ground, only returning as IR. I would say that the diurnal bulging of the atmosphere is due to the atmosphere warming - because days are warmer than nights. But the temp profile clearly shows that it's warming from the bottom (IR), not the top (solar). -
Ned at 01:24 AM on 26 August 2010Greenhouse effect has been falsified
Of course the thermosphere and to a lesser extent the mesosphere are heated by the sun, mostly via UV absorption. But they're not that far from vacuum -- less than 1% of the mass of the atmosphere. And this is completely irrelevant to the greenhouse effect. There's simply no connection whatsoever. The situation in the troposphere -- the layer of the atmosphere closest to the surface, including most of the mass of the atmosphere -- is entirely different. Longwave radiation from the surface is absorbed by molecules of CO2 and other greenhouse gases, which in turn heat the more numerous N2 and O2 molecules kinetically, via intermolecular collisions. Thus, the entire mass of a given "parcel" of the atmosphere shares a single temperature -- you don't have different temperatures for CO2, O2, N2, etc. CO2 and the other greenhouse gases then radiate in all directions. Thus, the presence of GHG molecules warms the troposphere, and increasing the concentration of those molecules increases the efficiency of this warming. Keep in mind that the vast majority of solar irradiance is at relatively short wavelengths (visible and near-infrared) where atmospheric transmittance is relatively high. The solar flux at thermal IR wavelengths (over 3 micrometers) is minuscule in comparison to the terrestrial outgoing thermal IR flux. If you would like a good overview of the physics of the greenhouse effect, I would highly recommend the series of posts on "CO2: An Insignificant Trace Gas?" over at Science of Doom. Hope this helps. -
Byron Smith at 01:22 AM on 26 August 2010Arctic Sea Ice: Why Do Skeptics Think in Only Two Dimensions?
Ah, thanks for the clarification. That makes much more sense! -
dorlomin at 00:44 AM on 26 August 2010Arctic sea ice... take 2
HumanityRules at 00:35 AM on 26 August, 2010 Again the PIOMAS isn't measured data but modelled data, an important distinction. That's why it can be, and sometimes is, wrong. = = = = = = = = = = = = = = = = = = It is a model derived from measurements like almost every other metric used on a similar scale (100-1000 square kms). Even the isobars on an MSLP chart are effectively models. -
HumanityRules at 00:35 AM on 26 August 2010Arctic sea ice... take 2
Again the PIOMAS isn't measured data but modelled data, an important distinction. That's why it can be, and sometimes is, wrong. -
Will at 00:33 AM on 26 August 2010Greenhouse effect has been falsified
adelady: You are correct, it is of course radiation. Which is why I asked Ned to clarify if he was describing conduction or radiation. Assuming he even knows of course. Ned has opted to go on the attack instead of answering the question. I repeat to Ned, please follow the links and read my article. Then explain how an area with a circumference of 25% of the entire surface of the atmosphere can bulge up to an altitude of more than 600 km altitude under the solar point at around 2 pm in the sky, yet at 4 am on the dark side of the Earth this bulge completely collapses bellow the Mesosphere at under 90 km, if the atmosphere is so transparent to incoming full spectrum electro-magnetic energy. -
Jeff T at 00:29 AM on 26 August 2010Hansen etal hit a Climate Home Run -- in 1981
A triumphant title ("Home Run") may be warranted, but it may repel visitors who are undecided. Try this instead: "Global temperature has increased, as predicted by Hansen etal in 1981." Or: "... etal 29 years ago." -
Ned at 00:08 AM on 26 August 2010Warming causes CO2 rise
johnd: I guess I'm not clear about what you're suggesting. Are you saying that the observed rise in CO2 might not be anthropogenic? Or that we don't have to worry about it because perhaps natural sinks will suddenly change their behavior and start soaking up a lot more CO2? -
adelady at 00:02 AM on 26 August 2010Greenhouse effect has been falsified
Will, if air is such a poor conductor of energy, how can the atmosphere maintain its cool temperature in the face of (warming) radiation from any direction, sun or earth. Given that it is a poor conductor, the only way for the atmosphere to cool must be by, you guessed it, radiation at the top of the atmosphere. If it's radiating out at the top of the atmosphere, surely the molecules comprising the atmosphere would also be radiating all the way through the atmosphere. Unless there are GPS guided molecules that can work out where they are to start radiating in only one place? -
Ned at 00:02 AM on 26 August 2010Greenhouse effect has been falsified
These comments are a nice example of the problems I have raised many times on this site, most recently here. That is, we often get comments on this site from the more serious "skeptics" accusing us of wasting time on straw-man arguments and of rebutting claims that no one really believes. So ... here we have another commenter claiming that the atmosphere is directly heated by solar irradiance "top-down" and that the greenhouse effect does not exist. I could, of course, do what so many of us supporters of mainstream science have done over and over again, and patiently work on responding to these claims, explaining to Will why he misunderstands the physics of radiation in the atmosphere. It would be nice, though, if some of those supposedly serious, reasonable skeptics would join in and help answer Will's claims. If that were to happen, it might help me believe that there really are "skeptics" who are serious about science. So far, the only resident "skeptic" commenter to speak up has been Berényi Péter ... who quibbles over my use of the word "transparent" but is apparently unable or unwilling (or perhaps too busy) to contribute anything more directly relevant to addressing Will's questions. Is there anyone on the "skeptic" side here who understands what's wrong with Will's claims and is actually willing to say so? Or, once again, will the job of explaining Will's errors be left up to the rest of us? Of course, this isn't the most recent or active thread, so I suppose it's possible that many people might not notice these comments immediately. -
Peter Hogarth at 23:35 PM on 25 August 2010Warming causes CO2 rise
johnd at 19:04 PM on 25 August, 2010 Are you suggesting the CO2 trends, as independently monitored by multiple stations world wide, are in doubt? See Global CO2 data, and SCHIAMACHY independent satellite derived CO2 trends and seasonal variations (which corroborate the Mauna Loa data), and the NOAA ESRL trends website. The derivative method Hocker uses does reveal de-trended changes in atmospheric CO2 with seasonal variations removed, and these are interesting in terms of primarily land based sources and sinks (I will comment further or post in detail at some point) but these variations are a few ppm and swamped by both natural seasonal variations and the very well defined significant trend from long term anthropogenic emissions. -
Will at 23:22 PM on 25 August 2010Greenhouse effect has been falsified
Berényi Péter This diagram of absorption bands is interesting for what it doesn't show. 79% of the atmosphere is completely missing. -
Will at 23:18 PM on 25 August 2010Greenhouse effect has been falsified
Sorry but these statements are nothing but semantics. The Diurnal Atmospheric Bulge is incontrovertible proof of massive violent top-down atmospheric heating. Please follow the link and read the paper. A greenhouse with a full canopy of leaves completely shielding the ground from direct Sunlight still functions normally. More proof that air is heated by incoming full spectrum electro-magnetic radiation and NOT by OLR. Therefore the "greenhouse effect" hypothesis is false. Ned, Air is rated as one of the top insulators of all substances. That means that air is a very poor conductor of energy compared to most substance. In fact it is one of the poorest conductors of energy there is. What are you trying to describe in your last statement? Conduction or Radiation? -
tobyjoyce at 23:11 PM on 25 August 2010Medieval Warm Period: rhetoric vs science
The Norse Greenland colony, which was started in the 11th century and was abandoned in the 15th century, often comes up in connection with the Medieval Warm Anomaly. There is a very good account of it in Jared Diamond's Collapse. Diamond refers to several book-length accounts, but a shorter older account I have is Magnus Magnusson's Vikings (1980). Magnusson was an Icelander, a scholar and archaeologist woh made it quite big on television in Britain in the 1970s and 1980s. Magnusson's book is an apologia for the Vikings, who (he claims) were misunderstood traders. Hence he emphasises peaceful relations with the Inuit, whereas Diamond suspects the Vikings and the Inuit had primarily an antagonistic relationship. Certainly, the Norsemen never adapted any Inuit technology, which was better suited to the environment than theirs. However, the colony was marginal from the start. It quickly ran short of wood and iron for tools, and used Labrador as a source for each. Farm animals overgrazed the pastures and the short summers made life harsh. Its main export(walrus ivory) was a long distance from the market (Norway) and a difficult journey away. In modern terms, the colony was tiny: about 4,000 people in an "Eastern Settlement", just near the southern tip of Greenland, and 1,000 more in a "Western Settlement" (really North-Western). Diamond suspects the Western Settlement was wiped out by Inuit. Then as now, most of Greenland was ice capped. The colonists and the Inuit eked out an existence from the sea and the coastal strip. As I said above, the Inuit (who were also recent arrivals) had the superior technology and survival skills for the tough environment. There is no need, therefore, to appeal to climate ALONE as the source of the difficulties experienced by the Norse settlements, after their early successes. Diamond makes that clear. Magnusson refers to climate as a suspect in the final collapse but, writing when he did, he calls it the "Little Climate Optimum". So "climate determinism" falls down when the Medieval Greenland colony is discussed - climate may have contributed to its short flourishing period and its demise, but there are multiple other factors which also affected that outcome. -
Berényi Péter at 23:09 PM on 25 August 2010Greenhouse effect has been falsified
#5 Ned at 21:26 PM on 25 August, 2010 A large percentage of the total downwelling solar irradiance is in the near-infrared range, but the atmosphere is mostly transparent in this part of the spectrum That's how transparent it is.
-
batsvensson at 23:05 PM on 25 August 2010Can't We At Least Agree That There Is No Consensus?
JMurphy at 03:24 AM on 25 August, 2010 Did you understand what I wrote? -
ecotox at 22:42 PM on 25 August 2010Arctic sea ice... take 2
pikaia is right. The curve would not be linear, as the albedo effect of more dark ocean each year would act as a catalyst. Hence, curving the relationship between ice volume and time. (However, adding another difficult variable to an otherwise simple concept could prove troublesome for politician simpletons and John Q public.) -
Peter Hogarth at 22:26 PM on 25 August 2010The Past and Future of the Greenland Ice Sheet
Berényi Péter at 20:28 PM on 22 August, 2010 As promised, some thoughts on BC (Black Carbon) which I hope are of interest: Globally, over the past century, BC trends have risen, mainly due to low latitude contributions, with a possible tailing off after 1980. In line with previous work Kopp 2010 suggests our best current estimate of global effective Radiative Forcing due to BC is about 0.22 Wm−2. I do not want to downplay the role of BC in regions like the Himalayas, but this thread is about Greenland. Let us look at what the authors and co-workers of the paper you cite have actually said recently on the NH and Arctic regions: Flanner 2009: “Equilibrium climate experiments suggest that fossil fuel and biofuel emissions of BC+OM induce 95% as much springtime snow cover loss over Eurasia as anthropogenic carbon dioxide”; Hadley 2009: “Black carbon (BC) has been measured in snow and ice cores at levels that climate models predict are high enough to be the second leading cause in arctic ice melt and glacial retreat after greenhouse gas warming”; Zender 2009: “our GCM (General Circulation Model) simulations show that dirty snow can explain about 30% of the observed 20th century Arctic warming” Note so far we are talking in the main about simulations. Comparing modeled deposition results from measured observations Gilardoni 2010 we see good agreement in general, but not in the three Arctic sites selected (one of which is Alert, just off Northern Greenland), where measured equivalent BC levels are much lower than global averages. These sites show strong (5 to 10 times higher than background) annual BC peaks (to around 120ng/m3) through January, February and March, when insolation is relatively low. Lamarque 2010 - in support of more accurate simulations (some results shown for Greenland) has introduced a new 150 year global gridded dataset of anthropogenic and biomass burning aerosol emissions, and Hegg 2010 has reported detailed results from much higher spatial resolution measurements of light absorbing aerosols (including BC) in the Arctic. One surprising finding is that the main current source of Arctic BC is biomass burning, and not fossil fuels (as is the case in Eurasia). In the Canadian High Arctic in recent decades we see overall reductions in BC levels from the mid 1980s, with a shift in proportional contributions from Eurasia (due to emission controls) and the US Gong 2010. So what of Greenland? In the early 20th Century BC concentrations (from high resolution ice core evidence) were much higher, and may have changed the summertime surface energy budget by around 3Wm−2 McConnell 2007, however current levels are now significantly lower, and are also lower than global averages. At the same site Sulphate levels continued to rise until the 1980s in Greenland Lamarque 2010. Considering the early 20th century Greenland warming, these results are interesting and it is likely that anthropogenic aerosol effects contributed as has been noted previously by Wild 2009 and others, (see review of more than 20 recent papers introduced by Wild 2010) (a) Monthly (black) and annual (red) measured BC levels at ice core site D4 in Greenland (71.4 N, 44 W) and (b) relative Winter/Summer levels from site D5, which is approximately 350km further south, from McConnell 2007
Given this evidence it is unlikely that BC contributes to the most recent increases in Arctic surface air temperature and Greenland ice margin melt rates, and is even more unlikely to contribute to warmer waters and warmer Ocean currents causing basal glacier outlet melt and overall accelerated mass loss in Greenland.
(a) Monthly (black) and annual (red) measured BC levels at ice core site D4 in Greenland (71.4 N, 44 W) and (b) relative Winter/Summer levels from site D5, which is approximately 350km further south, from McConnell 2007
Given this evidence it is unlikely that BC contributes to the most recent increases in Arctic surface air temperature and Greenland ice margin melt rates, and is even more unlikely to contribute to warmer waters and warmer Ocean currents causing basal glacier outlet melt and overall accelerated mass loss in Greenland.
-
Berényi Péter at 22:21 PM on 25 August 2010What were climate scientists predicting in the 1970s?
#46 gp2 at 23:25 PM on 24 August, 2010 the results clarify that the seemingly mysterious rise in global-mean stratospheric temperatures since 1993 is consistent with increasing stratospheric ozone juxtaposed on global-mean cooling of 0.1 K/decade I still don't get it. After the recovery from the Pinatubo event lower stratosphere temperatures go with no trend whatsoever. At the same time there is no clear trend in ozone either. Some recovery is seen indeed after Pinatubo, but then it started to decrease again (after 1998, even more so after 2003).
 For the same period GISS Surface Temperature Analysis shows at least 0.32°C warming for Global Annual Mean Surface Air Temperature.
According to the Manabe model, we should have five times as much cooling (that is, -1.6°C) in the upper stratosphere. Even if sensitivity characteristics of TLS are taken into account, one would expect at least twice as much cooling in lower stratosphere than the warming rate of the surface. It would mean 0.64°C in the one and a half decades considered (-0.43°/decade).
If Thompson 2009 is followed in that current lack of temperature decrease in lower stratosphere is due to an increase of ozone (in fact it is not), the -0.1°C/decade they find as a residual still seems to be far too small.
It would imply a 0.08°C warming of the surface in 15 years, that is, 75% of the observed warming should come from something else than GHGs (UHI? soot?).
The problem with this solution is climate sensitivity would be less than 1°C/doubling of CO2, that is, water vapor/cloud feedback is strong negative, which contradicts computational climate models.
For the same period GISS Surface Temperature Analysis shows at least 0.32°C warming for Global Annual Mean Surface Air Temperature.
According to the Manabe model, we should have five times as much cooling (that is, -1.6°C) in the upper stratosphere. Even if sensitivity characteristics of TLS are taken into account, one would expect at least twice as much cooling in lower stratosphere than the warming rate of the surface. It would mean 0.64°C in the one and a half decades considered (-0.43°/decade).
If Thompson 2009 is followed in that current lack of temperature decrease in lower stratosphere is due to an increase of ozone (in fact it is not), the -0.1°C/decade they find as a residual still seems to be far too small.
It would imply a 0.08°C warming of the surface in 15 years, that is, 75% of the observed warming should come from something else than GHGs (UHI? soot?).
The problem with this solution is climate sensitivity would be less than 1°C/doubling of CO2, that is, water vapor/cloud feedback is strong negative, which contradicts computational climate models.
-
Ned at 22:07 PM on 25 August 2010Greenhouse effect has been falsified
Will, the "heat capacity" issue is irrelevant, too. CO2, methane, CFCs, etc. absorb longwave IR radiation, but they then transfer that heat to the rest of the atmosphere via collisions with other atmospheric molecules (roughly a billion collisions per second per molecule). -
JMurphy at 21:42 PM on 25 August 2010Can't We At Least Agree That There Is No Consensus?
scaddenp wrote : "Guys, I think we have given PT enough rope. Moderator Response: Yes, there is no progress in that discussion, so let's just agree to disagree. Enough rope, as well as the hook, line and sinker. In the end, though, those of us with normal lives and outlooks on life, have to know when to call it a day and move on to something more interesting. I get very dizzy going round and round in circles. Any observer should be able to see how warped that list is by now but it will be interesting to see which so-called skeptic tries to link to it next ! (Cue Poptech posting : "I have not been given enough rope. My list is interesting. You have not...etc., etc., ad nauseum) -
Ned at 21:37 PM on 25 August 2010Arctic sea ice... take 2
Mikemcc, yes, you're right -- "albedo" is the average reflectance across either the visible spectrum or the visible & near-infrared range (say, 0.4 to 0.7 or 1.0 or 1.3 micrometers) depending how one wants do define it. The albedo of a surface determines what fraction of the incident light from the sun is reflected. The portion that isn't reflected is, of course, absorbed, raising the temperature of the surface. -
Ned at 21:26 PM on 25 August 2010Greenhouse effect has been falsified
Will writes: Ultimately the fallacious assertions in support of the bogus "greenhouse effect" depend entirely on the ridiculous notion that the atmosphere is heated bottom-up by OLR (outgoing Long-wave radiation). This in-turn requires that the atmosphere is completely transparent to incoming full spectrum electro-magnetic radiation, a large percentage of which is IR. Either you're forgetting the inverse-square law, or you're confused about the distinction between "near infrared" and "thermal infrared" wavelengths. A large percentage of the total downwelling solar irradiance is in the near-infrared range, but the atmosphere is mostly transparent in this part of the spectrum. Only a very small fraction of solar irradiance is in the thermal infrared region. If we look just at thermal infrared radiation, how much of the radiant flux in the atmosphere is from the sun and how much is from the earth? Obviously, the sun is much hotter ... but it's also much further away. Thus, virtually all the IR radiation in the atmosphere is coming from the earth, not the sun: From Science of Doom
The yellow curve at the left is the blackbody radiation curve for the sun at a temperature of 5780K and a distance of 150 million km. The variously colored curves on the right are blackbody radiation curves for the earth at various normal earth temperatures.
Note, first, that the Y axis is log-scaled. Note, second, that in the thermal part of the spectrum (greater than 3 micrometers) the area under the "earth" curves is much, much larger than the area under the "sun" curve.
Bottom line, the sun heats the earth via visible and near-infrared radiation. The earth emits long-wave (thermal infrared) radiation. Increasing the concentration of greenhouse gases in the atmosphere traps more of that long-wave radiation and raises the temperature of the earth system.
From Science of Doom
The yellow curve at the left is the blackbody radiation curve for the sun at a temperature of 5780K and a distance of 150 million km. The variously colored curves on the right are blackbody radiation curves for the earth at various normal earth temperatures.
Note, first, that the Y axis is log-scaled. Note, second, that in the thermal part of the spectrum (greater than 3 micrometers) the area under the "earth" curves is much, much larger than the area under the "sun" curve.
Bottom line, the sun heats the earth via visible and near-infrared radiation. The earth emits long-wave (thermal infrared) radiation. Increasing the concentration of greenhouse gases in the atmosphere traps more of that long-wave radiation and raises the temperature of the earth system.
-
Mikemcc at 21:19 PM on 25 August 2010Arctic sea ice... take 2
I thought albedeo was primarily a measure of reflection of visible light, since that is where most of the energy is from sunlight. Dark water absorbs more of this energy than white ice. The energy absorbed by the water leads to heating, and some of the absorbed energy is then re-radiated as heat radiation (IR). -
dontcry at 21:02 PM on 25 August 2010Skeptical Science housekeeping: iPhone app, comments and translations
This is really a bit inconvenient to have no information about the user, no link to their profile page. Is it also possible that the email address or website could be displayed like a signature? Like this. Steve Zuc. from Pdfok -
Rob Painting at 20:50 PM on 25 August 2010Greenhouse effect has been falsified
Another question Will - if there's no Greenhouse Effect, why was it warmer in Earth's distant past at a time of reduced solar luminosity?. -
Rob Painting at 20:16 PM on 25 August 2010Greenhouse effect has been falsified
Will, if there's no Greenhouse Effect, why doesn't the Earth freeze over at night?. -
skywatcher at 19:46 PM on 25 August 2010Arctic sea ice... take 2
In that context, fitting a quadratic trend to either the sea ice extent or sea ice volume since 1979 produces a much better fit - ie the losses are accelerating through time, rather than simply declining linearly. Those trends reach zero (in September) for extent around 2030, and volume before 2020. -
Will at 19:37 PM on 25 August 2010Greenhouse effect has been falsified
Which shows that O2 and N2, 99% of the atmosphere, are more sensitive to heat absorption than CO2, 0.0385% of the atmosphere. Also weight for weight O2 and N2 have a higher heat capacity than CO2 which means that if the atmosphere consisted of 50% O2 and N2 and 50% CO2, then the CO2 half of the atmosphere would still be less important with regards atmospheric warming. But the atmosphere is not 50% N2/O2 and 50% CO2, it is 99% N2/O2 and 0.0385% CO2. Ultimately the fallacious assertions in support of the bogus "greenhouse effect" depend entirely on the ridiculous notion that the atmosphere is heated bottom-up by OLR (outgoing Long-wave radiation). This in-turn requires that the atmosphere is completely transparent to incoming full spectrum electro-magnetic radiation, a large percentage of which is IR. Both of which are false. In the following links there is finally incontrovertible proof that the atmosphere is radiatively heated from the top-down by incoming electromagnetic radiation from the Sun. This fact destroys the "Greenhouse Effect" hypothesis which stipulates, bottom-up atmospheric heating via outgoing infra-red. "The Diurnal Atmospheric Bulge, giant 1200º bulge of rapidly heated and expanding gases circling the Globe 24/7." "Diurnal Atmospheric Bulge, incontrovertible evidence of massive top down radiative heating. " -
johnd at 19:04 PM on 25 August 2010Warming causes CO2 rise
Whilst the Mauna Loa CO2 seasonal variation of about 5ppm is not only remarkably consistent and of such resolution that the approximate 2ppm annual increase can be seen, the seasonal variations measured in other various parts of the world are by comparison quite large and vary considerably from region to region. This study,http://www.atmos-chem-phys.net/8/7239/2008/acp-8-7239-2008.pdf provides data from 16 continuously monitored sites where typically the seasonal CO2 variation ranges from 350/360ppm to 390ppm, with one site, Heidelberg Germany typically 370ppm to perhaps 420ppm, (it goes off the scale). With standard deviations of generally 4-6ppm, seasonal variations of these magnitudes must make it extremely difficult to be sure that the annual global increase of perhaps 2ppm is being accurately isolated. Only a small variation in the conditions that drive the natural processes of the innumerable sources and sinks could easily eclipse the relatively small increase especially since many of those processes are not yet fully understood, let alone able to be accurately quantified. -
pikaia at 18:52 PM on 25 August 2010Arctic sea ice... take 2
I really hate the idea of trying to fit a linear trend line to a curve which is certainly not linear! Early in the 20th century the minimum ice extent was fairly constant, but it has accelerated downwards in recent decades. The way things are going, the ice will completely disappear much sooner than the straight line would suggest. -
chris at 17:52 PM on 25 August 2010Medieval Warm Period: rhetoric vs science
gallopingcamel at 14:12 PM on 25 August, 2010 oh dear gallopingcamel, that's simply wrong. I wonder whether you have made any attempt whatsoever to address a comparison of Loehle's and Moberg's reconstruction meaningfully. (i) The reconstruction of Loehle's you are referring to has an embarrassing howler. He didn't understand the convention of dating proxies, and so his "present" that he defined as near 2000 is actually near 1950. In fact his corrected analysis only goes up to 1935. Even taking his deficient analysis (remember he published this in a non-science magazine) at face value, current temperatures in the Northern hemisphere are well above the maximum of his MWP (by 0.3-0.4 oC). (ii) Loehle's baseline (zero oC anomaly) is not the same as those used by climate scientists, which is defined during a period where there is good overlapping proxy and direct temperature measurements. This is normally an average over a period between 1950-1990 (I think Moberg’s “zero” is a 1960-1990 average). Loehle’s “zero” was apparently set by averaging all the data over the entire near-2000 year period. So obviously to compare Loehle’s and Moberg’s temperature anomalies sensibly these have to be normalized to a common zero. You can easily do this by inspection (e.g. lining up the pre-MWP “baseline”; this is around -0.4 oC in Moberg and zero in Loehle). Rescaling Loehle to match Moberg’s zero, puts Loehle’s MWP maximum at an anomaly of ~ + 0.2 oC compared to Moberg’s of around zero. So actually, despite the dismal nature of Loehle’s reconstruction and the embarrassing errors in his analysis, Loehle’s reconstruction isn’t very different to the reconstructions done by scientists (e.g. Moberg). It shows a MWP that was ~ 0.4 (Moberg) to ~0.5-0.6 oC (Loehle) above the pre-MWP temperature anomaly, and around 0.3-0.4 oC (Loehle) to 0.5 oC (Moberg) cooler than current temperatures (in the NH). -
tobyjoyce at 17:43 PM on 25 August 2010The Strange Case of Albert Gore, Inconvenient Truths and a Man in a Powdered Wig
TOP wrote: "The Scopes trial got evolution pretty close to being the codified into law in many places. At least you can't teach or even discuss opposing viewpoints. Interestingly in this example the science has changed so much from what Darwin wrote that he would be laughed out of any current discussion on the topic." This is just not true. Scopes was found guilty and fined. The verdict was later overturned on a technicality. Steven Jay Gould later showed in an essay how school texbooks toned down the presentation of evolution after the case. It is only in retrospective (after a Hollywood movie) that the case looks like a watershed. It was the launch of Sputnik, when the US feared it was losing a technology lead in the Cold War, that revolutionised the teaching of biology. Only in recent years have the courts upheld the banning of religious subject matter (like Intelligent Design and Creationism) in American science classes. No other Western country seems to have that particular conflict. The science has changed from so much from what Darwin wrote? Darwin's observations of evolution and human descent are as fresh today as they were in 1859, and have been backed up a wealth of further studies. What he lacked was a genetic theory of how modifications are passed on. Genetics is a keystone of the Modern Synthesis, but Darwin will always be honoured as the Great Founder, and rightly so. I suppose we would have a good laugh at Galileo's physics, and Bell's primitive telephone while we are poking fun at Darwin. -
ScaredAmoeba at 15:53 PM on 25 August 2010Hansen etal hit a Climate Home Run -- in 1981
factfinder, Certainly not scientific, but a simple but compelling illustration of the infra-red activity of CO2 is shown by Iain Stewart on BBC's 'Earth: The Climate Wars' documentary. -
scaddenp at 15:20 PM on 25 August 2010Medieval Warm Period: rhetoric vs science
GC - now why would we expect a "more balanced perspective" from a paper published in E&E and commented on at CA? The errors were such that Loehle published corrections in 2008. Wouldnt be hard to find other commentary. The only cite I could find in real peer-reviewed literature being by ... Scafetta. What a surprise. Now where was the skepticism in making a critical appraisal of this paper? -
meatbeater at 14:53 PM on 25 August 2010Warming causes CO2 rise
I find it funny that we debate with such emotion over the weather. Determining whether or not human activity is the cause for global warming is also funny. Theoretically we evolved from the Earth and if considered part of the earth, then the Earth's activity causes global warming. If we want to know if anything is unusual then shouldn't we plot the data from ice-core samples in a computer and find out if the derivative of CO2 production in the last 50 years is unusual? From the data that I have seen, I would assume that we are on a cycle that has existed for the last 400,000 years. Ultimately, we should just prepare for the effects of climate change. -
gallopingcamel at 14:12 PM on 25 August 2010Medieval Warm Period: rhetoric vs science
For a more balanced perspective, one needs to compare Moberg's work that gives special weight to tree rings against Loehle's that uses the same data but assigns low weighting to tree rings. The contrast is astounding. According to Moberg the MVP anomaly is a "blip" of around 0.2 Kelvin. Furthermore, current temperatures appear to be higher than they were during the MWP. Loehle shows quite a different picture with an anomaly of around +0.6 Kelvin at 950 a.d., 0.3 Kelvin higher than today: http://climateaudit.org/2007/11/20/the-loehle-network-plus-moberg-trees/ -
scaddenp at 12:27 PM on 25 August 2010Can't We At Least Agree That There Is No Consensus?
Guys, I think we have given PT enough rope.Moderator Response: Yes, there is no progress in that discussion, so let's just agree to disagree. -
Tom Dayton at 11:44 AM on 25 August 2010Station drop-off: How many thermometers do you need to take a temperature?
daisym, understandably you misunderstand the term "dropped" in "dropped stations." It does not mean deleting the data points. For more explanation, see: 1. The second paragraph of the Intermediate version of this basic post (which is linked in the green box at the top of this page you are reading now. Be sure to click the "Intermediate" tab when you get to that page.) 2. My comments here, here, and here. 3. See an actual example of a monthly temperature raw dataset containing not just temperatures for that just-passed-month, but also a large number of data points for months and even years in the past, which are what put the bump in the older end of the distribution of number of stations reporting. If you don't trust that example, then you can download the data yourself. -
Yvan Dutil at 11:36 AM on 25 August 2010Station drop-off: How many thermometers do you need to take a temperature?
@daisym The way data are processed removing station has little impact overall. First, climatologist work with the anomaly, which is insensitive to calibration or local climatology. Second, data a weigthed on a area basis. Otherwise, world temperature would be strongly weigthed on USA. As for inclusing data of new sensor, it my not be obvious for you but this is a very tricky process. In addition, data compilation and archiving have a very low priority for grant unless it becomes obvious this is a serious problem. Scientist in every field sufer from that problem. Actually, physicist (which climatologist are a subgroup) fare better than many other type of scientist. -
robert way at 11:25 AM on 25 August 2010Arctic sea ice... take 2
No the data is not available back to then for volume from the polar science center unfortunately. -
BDS2020 at 11:00 AM on 25 August 2010Arctic sea ice... take 2
Is the data available to take the volume chart back to 1950? Would be interesting to see data for the same period for both extent and volume. -
adelady at 09:52 AM on 25 August 2010Station drop-off: How many thermometers do you need to take a temperature?
daisym. You've got the story back to front. The climate *change* science is just an extension of the physics of stable climate. Nobody thought 90 or 150 years ago that working out the physical properties of carbon dioxide (and other greehhouse gases) would lead to where we are now. When all the basics were worked out, it was just wonderful that the earth and its climate were so perfectly suited to life as we know it. It *was* a parsimonious theory. Everything that was learned about the heat absorbing and emitting capacities of CO2 (and the other gases) explained the temperature and what was known of the earth's history. It is just an accident of history that the expansion of learning has coincided with the expanding release of so much CO2 from fossilised carbon compounds. There were other non-polluting technologies available 100 years ago. Had we pursued them instead of fire based power generation, climate science now would be just an interesting side interest of ivory tower intellectuals.
Prev 2251 2252 2253 2254 2255 2256 2257 2258 2259 2260 2261 2262 2263 2264 2265 2266 Next


