


 Arguments


Recent Comments
Prev 2265 2266 2267 2268 2269 2270 2271 2272 2273 2274 2275 2276 2277 2278 2279 2280 Next
Comments 113601 to 113650:
-
Andrew Mclaren at 09:01 AM on 19 August 2010Is Arctic Sea Ice 'Just Fine'?
As a digital artist myself and one working extensively with maps, it is easy to spot a bit of Photoshop work in the first (top left) panel of Monckton's maps dated 17/01/1980. The characteristic digital artefact of Photoshop's "Polar Inversion" filter is apparent around the North Pole of that map, with the pixels in a radial pattern there. It's a pretty basic transform that allows a cylindrical map to be turned into a polar map (Stereographic or AZED-type). What's been composited there? A pretty cack-handed effort I'd say. The others may well have been retouched more convincingly. But his efforts may indeed be all about the most deliberate and flagrant red herrings to waste the maximum possible amount of everybody's time... -
michael sweet at 08:06 AM on 19 August 2010Is Arctic Sea Ice 'Just Fine'?
With regards to the denier claim that the ice is higher than predicted, we might want to revisit Dougs' post stating predicted ice values to see what was really predicted. I see values ranging from 4.2 -5.7 x 10^6km2 (the 1.0 value is not a scientific prediction). It appears that the actual value will be near the middle of that range, unless something unusual happens. WUWT predicted 5.8 10^6km2 (and then changed to 5.6), that is what is is today so their prediction was too high. -
scaddenp at 08:04 AM on 19 August 2010Temp record is unreliable
BP - no one doubts for a moment that data in the series has to be adjusted but you seem to assume that data adjustment is evidence for global conspiracy to create global warming but you havent investigated the adjustment for any single station so far as I am aware. Take Wellington. Original station close to sea level. Then it was moved to met office on top of nearby hill. ("Proof of global cooling. Adjustments arent required"). Later it was moved to airport at sealevel. ("Conspiracy to create warming by moving station. Must make adjustment"). NONE of this history is apparent in the raw data. In fact none of it accessible via internet. Since you are so sure that a station has be incorrectly adjusted, then surely the way to prove this is get the adjustment procedure from custodian and check it against the GHCN manual. None of your graphs mean anything until basis for adjustment has been audited for individual station. You can claim a coup if you find just ONE piece of fraud, so surely worth effort of writing directly to custodian and a lot more cost effective than analysis that shows that adjustments are made - we know that. Papers written on what, how, and how effective these are. -
NASA-GISS: July 2010-- What global warming looks like
As an aside - I agree with a previous poster (sorry I can't find it right now): It's very odd that some skeptics will say "We can adapt to whatever climate changes occur", and yet in the same breath say "It will destroy us to make the changes needed to reduce CO2 levels". -
NASA-GISS: July 2010-- What global warming looks like
Pete Ridley - Your statement "Humans can exert no control over this on a global or even regional basis" is both very curious and quite unsupported. We're pumping 29 GT of CO2 into the atmosphere, with noticeable effects - global warming, ocean acidification, arctic melt, etc. Some of the mitigation proposals involve equally large inputs into the climate system. Dougs links are also relevant. Throwing up ones hands and saying "We can do nothing" is simply a call to inaction. Nonsense! Changing our CO2 output is possible at fairly small cost and possibly large reward ($$$ reward, aside from the obvious benefits of avoiding more drastic climate change). Pete, you've argued both "It's not happening" and "It's happening, there's nothing we can do". I find that quite contradictory... which is it? -
Waste heat vs greenhouse warming
RSVP - the moon at the equator ranges from 100K at night to 390K peak daytime temperatures, mean of 220K (-53 °C), with the large range due to the 28 day rotation, leading to two weeks each of heating and cooling. Temps at 85 degrees N are 70K, 230K, mean 130K. The Earth temperature ranges from 184K to 331K, mean of 287.2K (14 °C). The Earth has a higher albedo than the moon - without the greenhouse effect it would be much colder. Given the diurnal differences between the Earth and Moon, comparing max temps is a red herring. Mean temps are what's relevant in comparing energy flows - I would have thought that rather obvious. As to experience - many of your postings pose extremely simple analogies that don't incorporate the actual numerical relationships in the climate; relative amounts of AHF to insolation, amounts of IR versus convection/evaporation, trying to compare heating a house to the entire atmospheric column, your rather non-physical 'flavored joules' that don't behave like other joules, etc. Those missing pieces make your analogies false comparisons, essentially Straw Men - they are confusing at best, misleading/misdirecting at worst, and don't add to the discussion. They simply don't reflect experience with the math and relationships relevant to climate change. I would encourage you to look at the actual relationships (insofar as they are understood), and consider/discuss what you might see as issues with those, rather than generating yet another ill-fitting analogy. -
JMurphy at 07:31 AM on 19 August 2010The Good, The Bad and The Ugly Effects of Climate Change
Further to the rice yield question, the figures from the UN FAO show the last two years (2006 and 2007) having declining growths of yield of under 1%, and declining growths since 2004. The figures that Berényi Péter prefers (from the USDA), show declining growth of yield since 2007 - last year given, 2008. Even using those figures, however, this decade (2000s) seems to be showing less average yearly growth of yield than any decade since the records started in 1960. -
mdenison at 07:29 AM on 19 August 2010Is Arctic Sea Ice 'Just Fine'?
2. chriscanaris: Do we have proxies for ice sheet extent predating this period? History of sea ice in the Arctic Leonid Polyak et al. This paper has a lot of information and references that may help Chris. As an example "Fig. 12. Comparison of a multi-proxy reconstruction of sea-ice extent in the Nordic Seas during 1200–1997AD" appears relevant to your question. -
mdenison at 06:37 AM on 19 August 2010Is Arctic Sea Ice 'Just Fine'?
2. chriscanaris Arctic Sea Ice (Part 1): Is the Arctic Sea Ice recovering? A reality check This post show sea ice back to the 1880's from the work of Walsh and Chapman. -
Doug Bostrom at 06:37 AM on 19 August 2010NASA-GISS: July 2010-- What global warming looks like
Happily, Russia's heatwave is set to end today, after a final excursion reaching 93F. Less happily, Pakistan's trial by rain continues. See Jeff Masters' blog for details. -
Doug Bostrom at 06:22 AM on 19 August 2010NASA-GISS: July 2010-- What global warming looks like
Pete, historical temperature records have been broken in many places across the globe this year. Seizing on the omission of a qualifier in a single sentence in a blog comment does not change that fact. Past changes in climate or the notion that we are unable to modify the climate somehow gets us off the hook today are ill-founded ideas and do not affect physical facts today. Here are some places you can take those arguments if you wish to pursue them: What does past climate change tell us about global warming? Are humans too insignificant to affect global climate? In fact, the historical record does say this year is unusual and as well the past 10 years exhibit a notable statistical aberration in terms of extreme heat records. You can repeat over and over again that you don't believe so, but the numbers written in meteorological records will not change as a result. As to the statistical probability of Russia's heatwave, that's been looked at and of course it's possible to draw some conclusions. Here's a professional meteorologist's description of how it's done, using only the month of July as an example. Taking the whole pattern of this summer's weather over Russia into account, odds of such an occurrence lie somewhere between 1:1000 and 1:3000. See a treatment of the anomalous heat from June leading into August here. -
muoncounter at 06:11 AM on 19 August 2010Is Arctic Sea Ice 'Just Fine'?
#2: "defying trends with a summer melt less than predicted" That sounds like the kind of misconception posted around denier sites who happily pore over these curves. What do they fail to notice in graphs such as this? Everybody looks at the 2007 curve and concludes that the melt amount is less because all other curves are well above that minimum. However, look where the yellow and red curves start the melt season: at a value well above the black curve. Its the difference between annual max and annual min that counts. If the prior year's max extent is greater and the mins are close, the melt amount is in fact increasing.
#6: "in the context of climate change, thirty years is really too short a time span."
A sea ice reconstruction going back to 1870 is available here. The min extent (column 4) is fairly flat thru 1950, then begins falling at an increasing rate. Is it just coincidence that the CO2 (ice core+atmospheric composite) curve begins taking off at about the same time?
But why should that matter? If 30 years of decreasing extent isn't enough to establish the problem, how will presenting more make any difference?
Everybody looks at the 2007 curve and concludes that the melt amount is less because all other curves are well above that minimum. However, look where the yellow and red curves start the melt season: at a value well above the black curve. Its the difference between annual max and annual min that counts. If the prior year's max extent is greater and the mins are close, the melt amount is in fact increasing.
#6: "in the context of climate change, thirty years is really too short a time span."
A sea ice reconstruction going back to 1870 is available here. The min extent (column 4) is fairly flat thru 1950, then begins falling at an increasing rate. Is it just coincidence that the CO2 (ice core+atmospheric composite) curve begins taking off at about the same time?
But why should that matter? If 30 years of decreasing extent isn't enough to establish the problem, how will presenting more make any difference?
-
Pete Ridley at 05:39 AM on 19 August 2010NASA-GISS: July 2010-- What global warming looks like
I am puzzled as to why my comment was removed but have modifeid it slightly and hope that it stays posted this time. Doug, “ .. if you dig into records you'll see that .. “ the world has experienced warming and cooling numerous times before and almost certainly will continue to do so. We have been coming out of an ice age for a few thousand years so it is bound to be warming up. It would have done this even if we had never found a use for oil or coal or gas. Changes to global climates have been going on since the beginning, as a result of natural (not human) processes and drivers. Global climates change drastically as a result of long periods of bitterly cold and pleasantly warm. We are presently in between these two extremes of global temperature conditions but have no idea for how long. Humans can exert no control over this on a global or even regional basis. All that we can hope to achieve is what we have always had to do, react to and protect against such changes as best we can. You say “ .. all-time high records were set pretty much across Russia from St. Petersburg to Siberia. ..” Since worthwhile temperature measurement only started in the 1700s it is difficult to accept that as gospel. The historical record tells us that there is nothing unusual about current weather events around the globe. According to the 2004 paper “Geography of Droughts and Food Problems in Russia (1900-2000)” (Note 1) by Golubev and Dronin, Department of Geography, Moscow State University, the “Numbers of years with droughts in the main economic regions of the Russian Federation in 1891-1983” are: - North West 21, - Central 29, - Central Chernozem 32, - Northern Caucasus 24, - Volga-Vyatka 32, - Volga 28, - Urals 28, - West Siberia 18 Joe Romm quotes from the Russian Met. Centre “There was nothing similar to this on the territory of Russia during the last one thousand years in regard to the heat.” (Note 2). The validity of that claim needs substantiation. I’m not aware that there was a mechanism for measuring heat as long ago as that. Can you advise on this? According to “Across the Nations .. the World’s Worsts Disasters” (Note 3), floods occurred in China in: - 1642 Flooding takes about 300,000 lives. - 1887 The Yellow River overflowed, causing the death of about 900,000 people. - 1911 Yangtze River flood - approx: 100,000 deaths. - 1931 A flood on the Changjiang River took at least 145,000 people - 1935 Another Yellow River flood "caused 27 counties inundated and 3.4 million victims". There is no reason to believe that the future will be any different, regardless of how much fossil fuel we continue to use. As for the two beautiful graphics in Joe Romm’s article comparing 2003 & 2010 (and the one above), I prefer this couple for 1936 and 2010 (Note 4). NOTES: 1) see http://www.usf.uni-kassel.de/ftp/dokumente/projekte/droughts_and_food_in_russia.pdf 2) see http://climateprogress.org/2010/08/09/russia-heat-wave-one-thousand-years-global-warming/ 3) see http://across.co.nz/WorldsWorstDisasters.html 4) see. http://www.c3headlines.com/2010/08/nasas-giss-moscow-is-burning-human-co2induced-unprecedented-global-warming-is-to-blame-not.html Best regards, Pete Ridley -
RSVP at 05:35 AM on 19 August 2010Waste heat vs greenhouse warming
KR 222 single number for you, KR +125 C. Surface temperature of on the Moon. Explain how it gets so hot without GHGs.? That aside, I just happen to have "experienced" 25 years in engineering labs. Hands-on. doug_bostrom To answer your question, you can respond if you please. -
eric144 at 05:21 AM on 19 August 2010Is the sun causing global warming?
Jasper Kirkby, a British experimental particle physicist currently with CERN, Switzerland presents a lecture in which cosmic rays show a strong correlation with global temperature over short and long time periods. He is currently involved in research on their effects on clouds at CERN..... Some of these reconstructions show clear associations with solar variability, which is recorded in the light radio-isotope archives that measure past variations of cosmic ray intensity. However, despite the increasing evidence of its importance, solar-climate variability is likely to remain controversial until a physical mechanism is established. http://cdsweb.cern.ch/record/1181073 Jasper Kirkby is a British experimental particle physicist currently with CERN, Switzerland. He originated the idea for the Tau-Charm Factory, an accelerator now under construction as BEPC II in Beijing. He has led several large particle accelerator experiments at SPEAR; the Paul Scherrer Institute; and most recently, the CLOUD experiment at CERN. http://en.wikipedia.org/wiki/Jasper_Kirkby Results from CLOUD are expected soon. -
Doug Bostrom at 04:51 AM on 19 August 2010Is Arctic Sea Ice 'Just Fine'?
W/regard to Chris' concern about what we know of past Arctic sea ice extent, not surprisingly this has been a subject of research. Thanks in part to fanatical peering through microscopes at diatom and foraminifera skeletons, past sea ice extent can be teased out of the record. Assessing inter-decadal conditions stretches reconstruction skills but there is enough detail in the record to begin making comparisons between today's conditions and past patterns of behavior of Arctic sea ice. We're not really in the dark on this. Past extent of sea ice in the northern North Atlantic inferred from foraminiferal paleotemperature estimates Sea ice variations in the central Canadian Arctic Archipelago during the Holocene A biomarker-based reconstruction of sea ice conditions for the Barents Sea in recent centuries Arctic climate change: observed and modelled temperature and sea-ice variability Palaeoceanography and climate changes off North Iceland during the last millennium: comparison of foraminifera, diatoms and ice-rafted debris with instrumental and documentary data Abrupt climate changes for Iceland during the last millennium: evidence from high resolution sea ice reconstructions Arctic environmental change of the last four centuries Past glacial and interglacial conditions in the Arctic Ocean and marginal seas-a review -
tobyjoyce at 04:22 AM on 19 August 2010Is Arctic Sea Ice 'Just Fine'?
Arctic Ice extent is only less than predicted if you are talking about a LINEAR trend. However, as Tamino showed, it fits a quadratic trend pretty well, implying an acceleration in recent years.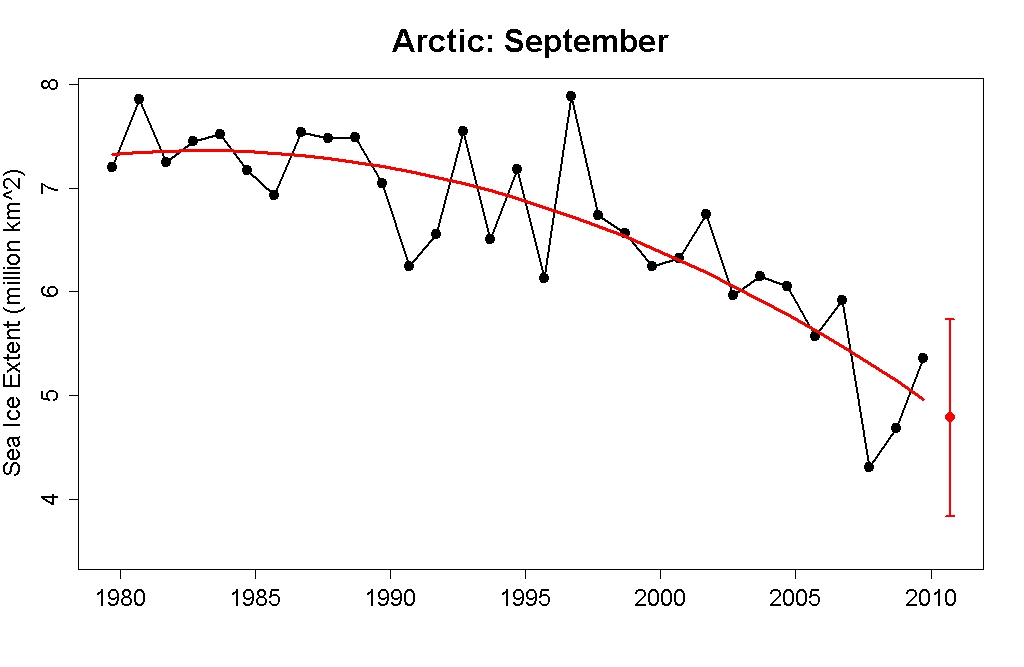
-
CBDunkerson at 04:02 AM on 19 August 2010Is Arctic Sea Ice 'Just Fine'?
Chris, the skeptic claim that global sea ice is increasing is, like the others you cited which have already been addressed, simply false; Global trend If you look at the red anomaly data on that graph you'll see that on the left the anomalies rarely dipped below the baseline... while on the right they seldom rise above it. In short, the anomaly trend for global sea ice area is very clearly decreasing. Also, the fact that Arctic sea ice extent does not set a new record low every year is not indicative of a 'recovery'. Indeed, the fact that the Arctic sea ice volume (the actual AMOUNT of ice... as opposed to how 'spread out' it is) has continued to plummet shows just how ridiculous that claim is. -
Doug Bostrom at 03:46 AM on 19 August 2010Waste heat vs greenhouse warming
Here's a meta-question. RSVP-- taken as a contraction, what do the letters mean? -
Berényi Péter at 02:21 AM on 19 August 2010The Good, The Bad and The Ugly Effects of Climate Change
#61 JMurphy at 01:21 AM on 19 August, 2010 two knowledgeable sources linked to above say one thing, and you assert another. Who to accept as knowing more on this subject, I wonder? Accept the truth and nothing but, of course. From 2002 to 2008 average annual growth of yield was 1.62%, growth of production 2.69%/annum. Click on images for the respective spreadsheets.
-
owl905 at 02:09 AM on 19 August 2010Is Arctic Sea Ice 'Just Fine'?
chriscanaris, the main problem with reading your comments are that you try to score a point without doing any homework - leveraging the assumption of no useful pre-1979 data into undermining the observations of decline. There is no 'defying trends', a cold spell in the Arctic is obvious - when it's covered in smoke (http://www.ssd.noaa.gov/PS/FIRE/DATA/SMOKE/2010H050457.html) is typical of a hoodwink. Any research at all would have shown you that Antarctic sea-ice isn't a proxy for cooling, and the trend is flat, with a very very small increase as a trend. The worst problem, however, is that after demonstrating little of your own reseach, you conclude there's similar 'cherry-picking' from the two sides (that's a symptom of anti-science syndrome). Just so there's no confusion about the lack of homework your post represents, a 101 start is Wikipedia:- http://en.wikipedia.org/wiki/Measurement_of_sea_ice Then move up to the NSDIC data that's graphed back to the early 50s - and shows the late 70s as the start of more than just satellite records. http://nsidc.org/sotc/images/mean_anomaly_1953-2009.png http://nsidc.org/sotc/images/mean_anomaly_1953-2009.png In fact, the article pointing out the ugly state of the arctic (as opposed to the 'just fine' joke) is bang on. -
gpwayne at 01:42 AM on 19 August 2010The Good, The Bad and The Ugly Effects of Climate Change
Could we also bear in mind that rice paddies are starting to be contaminated by salt water contamination from rising sea-levels, destroying all current and future potential. The agricultural impacts of climate change are complex, nuanced and interlinked, and not simple at all. -
JMurphy at 01:21 AM on 19 August 2010The Good, The Bad and The Ugly Effects of Climate Change
Berényi Péter wrote : "No, it is not. The transient setback between 1999 and 2002 has nothing to do with climate change and everything with market forces. After 2002 growth resumed at a slightly faster pace than before." From a different page in your own link : A major reason for the imbalance between the long-term demand and supply is the slowing growth in yield, which has decreased substantially over the past 10–15 years in most countries. In South Asia, average yield growth decreased from 2.14% per year in 1970-90 to 1.40% per year in 1990-2005. In some years, this has been below 1%. Yield growth in Southeast Asia has decreased similarly. In the major rice-growing countries of Asia, yield growth over the past 5–6 years has been almost nil (Figure 4). Globally, yields have risen by less than 1% per year in recent years. And I just want to re-post what I posted previously, in case anyone missed it : There has been a major decline in world rice production since late 2007 due to many reasons including climatic conditions in many top rice producing countries as well as policy decisions regarding rice export by the governments of countries with considerable rice production. Rice Trade So, two knowledgeable sources linked to above say one thing, and you assert another. Who to accept as knowing more on this subject, I wonder ? -
Waste heat vs greenhouse warming
A single number for you, RSVP - 33°C. That's the difference between the temperature of the earth with and without the greenhouse effect. It's 33°C warmer - not cooler. Note that relative nighttime warming, more than daytime warming, is one of the classic indicators of an increasing greenhouse effect - and that is exactly what is observed. Contrary to your last posting. You've presented arguments by analogy, RSVP - the numbers, however, prove you incorrect. Look at the energy budget - 80% of energy coming from the temperature of the Earth leaves as IR, only 20% as convection/evaporation. Only 1% of the energy present comes from anthropogenic heat flux. You are incorrect. What's I'm seeing (IMO) is the unfortunately common "Common Sense" logical error. Many people discussing science try to project their personal, local experiences upon large scale or unfamiliar systems - quantum mechanics, climate change, electromagnetics, etc. The problem is that local personal experiences do not map 1-1 with other, complex systems, and hence "common sense" will lead you astray. If you don't try to understand the complex systems as they exist, rather than projecting your daily experiences onto them, you will quite simply be wrong. As above... -
skywatcher at 00:29 AM on 19 August 2010Is Arctic Sea Ice 'Just Fine'?
chriscanaries - Arctic ice melt does not seem to be much less than expected to me, in that according tot he latest IJIS data we're at 5.83m sq km, with a loss rate that has been steadily above 50-60,000sq km since mid-July. We're closely tracking 2008's extent, which would lead to the 2nd or 3rd lowest in the record. As for Arctic temperatures, maybe others here can confirm (or corrent me if I have it all wrong), but so far as I understand it, the Arctic air temperature in summer is not a good guide to warmer/cooler conditions. When you look at the Arctic temperature graph (>80deg N is the skeptics favourite), you see it flattens out during summer months, rather than smoothly heading to a peak several degrees higher. The reason for this is that much of the energy that would otherwise be warming the air temperature is being used up in melting ice (latent heat of melting), and so this holds temperatures close to freezing until all the ice is melted away. North of 80deg N the ice does not melt out entirely (at least for now), so temperatures are held down all summer. Thus a tempeature around 1C in the Arctic may only tell you that ice is melting, not whether it's much warmer or colder than previous years. -
tobyjoyce at 00:23 AM on 19 August 2010Is Arctic Sea Ice 'Just Fine'?
Here's a scary thing. This is a graphic from the IPC TAR of 2001 Are my eyes deceiving me, or is the Actic Ice minimum extent for the last few years much closer to the 2040-2060 scenario than the one projected earlier?
Here is an image from a few days ago (white is 100% concentration, declining to blue <~30%):
Are my eyes deceiving me, or is the Actic Ice minimum extent for the last few years much closer to the 2040-2060 scenario than the one projected earlier?
Here is an image from a few days ago (white is 100% concentration, declining to blue <~30%):

-
adelady at 00:19 AM on 19 August 2010The Good, The Bad and The Ugly Effects of Climate Change
Hang on a minute, BP, did you read the article I cited? It has nothing to do with world markets. It's about continuous records of productivity on 227 individual irrigated farms in 6 Asian countries. Over 25 years, productivity on those farms decreased by between 10% and 20%. -
daniel at 00:06 AM on 19 August 2010It's a 1500 year cycle
No one seems to be interested in a discussion about the quality of data presented in this video. I would like to add to my above comment that the error in assigning years to layers in any ice core is intrinsically cumulative. If you assume a conservative error estimate of say 1%. That is only 1 in every 100 annual layers is misassigned, then at 50 kyr BP when the most recent of the most striking DO events are suppossed to be taking place you have a +/- 500 year window within which you can align peaks. Given the peaks are so difficult to distinguish in time as they are currently portrayed, what does that tell you about the quality of work in the field of "Climate science"? Even in their current format the two datasets are not opposed but actually aligned at the first DO event at ~90-95kyr BP! But the video is trying to say they are not! Even the trail off from this initial "global" peak is the same in both hemispheres! The further in time we go back from 50kyr the worse (more cumulative) the error. Are there any obvious or striking DO events between 0 and 50 kyr BP? Even at 1% error is there a large enough window to align the supposedly bipolar peaks in this more recent region of time? Are we being too conservative at 1% error? Is "Climate science" really science? -
Anne-Marie Blackburn at 23:42 PM on 18 August 2010Is Arctic Sea Ice 'Just Fine'?
Chris, The problem is that we can only deal with the data we have. Satellite data over the past 30 years give us a clear picture of what's happening. Knowledge of past Arctic changes are not needed to draw conclusions about what's happening now. I agree that it would be interesting to have data for other periods but we don't - or I'm not aware of such data. However, the point of this article was specifically to highlight the outrageous cherry-picking by Monckton, which is as unscientific as it gets. -
Berényi Péter at 23:41 PM on 18 August 2010The Good, The Bad and The Ugly Effects of Climate Change
#51 adelady at 20:04 PM on 18 August, 2010 The major decline in rice production in recent years appears to be, again, a continuation of a long-term trend. No, it is not. The transient setback between 1999 and 2002 has nothing to do with climate change and everything with market forces. After 2002 growth resumed at a slightly faster pace than before.
*USDA data via IRRI (International Rice Research Institute)
BTW, the market is absolutely inadequate for providing reasonable food security. It's because food is a special commodity in that if consumers are denied of it for a couple of months, they get permanently removed from the market (because the dead neither eat nor can make money). World food stockpile is at an all time low, it can cover consumption only for two or three months. It means we are just a single major volcanic eruption away from a global disaster unprecedented in human history. This is because governments utterly fail to take due responsibility and neglect public food stockpiling recommendations described in this paper (stocks for seven years are needed). A natural phenomenon like that might be good news for the environment, albeit very bad for everyone else. -
jonathansf13 at 23:37 PM on 18 August 2010Is the sun causing global warming?
Here is a more comprehensive article on cooling of the mesosphere and thermosphere: Beig, G., et al., Review of mesospheric temperature trends, Rev. Geophys., 41(4), 1015, doi:10.1029/2002RG000121, 2003. These are not easy reading, but they represent the best scientific work to date that I am aware of. -
chris1204 at 23:35 PM on 18 August 2010Is Arctic Sea Ice 'Just Fine'?
Anne-Marie, I have no quarrel with the trends over thirty years which your post deals with. However, in the context of climate change, thirty years is really too short a time span. After all, the MWP and LIA (be they localised or global phenomena) are substantial climatic events which took place over many years. It would be interesting to know if we have any way of tracking sea ice extent at those times. For example, if we had evidence that sea ice extent was greater in the MWP than today...? Hence, my question regarding proxies over recent centuries. Reference to such data if available would make the argument more robust. -
John Brookes at 23:33 PM on 18 August 2010Is Arctic Sea Ice 'Just Fine'?
Thanks Alden. Once again, the full presentation on Fool Me Once is brilliant. I'm surprised that his lordship's lawyers haven't been in touch with you yet! On a serious note, Monckton's cherry picking is scandalous, particularly just focussing on the rebound in the September minimum from 2007 to 2009. If you look back to 1990 - 1992, you will find a remarkably similar rebound, followed by, oh yes, a continued decline. -
mehus at 23:21 PM on 18 August 2010Is Arctic Sea Ice 'Just Fine'?
I also love how Monckton picks a graph from Jan 1980 that has NO snow on it. I mean, look at all the snow in the 2009 graph. It looks soooo much colder to me! -
jonathansf13 at 23:20 PM on 18 August 2010Is the sun causing global warming?
Stratospheric cooling: Ramaswamy, V., et al. (2001), Stratospheric temperature trends: Observations and model simulations, Rev. Geophys., 39(1), 71–122, doi:10.1029/1999RG000065. Mesosphere-Lower Thermosphere: She, C. Y. et al. (2009), Long-term variability in mesopause region temperatures over Fort Collins, Colorado (41°N, 105°W) based on lidar observations from 1990 through 2007, J. Atmos. Solar-Terr. Phys., 71, 1558-1564. See also: Roble, R. G., and R. E. Dickinson (1989), How will changes in carbon dioxide and methane modify the mean structure of the mesosphere and thermosphere? , Geophys. Res. Letters, 16, 1441–1444. -
Eric (skeptic) at 23:11 PM on 18 August 2010The Good, The Bad and The Ugly Effects of Climate Change
Dappledwater thanks. Fact from table 1: rice yields are increasing everywhere. But the paper shows that the growth rate is decreased due to warmer nighttime temperatures and could turn into decreases in the future. Ann, "Such greening of the Sahara/Sahel is a rare example of a beneficial potential tipping element." From http://www.pnas.org/content/105/6/1786.long -
jonathansf13 at 23:06 PM on 18 August 2010Is the sun causing global warming?
Should the sun be the primary driver of climate change, the atmosphere would heat throughout, from the ground to the thermosphere. However, we know that the stratosphere is cooling, and there is also evidence of cooling in the mesosphere-lower thermosphere, which is what enhanced greenhouse warming would cause. I will look up some references for these and add them later. -
Ann at 23:05 PM on 18 August 2010The Good, The Bad and The Ugly Effects of Climate Change
Today I encountered the following claim: "Due to climate change the southern border of the Sahara has moved northwards (by 50-60 kilometers), resulting in new rain forest the size of France and Germany put together." Has anyone heard this claim before, and are there any reliable reports to back up this claim ? Or is it nonsense ? If it is true, it would definitely be a benefit of global warming. -
JMurphy at 23:00 PM on 18 August 2010NASA-GISS: July 2010-- What global warming looks like
Pete Ridley, you need to read a bit more widely on this site, especially Climate's changed before, It's just a natural cycle, and Humans are too insignificant to affect global climate With regard to ice ages, see this : Next Ice Age Delayed by Global Warming, Study Says -
Ken Lambert at 22:56 PM on 18 August 2010Is the sun causing global warming?
Yes it is. Integrate the area under the TSI curve and you will get an increasing accumulation of energy added to the biosphere. Constant elevated TSI above a baseline will give linear increase in energy accumulation. Throw in a few non-linear but small energy absorption processes such as ice melt and evaporation and possibly some positive feedbacks from CO2GHG, cooling aerosols and clouds and you might bump the temperature curve around a bit mid century but produce a roughly linear temperature rise for the last 80 years. -
Rob Painting at 22:56 PM on 18 August 2010The Good, The Bad and The Ugly Effects of Climate Change
Just for Eric, the study referred in in post #51 Rice yields in tropical/subtropical Asia exhibit large but opposing sensitivities to minimum and maximum temperatures -
Anne-Marie Blackburn at 22:55 PM on 18 August 2010Is Arctic Sea Ice 'Just Fine'?
Chris, Cherries may be nice, but picking two or three data points to make your point is taking it a tad too far. Three decades is long enough to detect a trend - if you include all data points that is. Here are good, recent posts on the Arctic and Antarctica. There are plenty more if you do a search. -
Eric (skeptic) at 22:39 PM on 18 August 2010The Good, The Bad and The Ugly Effects of Climate Change
Rice yield growth is down, in Asia especially and is considered to be a serious problem. There are numerous articles on it like this http://english.peopledaily.com.cn/90001/90777/90856/6571461.html But yields have not declined anywhere. The quantitative statement in the link in post 51 is about a decline in yield growth. The other statement that "rice yields drop" is not based on any collected statistics of rice farm yields. It may well be some sort of experiment that they ran, but the article doesn't say. The statement is not quantitative and not sourced. -
JMurphy at 22:39 PM on 18 August 2010The Good, The Bad and The Ugly Effects of Climate Change
I suppose the production of rice would benefit slightly from rising sea-levels - if only it wasn't for the extra methane production and the declining yields due to rising temperatures. In other words, as the article states : "...showing that most climate change impacts will confer few or no benefits, but may do great harm at considerable cost." -
chris1204 at 22:23 PM on 18 August 2010Is Arctic Sea Ice 'Just Fine'?
Well,we all like cherries. Arctic ice however seems to be doing some strange things. Part of the problem lies in the fact that our only reliable record goes back to the 1970s with the advent of satellites. Other records seem to go back no further than the 1870s. Do we have proxies for ice sheet extent predating this period? Currently, it seems to be defying trends with a summer melt less than predicted while Arctic temperatures appear to be below average (if I'm to believe the sceptics). On the other hand, Antarctic sea ice seems to be growing with a net increase in world sea ice (again, if I take sceptical sources at face value). I appreciate the Greenland ice sheet mass seems to be declining as is the Antarctic land ice sheet and I'm aware of the instability in the West Antarctic peninsula. So which cherries do I pick? Proxies for pre 1870s ice sheet extent if available would be helpful in placing today's behaviour in perspective. -
Anne-Marie Blackburn at 21:54 PM on 18 August 2010Is Arctic Sea Ice 'Just Fine'?
Fantastic post that perfectly illustrates the problem of the cherry-picking done by contrarians and the need to look at trends rather that single points. -
Alexandre at 21:50 PM on 18 August 2010Long Term Certainty
About Moderator´s response at #7: I have also noticed this "alarmism against mitigation" here and there. For those, any change in the climate is manageble, even if science shows it´s probably unprecedented in human history. Any interference in the use of fossil fuels, on the other hand, is doom - even if phased out in the pace of generations. -
Craig Allen at 21:43 PM on 18 August 2010Is the sun causing global warming?
Hey Marcus, I'm aware of all that. I'm just suggesting that all three need to be covered in one post because I've pointed people at the intermediate version of this post before and immediately had them come back at me with those other arguments, which I then had to hunt down refutations for. It would be handy to have it all explained succinctly in the one page is what I'm suggesting. -
Tony Noerpel at 21:41 PM on 18 August 2010Is the sun causing global warming?
John I know this is correct and agrees with a rather famous figure from Max Planck Inst but could you provide references for your data? Tony -
CBDunkerson at 21:36 PM on 18 August 2010Long Term Certainty
Pikaia, as we go further out the total amount of fossil fuels we will end up burning and long term climate feedback effects play a bigger and bigger role... making the eventual maximum highly uncertain. Even the rate at which we burn fuels would play a significant part as the oceans could absorb most of the extra CO2 if given enough time to disperse it rather than the ocean surface always being saturated. That said, I recall a worst case scenario study in New Scientist based on burning all available fossil fuels coming out to about 13 C by 3000 AD. Sticking just to known conventional reserves would top out around 7 C. Since then Canada has gone big into tar sands and deepwater drilling is becoming commonplace... so we're looking at exceeding 'conventional reserves' unless things change.
Prev 2265 2266 2267 2268 2269 2270 2271 2272 2273 2274 2275 2276 2277 2278 2279 2280 Next


