


 Arguments


Recent Comments
Prev 2395 2396 2397 2398 2399 2400 2401 2402 2403 2404 2405 2406 2407 2408 2409 2410 Next
Comments 120101 to 120150:
-
Unprecedented Warming in Lake Tanganyika and its impact on humanity
Si >"doug you need good data. One tree does not a hockey stick make ;-)" You are misunderstanding Willis's argument. It's not that the reconstruction is "bad" per se, but that it hasn't been calibrated to surface temperatures. This suggests that the record may be off from absolute correct temperatures by a certain factor. That factor would remain constant however, so the overall shape of the trend (which is what we are interested in) would not be affected. This is the point that doug is making. >"You are going to have to wait for Anthony's surface station report but it is coming!" Thanks, we know. He's been promising it for a long time now. Ask yourself this: why does Watts spend so much time documenting "bad" weather stations, but never bothers to plot the temperature records of "bad" stations vs. "good" stations? It's a rather trivial thing to do. In any case, we don't have to wait for his report, others have done the work for him. You can read about the results here, and John's posts here and here. As it is off topic from this post, please post any followups to the weather station discussion to one of those two posts. -
Albatross at 08:55 AM on 23 May 2010Unprecedented Warming in Lake Tanganyika and its impact on humanity
From Tierney et al's web page: "What about Geothermal heating? Isn’t Tanganyika in a rift zone? Could that be responsible for the warming? Lake Tanganyika is indeed part of the East African rift system. But there is no evidence for increased deepwater volcanic activity in the lake in the 20th century. In 1971, a survey team found that the rate of geothermal heat flux in Tanganyika was 0.04 watts per meters squared, close to the global average (Degens et al., 1971, Naturwissenschaften). That’s 10-fold less than the estimated heat absorption of the lake since 1913 thought due to global warming (0.4 watts per meters squared; Verburg and Hecky, 2009, Limnology & Oceanography). What is more, were there increased volcanism we would detect a change in the water chemistry of the lake (which has not been observed), plus we would see a thermal “inversion” - warmer waters in the depths of the lake. In fact, as you can see below from an inset graph from our Nature Geoscience paper, the deep portion of the lake (hypolimnion) is cooler than the surface and middle-portion of the lake (110 meters depth) and the deep waters are warming more slowly than the surface waters. This is consistent with a heating source from above - not below - the lake." -
Albatross at 08:53 AM on 23 May 2010Unprecedented Warming in Lake Tanganyika and its impact on humanity
Si, SS and johnd, How many Vostok ice cores were made? And I am not talking about individual core samples. How about EPICA? At how many locations did they drill cores for those projects? Regarding the red herring of hydrothermal actvity. Authors addressed that see #79. Also, have you thought for a minute that those vents have probably been present for millenia, and that they are on the lake bottom and the authors are talkiing about warming of LST. That is akin to Monckton claiming that El Ninos are caused by undersea volcanoes, or thinking that that undersea volcanoes explain the increase in 0-2000 m glbal OHC. If the lake was being warmed from below, the lower depths would have locally been warming at a rate much higher than has been observed and the LSTs would not be consistent with the surrounding SATs, which they are. These data have clearly not been contaminated by hydrothermal activity. Really guys, you are grasping at straws and it is all too painfully apparant. SS says s/he has spent a few days looking at this on the internet. Wow, really? Scientists have devoted careers and students 5-6 years of their PhDs studying this issue and thereby reading hundreds, if not thousands, of papers. Not to mention that this paper was reviewed and critiqued by their peers, who are experts in the field. The contrarians do not like the findings because they are yet more evidence that AGW is an issue and add to an already coherent and cohesive picture. So the best they can do is to try and make some rather lame attempts undermine the scientists' credibility. Johnd @100, "LOL. Has anyone happened to notice that this study is basically about fishing for sardines?" Please gorow up and show some respect. If you have not noticed the obvious, we have not had thermometers around for anywhere close to 1500 years, nevermind isolated equatorial regions in Africa. Tierney is probably reading some of the contrarian comments on this read and shaking her head in disbelief, and who can blame her. And for those willing to accept Eschenbach's "critique" of the Tierney et al. paper at face value, I would caution you against doing so. Willis has a reputation for, how shall I say this, for playing loose with the facts as has been shown several times by Dr. Lambert and others. That and the fact that he is not an expert in this field. EOS. -
Si at 08:52 AM on 23 May 2010Unprecedented Warming in Lake Tanganyika and its impact on humanity
doug you need good data. One tree does not a hockey stick make ;-) Saying over and over that it is just 'the big picture see the trees dont mind the quality feel the width' is entirely missing the point. You are going to have to wait for Anthony's surface station report but it is coming! -
Si at 08:48 AM on 23 May 2010There is no consensus
And here is his comment after the conference: "I’ve just returned from the Heartland Institute’s Fourth Annual Climate Conference, at the Marriott Hotel in Chicago, where something very interesting was emerging: a clear counter-consensus on climate change. Of 700+ delegates, 400 or so were scientists in relevant disciplines – arguably more than on the IPCC’s much vaunted panel (after you allow for non-scientists, scientists in irrelevant disciplines, and dissenting reviewers). These scientists came from around the world, and from highly respected academic institutions. They were by no means unanimous, but all (except for two token Warmists) agreed that the IPCC “consensus” is deeply flawed, and that the policy prescriptions based on the IPCC’s work are extremely unlikely to deliver significant results." Looking forward to reading Robert Carters new book 'Climate -the Counter Consensus' -
Unprecedented Warming in Lake Tanganyika and its impact on humanity
johnd > The method they used to arrive at their conclusion was to measure an indicator (BSi)of the lakes productivity (at one sole location) and correlate that with already reconstructed global temperatures. You are missing a key detail, they also used the TEX86 temperature proxy to reconstruct lake temperatures for the past 1500 years. This is a separate method from the measurement of BSi; it is a temperature proxy, not a proxy of productivity like BSi. This yields three independent measurements: lake temperature record, global temperature record, and lake productivity. they found that all three of these measures correlate with one another, hence their conclusions. > If the objective was merely to make the connection between the lakes surface temperature and global temperatures, would not it have been better just to check the temperature records from relevant locations around the lake? The temperature record doesn't go back 1500 years. -
Si at 08:42 AM on 23 May 2010There is no consensus
This is relevant to this topic. It is from Roger Helmer talking before the 4th International Conference on Climate Change which he recently attended. Of the 80 speakers, I noticed that fully forty-five were qualified scientists from relevant disciplines, and from respected universities around the world -- from the USA, Canada, Mexico, Russia, Sweden, Norway, UK, Australia and New Zealand. All of them have reservations about climate alarmism, ranging from concerns that we are making vastly expensive public policy decisions based on science that is, to say the least, open to question, through to outright rejection of the Anthropogenic Global Warming (AGW) model. Several of these scientists are members or former members of the IPCC Intergovernmental Panel on Climate Change. But how do 45 sceptical scientists stack up, you may well ask, against the 2500 on the official IPCC panels? But of course there aren't 2500 relevant scientists on the IPCC panel. Many of them are not strictly scientists at all. Some are merely civil servants or environmental zealots. Some are economists -- important to the debate but not experts on the science. Others are scientists in unrelated disciplines. The Chairman of the IPCC Dr. Ravendra Pachuari, is a Railway Engineer. And of the remaining minority who are indeed scientists in relevant subjects, some (like my good friend Prof Fred Singer) have explicitly rejected the IPCC's AGW theory. Whittle it down, and you end up with fifty or so true believers, most of whom are part of the “Hockey Team” behind the infamous Hockey Stick graph, perhaps the most discredited artefact in the history of science. This is a small and incestuous group of scientists (including those at the CRU at the University of East Anglia). They work closely together, jealously protecting their source data, and they peer-review each other's work. This is the “consensus” on which climate hysteria is based. And there are scarcely more of them than are sceptical scientists at this Heartland Conference in Chicago, where I am blogging today. Never mind the dozens of other scientists here in Chicago, or the thousands who have signed petitions and written to governments opposing climate hysteria. Science is not decided by numbers, but if it were, there is the case to be made that the consensus is now on the sceptical side. -
Doug Bostrom at 08:24 AM on 23 May 2010Unprecedented Warming in Lake Tanganyika and its impact on humanity
...would not it have been better just to check the temperature records from relevant locations around the lake? You mean from the instrument shacks installed in the year 1000? No, that's not possible. You'd need a proxy for that. Maybe a core from the lake bottom? To summarize once again my objection to your objection, "I doubt it" is not a useful contribution. Si, you leave unaddressed the issue that Willis is obsessed with accuracy when accuracy is not the point. Same mistake as with the failed thermometer inspection project run by WUWT, debunked for the same basic reason Willis' critique of Tierney is pointless. -
Unprecedented Warming in Lake Tanganyika and its impact on humanity
Si >"And AGW getting stronger? More like DOA." Considering the theory was built up slowly and methodically over the better part of a century, I fail to see how it is "DOA". To exand on dhogaza's comment on what constitutes a significant percentage of climate scientists, please see John's post on scientific consensus. -
johnd at 08:10 AM on 23 May 2010Unprecedented Warming in Lake Tanganyika and its impact on humanity
doug_bostrom at 07:07 AM, actually a lot did go wrong with the samples, both at the top and the bottom. That is why only a portion of each was used, the equivalent of more than one core apparently discarded. As well, extrapolation was needed to date the bottom portion of the used portion as there was some reversal of age indicated at depth. -
dhogaza at 08:07 AM on 23 May 2010Unprecedented Warming in Lake Tanganyika and its impact on humanity
Si... "doug. I dont think Willis makes the mistake you mention. He is having a critical look at Jessica's paper - thats what scientists do." Scientists do it competently. Willis is no scientist, and his personal track record is one of incompetency, so I for one won't bother to read his piece at WUWT (or elsewhere). " I think there are rather more skeptical climate scientists than you realise. - Spencer, Michaels, Christy" I could've sworn there were at least a dozen (/snark). Si clearly doesn't understand that three (or a dozen) vs. thousands isn't exactly a large percentage ... -
johnd at 07:58 AM on 23 May 2010Unprecedented Warming in Lake Tanganyika and its impact on humanity
doug_bostrom at 07:07 AM, which particular congruency are you referring to? -
Si at 07:48 AM on 23 May 2010Unprecedented Warming in Lake Tanganyika and its impact on humanity
doug at 92 - I think you answer your own question! If Willis & the commenters at WUWT are right and the the data is poor then any conclusion is invalid. e and Phila, 94 and 95. I think there are rather more skeptical climate scientists than you realise. - Spencer, Michaels, Christy And AGW getting stronger? More like DOA. Maybe you meant climate science - yes it will get stronger. I think the AGW argument is basically is lost. But that does not mean that all climate science is duff. It does mean it should be completely separated from energy policy. The reason climate science gets such attention is that is has a large bill attached. And yes it may be irksome to have to reiterate basic science - but that's education for you (some people are still arguing about evolution). So let's keep discussing and reading - it's a fascinating subject! -
johnd at 07:43 AM on 23 May 2010Unprecedented Warming in Lake Tanganyika and its impact on humanity
doug_bostrom at 05:11 AM, there seems to be a lot of misunderstanding or confusion about what the findings of the report were. This is taken from the abstract, "We conclude that these unprecedented temperatures and a corresponding decrease in productivity can be attributed to anthropogenic global warming" http://www.nature.com/ngeo/journal/vaop/ncurrent/abs/ngeo865.html LOL. Has anyone happened to notice that this study is basically about fishing for sardines? The method they used to arrive at their conclusion was to measure an indicator (BSi)of the lakes productivity (at one sole location) and correlate that with already reconstructed global temperatures. If the objective was merely to make the connection between the lakes surface temperature and global temperatures, would not it have been better just to check the temperature records from relevant locations around the lake? It would have saved a lot of the contortions that it appears to be causing. -
Doug Bostrom at 07:07 AM on 23 May 2010Unprecedented Warming in Lake Tanganyika and its impact on humanity
Thanks johnd, that was indeed an interesting read. I'm unmoved by your speculations; Tierney's methodological explanation is vastly superior in actual detail compared to "maybe something went wrong with the samples." Besides which we still have the congruency to explain. -
johnd at 06:35 AM on 23 May 2010Unprecedented Warming in Lake Tanganyika and its impact on humanity
doug_bostrom at 11:52 AM, perhaps if we go back to the basics and look how the proxy was developed. A direct link was created between the deposits of biogenic silica (BSi) found in the core sample and lake temperatures. The lack of correlation for the charcoal obtained from the core was used to rule out rainfall as an influence on the rate of deposition. Other indicators as to whether the replenishment of nutrients from any of the many inflows or any part of the shoreline were excluded from consideration by the limited core samples taken that could have identified possible sources remote from the lake itself or activity close by. Logic dictates that if any material is being deposited in the sediments it must be replenished from somewhere unless it is in a constant decline, and if the rate of replenishment varies that would be reflected in the rate of deposition. If you haven't read this study referenced below you may find it interesting if read carefully, particularly the advice on site selection within the lake if undertaking paleoclimate reconstructions, the accepted methods they used to take multiple samples along transects, but in particular, I repeat, in particular, the extremely wide variation of the BSi content within the numerous samples collected. http://www.geo.arizona.edu/nyanza/pdf/Powers.pdf -
Doug Bostrom at 06:30 AM on 23 May 2010Unprecedented Warming in Lake Tanganyika and its impact on humanity
[let's be civil, please!] Sorry! That's what comes of not hitting "preview." Always good to be reassured someone's actually reading all our blather. :-) -
Phila at 06:13 AM on 23 May 2010Unprecedented Warming in Lake Tanganyika and its impact on humanity
[let's be civil, please!] Sorry! That's what comes of not hitting "preview." Thanks for the gentle reminder. -
Phila at 05:55 AM on 23 May 2010Unprecedented Warming in Lake Tanganyika and its impact on humanity
#91 "I think not. The more critical we are the better the science will be. That papers get picked over and pulled apart...." Yes and no. If someone like Lindzen is critical, that's one thing. But if someone who doesn't understand the basic concepts of AGW is critical, and routinely mistakes lazy contrarian speculation for a new and improved form of "peer review," that's not really useful, IMO. I think it'd great to have a "more robust science," and I'm sure everyone here agrees with me. But if skeptics want to contribute to that result, they need to become conversant with the basic science and the rules that govern it, at the very least. You can't simply leapfrog over these requirements and present yourself as a climatologist's peer or inquisitor. What I object to is not the desire for democratization, but the assumption that there is or should be no entrance fee, in the form of doing one's [let's be civil, please!] homework. I'm sure you'd like astrophysics and virology to be more robust sciences too, but I suspect you don't spend much time instructing scientists in those fields on First Principles. -
Unprecedented Warming in Lake Tanganyika and its impact on humanity
Si >"The more critical we are the better the science will be." Yes, but true scientific criticism generally comes from other practicing scientists, especially those in related fields of study. This ensures that those employing the criticism are well versed in topics relevant to the field. If scientists tried to address all the criticisms of amateur skeptics, they would be spending all their time rehashing basic principles and never moving the science forward. For sure, there are legitimate scientists on the skeptic side (Lindzen being one), but their number is tiny compared to those accepting the mainstream position. It seems that an inordinate amount of criticism of AGW comes from amateurs who feel that their every issue and misunderstanding must be addressed before the science should be considered robust. I can't think of any scientific discipline that holds itself to such an impossible standard. In the end though, I think you are right that it makes the science more robust. In that regard, it is telling that the scientific consensus supporting AGW has only grown stronger in the face of this overwhelming scrutiny. -
Doug Bostrom at 05:11 AM on 23 May 2010Unprecedented Warming in Lake Tanganyika and its impact on humanity
Thanks for the clarification (pun?) on Langenberg, Si. A lot of observations but apparently none to rebut Tierney's central finding, that of a temperature record closely resembling that produced by numerous other measurement methods from a diversity of other geographically dispersed situations. Now, one could say Tierney's wrong somehow, but that leaves hanging the question of why the record she's derived bears such an uncanny resemblance to so many others, which of course also mutually coincide. Any hypothesis to explain this resemblance should include a mechanism yielding such a set of coincident signals. We have that mechanism at hand, predicted by fundamental physics and apparently confirmed by a host of observations. At WUWT I read misplaced concern about data points as opposed to statistical lessons from data collections, innuendo about Mann, sophomoric remarks about "Hockey Teams" and the like but I see absolutely nothing that will coherently explain how Tierney's results are so closely congruent with what we expect to see and in fact have seen in numerous other data sets. So, no useful contribution, just a lot of "I doubt it" or elliptical departures from the objective of Tierney's work. No utility of the kind you refer to, Si, when you extol the virtues of the activities at WUWT and elsewhere. -
Doug Bostrom at 04:57 AM on 23 May 2010Unprecedented Warming in Lake Tanganyika and its impact on humanity
Si, you don't think Willis is swerving into misplaced concerns with absolute accuracy? Can you explain what he's writing about, if it's not absolute accuracy? Why are he and you, too, apparently so disturbed by by the relative paucity of calibration data? Regarding your later remark, the utility of criticism depends on its validity and ability to further progress. So far I've seen little evidence of that; Lindzen is about the best data point available but he appears to have become entirely fixated on a hypothesis that has proven unable to improve on others' work. -
Si at 04:41 AM on 23 May 2010Unprecedented Warming in Lake Tanganyika and its impact on humanity
Phila "The problem is that a small group of amateurs has decided to hold climate scientists to an impossibly high standard that most of them apply to no other field. Any science that tried to appease this degree of contrarianism would be doomed to stasis at best." I think not. The more critical we are the better the science will be. That papers get picked over and pulled apart (Teardown you call it in hardware) means that Climate Science will move out of the cosy club it has been and become a much more robust science. This site is helping in that by questioning your 'small group of amateurs' (I think Richard Lindzen et al might object to that description). -
Si at 04:27 AM on 23 May 2010Unprecedented Warming in Lake Tanganyika and its impact on humanity
doug. I dont think Willis makes the mistake you mention. He is having a critical look at Jessica's paper - thats what scientists do. I think he makes some interesting points and gets even better comments in the thread eg Hu McCulloch's- odo take a look. -
Si at 04:17 AM on 23 May 2010Unprecedented Warming in Lake Tanganyika and its impact on humanity
John the relevance of Langenberg to Tielney is that he is another young student studying the lake but comes to different conclusions - of course they are not attention headline grabbing ones but such is life. In brief (and not my summary but from Pat Moffat) • No evidence of increasing lake clarity as a result of secchi measurements since 1946 • The interplay of stratification and plankton productivity are not “straightforward” • Challenges O’Reilly’s assumption on the correlation of wind and productivity -the highest production is on the end of the lake with the lowest winds • A strong caution using diatoms as the productivity proxy (it is one of two different lake modes) • No ability to link climate change to productivity changes • More productivity from river than allowed for in Nature Geopscience article • Externally derived nutrients control productivity for a quarter of the year • Strong indications of overfishing • No evidence of a climate and fishery production link • The current productivity of the lake is within the expected range • Doesn’t challenge recent temp increase but cites temperature records do not show a temperature rise in the last century • Phytoplankton chlorophylla seems to have not materially changed from the 1970s to 1990s • Disputes O’Reilly’s and Verbug’s claims of increased warming and decreased productivity • Rejects Verburgs contention that changes in phytoplankton biomass (biovolume), in dissolved silica and in transparency support the idea of declining productivity. A large part of the lakes production may be picocyanobacteria -
Phila at 04:12 AM on 23 May 2010Unprecedented Warming in Lake Tanganyika and its impact on humanity
#86 "it might be good to dispell these "obvious" issues and not make assumptions about what the reader is inclined to believe." That sounds great in theory, but in practice it would be very hard to anticipate every single issue that a "skeptic" might seize on while looking for an excuse to downplay or disregard scientific findings. The problem isn't that Nature is making incorrect assumptions about its readership. The problem is that a small group of amateurs has decided to hold climate scientists to an impossibly high standard that most of them apply to no other field. Any science that tried to appease this degree of contrarianism would be doomed to stasis at best. -
Doug Bostrom at 03:37 AM on 23 May 2010Unprecedented Warming in Lake Tanganyika and its impact on humanity
RSVP, you think Nature is a journal aimed at the layman? It's not. Publishing in Nature guarantees an audience beyond any narrow domain of research but that audience is well versed in the practice and conventions of scientific publication. As you know. Temperature trends are a key metric of climate behavior. As you well know. -
RSVP at 03:29 AM on 23 May 2010Unprecedented Warming in Lake Tanganyika and its impact on humanity
Phila quotes doug_bostrom about my remark etc. "In reality, as Doug Bostrom says, if a problem of this type seems "obvious," there's a pretty good chance that it's not a problem at all." I see the article as directed to the less initiated (sort of an intro into this subject about the temperature of the largest lake in Africa). As such, it might be good to dispell these "obvious" issues and not make assumptions about what the reader is inclined to believe. Aside from this point, were'nt local temperature conditions suppose to be irrelevant in terms of proving or disproving global warming? -
Doug Bostrom at 03:28 AM on 23 May 2010Unprecedented Warming in Lake Tanganyika and its impact on humanity
Si, Willis appears to be committing a mistake that we (and especially folks at WUWT) should have left behind a long time ago. Willis is missing the forest while scrutinizing pine needles, conflating the significance of temperature trends w/ the importance of absolute accuracy of temperature measurements. The instant he latches onto problems with accurate calibrations is when he runs off the rails and misses the big picture. The fundamental objective here is to look for trends, not what exact temperature it was on a given day. Tierney necessarily needs to establish some sort of base temperature around which to hang the data she derived from her cores, but in point of fact that choice is not really important, it's the shape of the graph that is noteworthy. It's interesting to observe that comments on Willis at WUWT note the resemblance of Tierney's graph to others including of course Mann's famous example. They allude of course to incompetence, etc. because they have nothing else to say but fail to explain why so many sources of data should resemble one another in the shape they present when plotted. -
Doug Bostrom at 03:11 AM on 23 May 2010Unprecedented Warming in Lake Tanganyika and its impact on humanity
Si, it's worth thinking for a moment about what the implications would be if Tierney had -not- found a temperature signal resembling that found elsewhere. Really, take a moment to ponder that. Blame does not really enter into the equation. -
Si at 03:04 AM on 23 May 2010Unprecedented Warming in Lake Tanganyika and its impact on humanity
Another young student, Victor Langenberg’s 2008 thesis (Wageningen University) On the Limnology of Lake Tanganyika http://edepot.wur.nl/121977 should make for an even more interesting comparison.Moderator Response: Perhaps you're new here and don't know, if you provide a link to a paper or other resource at SkS you're expected to explain why you think it significant to the discussion. -
Si at 02:31 AM on 23 May 2010Unprecedented Warming in Lake Tanganyika and its impact on humanity
E at 79. I agree with the sentiment here -climate scientists are not incompetent or indeed involved in a conspiracy. But Jessica (at 30) admittted that again it is a case of blaming CO2 as the likely culprit. Hardly a convincing argument. -
Phila at 02:31 AM on 23 May 2010Unprecedented Warming in Lake Tanganyika and its impact on humanity
Skepticstudent, Please try to bear in mind that you're essentially accusing real people whom you've never met of incompetence or worse. Basic human decency would require you to offer very strong evidence, even if the scientific method didn't. You should also bear in mind that as you labor to discredit every single study you don't like by dreaming up alternative explanations, you're creating a highly counterintuitive picture: An accumulation of data from all over the world that combine, coincidentally, to present the "illusion" of AGW. At some point, you have to understand that this is a far more improbable scenario than the one you're so desperate to debunk. -
sylas at 02:23 AM on 23 May 2010Has the greenhouse effect been falsified?
I am very grateful for comments which have picked up a couple of errors in my original essay, now fixed. I will continue to accept corrections with thanks, and update the essay as appropriate to get rid of errors. I may not agree with all the criticisms or corrections suggested, however. I do not see any problem at present with the wording being used, which at the time of writing reads: When you look down from aircraft at 20km altitude (Fig 1a), what is "seen" is the thermal radiation from Earth that gets out to that height. Some of that radiation comes from the surface. This is the parts of the spectrum that follow a line corresponding in the diagram to about 268K. Some of that radiation comes from high in the atmosphere, where it is much colder. This is the parts of the spectrum that follow a line of something like 225K. The bites taken out of the spectrum are in those bands where greenhouse gases absorb radiation from the surface, and so the radiation that eventually escapes to space is actually emitted high in the atmosphere. The atmosphere's main IR window (the region of IR transparency) is around 800 to 1000 cm-1 in wavenumber, or about 10 to 12.5 microns in wavelength. Some of the radiation to space DOES come from the surface, and the wavelengths to look for surface radiation are those in this IR window. Wording can always be tweaked a bit, but I don't see any problem with what is there at present. The IR window in this specific case is almost all from the surface. The main point here is that we can observe the greenhouse effect at work. It is not falsified; it is a notion known from basic physics for well over a hundred years and it is now amply confirmed in measurements such as those I have shown and also such as those shown in the site linked by Berényi: IR Transmission Spectra. For example, take the midrange-IR spectrum shown for Mauna Kea, which matches most closely the range of Figure 1 in the blog. I show the image on the page, and below it a reversed image with wavenumbers written into the horizontal scale for a slightly easier comparison with the figure in the blog. I have also added a horizontal line at transmission level 1 (fully transparent).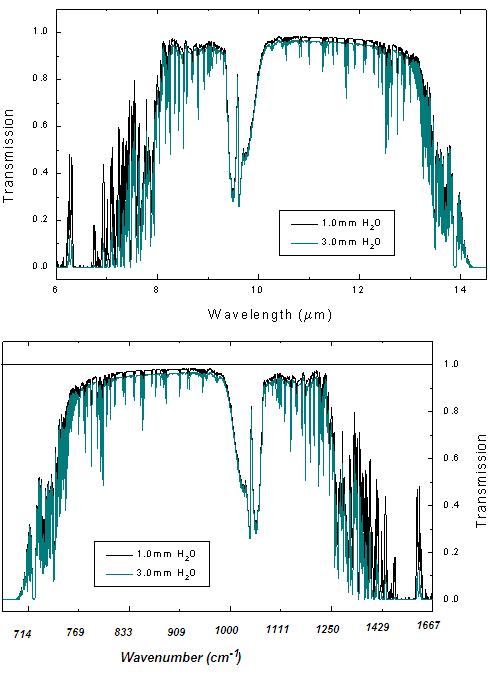 This also shows what is wrong with the specific criticisms made against Figure 1 in the blog. Berényi says:
On the other hand, since IR transmittance in window is ~80%, [...snip...]
It means the radiance curve in Fig. 1 can not be produced by actual measurement or if it was, what is shown is a scaled up version of values measured. Undocumented tricks like this are not helpful.
Figure 1 is produced by actual, unscaled measurement. There are no undocumented tricks. Your problem here is assuming the ~80% IR transmittance. That is simply not valid. You can see clearly that it is not the case in Mauna Kea data either. And while you are right that Mauna Kea is high altitude... why not also note that the Artic is high latitude? It makes a comparable difference.
Mauna Kea is at an altitude of 4200m, which is enough to get about 90% of the water vapour in the atmosphere; quite so! But it is also in a humid climate, where you have a high tropopause and lots of water vapour at low altitude. So sure; at low altitude in Hawaii you would have less IR transmittance (though you cannot assume a globally based mean figure will be a good specific estimate for this or any other location). But the Arctic regions, where the Fig 1 data was collected, have much lower specific humidity than Hawaii.
Even if you don't trust the data I have supplied, you need a much better basis for presuming it is inaccurate and presuming to scold on that basis. Be skeptical by all means. I will try to get hold of the actual data myself if I can and follow up. But please be assured that I am not deliberately distorting things.
You remain the most helpful contributor here for cleaning up errors in the blog post. I'd like to continue a constructive engagement. You are welcome to be skeptical, but without being overly sensitive... I'd really appreciate a bit more credit myself for not trying to be deliberately deceptive. Can we do that?
Cheers -- sylas
This also shows what is wrong with the specific criticisms made against Figure 1 in the blog. Berényi says:
On the other hand, since IR transmittance in window is ~80%, [...snip...]
It means the radiance curve in Fig. 1 can not be produced by actual measurement or if it was, what is shown is a scaled up version of values measured. Undocumented tricks like this are not helpful.
Figure 1 is produced by actual, unscaled measurement. There are no undocumented tricks. Your problem here is assuming the ~80% IR transmittance. That is simply not valid. You can see clearly that it is not the case in Mauna Kea data either. And while you are right that Mauna Kea is high altitude... why not also note that the Artic is high latitude? It makes a comparable difference.
Mauna Kea is at an altitude of 4200m, which is enough to get about 90% of the water vapour in the atmosphere; quite so! But it is also in a humid climate, where you have a high tropopause and lots of water vapour at low altitude. So sure; at low altitude in Hawaii you would have less IR transmittance (though you cannot assume a globally based mean figure will be a good specific estimate for this or any other location). But the Arctic regions, where the Fig 1 data was collected, have much lower specific humidity than Hawaii.
Even if you don't trust the data I have supplied, you need a much better basis for presuming it is inaccurate and presuming to scold on that basis. Be skeptical by all means. I will try to get hold of the actual data myself if I can and follow up. But please be assured that I am not deliberately distorting things.
You remain the most helpful contributor here for cleaning up errors in the blog post. I'd like to continue a constructive engagement. You are welcome to be skeptical, but without being overly sensitive... I'd really appreciate a bit more credit myself for not trying to be deliberately deceptive. Can we do that?
Cheers -- sylas
-
Si at 02:22 AM on 23 May 2010Unprecedented Warming in Lake Tanganyika and its impact on humanity
Skepticalstudent...looks like you agree with Willis then who concludes in his article "My point is, the Tierney 2010 report is a study of the change in Lake Tanganyika surface temperature over time, which contains no measurements of the change in LST over time, and which has exactly three actual surface temperature measurements, which are poorly cited, are from different parts of the lake, and are all from 2003 …" Jessica, is he right? -
Si at 00:52 AM on 23 May 2010Climate Change and the Integrity of Science: a letter to Science
Great thread! At 62. Monckhausen "We are running a small but fine blog taking on these deniers with something they do not have: humour" I thought those skeptics were pretty funny actually www.cartoonsbyjosh.com -
Unprecedented Warming in Lake Tanganyika and its impact on humanity
Skepticstudent writes "Did they know about the thermal vents at the bottom of the lake in numerous locations before they wrote this article and spent all that time?" Actually the authors were well aware of geothermal activity in the lake. The issue is addressed in their comments here. >"... I'm attempting as do the majority of skeptics to show that there are many natural causes that add to the whole." Why do you and a majority of skeptics constantly assume that climate scientists are so incompetent as to be unaware of this fact? You are shown to be wrong time and time again yet you continue to make these assumptions. -
mspelto at 20:51 PM on 22 May 2010Unprecedented Warming in Lake Tanganyika and its impact on humanity
In terms of the comments on Kilimanjaro glaciers, I referenced Rwenzori glaciers because they are closer and to the wetter environment, do not lose mass significantly via evaporation. Thus, it is only temp and ppt. that matter more typical. The glaciers are also at a lower elevation which yields climate more in line with their surroundings. -
Doug Bostrom at 17:40 PM on 22 May 2010Unprecedented Warming in Lake Tanganyika and its impact on humanity
Skepticstudent, you're not keeping up and you're making yourself look foolish. To wit: ....does one really have to worry about wattage output into the water to wonder if they could output heat into the lake? How much heat? You do realize, the heat energy released into the lake versus the mass of water contained in the lake determines whether the hydrothermal vents will have any significant impact on the temperature of the lake compared to other inputs? Right? So you need to quantify that or you're not making a argument with any effect. One would also have to admit that these thermal vents are pushing co2 as well as sulphur to the surface... Ok, that last statement is completely diagnostic of your traction problem. You need to start at the beginning. Read this: Weart's Discovery of Global Warming. See, getting your head around Weart's book or the complete equivalent is a prerequisite for conducting useful discussion of the entire topic of AGW including the little fragment we're treating here. You can't do long division before you know how to add and subtract. You can't be a "skeptic" without knowing enough about the topic to avoid making blunders such as imagining that C02 entering the lake from hydrothermal vents will somehow affect the temperature of the lake in the same way C02 in the atmosphere at large helps to control the temperature of the lake. Really, do yourself a favor and read Weart. It'll take you some hours but for anybody who is inclined to spend time noodling around on Google Scholar-- such as yourself-- it's actually quite entertaining. And it's free, the web edition that is. -
Riccardo at 17:18 PM on 22 May 2010Unprecedented Warming in Lake Tanganyika and its impact on humanity
skepticstudent, it could be helpful if you link directly to the paper instead of copy/paste author, title, affiliation and address. What Doug was trying to say, I guess, is that one has to be quantitative in their hypothesis. No one is saying that there is no volcanic activity in the lake. The point is the impact on the overall behaviour of the ecosystem. For sure Dr. Tierney and co-workers are well aware of the presence of vents in the lake and we can take it for granted that their hole was not digged near one of such vents, even if not stated explicitly. Remember, research papers have no didactic intent (by definition, i'd say). And while we are all welcome to have a read, it's absurd to criticize them for not being explicit enough on many things. Even worse if you question author's skill in doing accurate research. Do you really think you have something to teach them on how to choose the proper drilling site? Do you really think that one day they just dropped some instruments on a boat and start drilling at random? Not even a newbie fisherman would do this, his first question would be where to go. -
johnmacmot at 16:59 PM on 22 May 2010Unprecedented Warming in Lake Tanganyika and its impact on humanity
Skepticalstudent, you need to be a little more thorough in your research. You might find it informative to visit J Tierney's website (link in her first post above) where she comments on the influence of those thermal vents . "Besides one would have to assume that since there isn't much in the line of industry in Africa being the poorest continent in the world, where would the anthropogenic warming effect be coming from." That's not a serious comment, is it? You do need to do some very basic reading to clarify for yourself how CO2 and greenhouse gases affect climate and induce warming. -
skepticstudent at 16:47 PM on 22 May 2010Unprecedented Warming in Lake Tanganyika and its impact on humanity
regarding doug_bostrom that's my whole point. They don't really describe much about where exactly they took their 2 whopping samples. but one would assume that if they're taking samples from the lake bed that would be close to the vents which apparently are from all over the lake. when you're digging into sediment of a lake with Volvanic vents all over the place does one really have to worry about wattage output into the water to wonder if they could output heat into the lake? One would also have to admit that these thermal vents are pushing co2 as well as sulphur to the surface along with heat towers. One thing that seems to escape notice in this website by many people such as yourself is that I'm not trying to say this is a died in the wool for sure cause of any and all temperature inclines in the area. However to the opposite I'm attempting as do the majority of skeptics to show that there are many natural causes that add to the whole. Besides one would have to assume that since there isn't much in the line of industry in Africa being the poorest continent in the world, where would the anthropogenic warming effect be coming from. -
skepticstudent at 16:05 PM on 22 May 2010Unprecedented Warming in Lake Tanganyika and its impact on humanity
Thermophilic Sulfate Reduction in Hydrothermal Sediment of Lake Tanganyika, East Africa LARS ELSGAARD,l* DANIEL PRIEUR,2 GASHAGAZA M. MUKWAYA,3 AND BO B. J0RGENSEN4 Universite Pierre et Marie Curie, Paris 6,1 and Centre National de la Recherche Scientifique,2 Station Biologique de Roscoff, F-29682 Roscoff; France; Centre de Recherche en Sciences Naturelles, Station d'Uvira, Uvira, Zaire3; and Max Planck Institute for Marine Microbiology, D-2800 Bremen 33, Germany4 Received 21 October 1993/Accepted 18 February 1994 I just discovered this article that could possibly shed some light on this issue. I know I’m no PHD but it makes one curious. The Max Plank Institute is a pretty respected organization so it’s not like I’m speaking out of my ear. I googled: Hydrothermal vents in Lake Tanganyika, East African Rift system Pflumio, Catherine, Castro, Maryse, Boulegue, Jacques, Gente, Pascal, et al. Geology. Boulder: Jun 1993. Vol. 21, Iss. 6; pg. 499 And I came up with the above article from the Applied and Environmental Microbilogy journal. I'd be very curious where they did their coring for the thread article? Did they know about the thermal vents at the bottom of the lake in numerous locations before they wrote this article and spent all that time? -
Riccardo at 16:04 PM on 22 May 2010There's no empirical evidence
e, a constant forcing held forever will indeed results in a constat rise in temperature. When the forcing is applied and the temperature starts to increase the earth wiil progressively increase its thermal emission untill balance is reached again and the temperature stops increasing. Mathematically it is expressed by the term λΔT in the heat balance equation: C dΔT/dt = F−λΔT sooner or later this term will balance the forcing. Never overlook the stronger and faster negative feedback! :) -
Doug Bostrom at 15:56 PM on 22 May 2010Unprecedented Warming in Lake Tanganyika and its impact on humanity
Skepticstudent, lots of work but besides hydrothermal vents, what does it all have to do with the temperature of the lake, which is the actual signal being assessed? Regarding the hydrothermal vents, what is their output in watts and how much is that output capable of changing the temperature of the lake? In general you need to produce numerical results to be persuasive. You've got more work to do. -
skepticstudent at 15:49 PM on 22 May 2010Unprecedented Warming in Lake Tanganyika and its impact on humanity
Part II - The effects of windstorms on nutrient of Lake Tanganyka Effect of wind induced water movements on nutrients, chlorophyll-a, and primary production in Lake Tanganyika V. T. Langenberg,1∗ J. Sarvala,2 and R. Roijackers1 1Aquatic Ecology and Water Quality Management Group, Agricultural University, Wageningen, The Netherlands 2Department of Biology, University of Turku, Turku, Finland *Corresponding author: Aquatic Ecology and Water Quality Management Group, Agricultural University, PO Box 8080, Wageningen, the Netherlands; Tel.: +31-629433225; Fax: +31-317484411; E-mail: victor.langenberg@wur.nl Climate change decreases aquatic ecosystem productivity of Lake Tanganyika, Africa.Full Text Available By: O'ReiIIy, Catherine M.; AIinl, Simone R.; Plisnier, Pierre-Denis; Cohen, Andrew S.; McKee, Brent A.. Nature, 8/14/2003, Vol. 424 Issue 6950, p766, 3p; DOI: 10.1038/nature01833; There have been numerous peer reviewed articles that have talked about an increase of fish, including the one above. The only species of Cichlids that are declining are the rock fish that are suffering from their habitation being destroyed by erosion of rock shelve strata by over use of the area. Nature and Science are the only two journals that have any articles about global warming causing issues and they’ve been by the same authors, using similar test methods to this recent one. The latter not using any surface temperatures across the lake or more than two core samples. This lake is over 10,000 sq. miles. [pointless, irrelevant and insulting analogy removed] And if you notice, I even used information from a "Nature" article. -
skepticstudent at 15:48 PM on 22 May 2010Unprecedented Warming in Lake Tanganyika and its impact on humanity
Ok I have been ostracized for putting out information without evidence to back it up. I've done some considerable research over the last week or so since this originally came out. John was a little slow on the uptake on this one, no doubt to his eager anticipation of the Heartland institutes summit on Climate change last week. :-) So I'm breaking this down into two sections to make it short as requested by John C. Part 1. I have been researching this whole issue for the last couple of days. At someone's suggestion I went to check out the following article but unfortunately they only provide Abstracts through ProQuest and I can't afford to sign up for their membership. Hydrothermal vents in Lake Tanganyika, East African Rift system Pflumio, Catherine, Castrec, Maryse, Boulegue, Jacques, Gente, Pascal, et al. Geology. Boulder: Jun 1993. Vol. 21, Iss. 6; pg. 499 One would think that if there are active thermal vents that we've known about since at least 1990 this could have something to do with the issue. It would also appear that there is a massive overharvesting of fishing going on that makes the gillnetting/long lining of salmon look like a drop in the bucket. Also there is a massive problem with land use issues. Granted the last two issues are man caused but have absolutely nothing to do with AGW. I also read an article that shows that there have been higher than normal wind conditions which inevitably dry out the surface which is going to cause conflicting temperature anomalies. I’ve also read about Gustave the killer Croc which could be eating up large amounts of fish. A much more viable option than AGW, especially since the authors admit that they only took two samples from a huge body of water. http://search.ebscohost.com/login.aspx?direct=true&db=f5h&AN=38995750&site=ehost-live The above is a link to a scholastic database of a National Geographic Article. Is an interesting article about how the two major species of fish have major variances in population. Limnological variability and pelagic fish abundance (Stolothrissa tanganicae and Lates stappersii) in Lake Tanganyika P.-D. Plisnier Æ H. Mgana Æ I. Kimirei Æ A. Chande Æ L. Makasa Æ J. Chimanga Æ F. Zulu Æ C. Cocquyt Æ S. Horion Æ N. Bergamino Æ J. Naithani Æ E. Deleersnijder Æ L. Andre´ Æ J.-P. Descy Æ Y. Cornet Received: 24 June 2008 / Revised: 12 December 2008 / Accepted: 2 January 2009 / Published online: 2 February 2009 _ Springer Science+Business Media B.V. 2009 -
There's no empirical evidence
PaulK writes "So now ask yourself the question whether it is possible in terms of first law of thermodynamics to have an imbalance of TOA radiative energy for an infinite time which results in a finite (constant) change in planetary temperature" In reality, if you tried to extend this equation to infinite time, you would have to consider that the 1 W/m^2 forcing would disappear at some point. After that point the temperature will obviously go back down, and the first law of thermodynamics will remain unbroken. As long as we are dealing with timeframes << the lifetime of the sun (as we typically do), the equation is perfectly valid as is. -
Phila at 12:21 PM on 22 May 2010Unprecedented Warming in Lake Tanganyika and its impact on humanity
"It doesnt take much internet search effort to find that the level has changed historically and recently as well due to water being deviated by man." Not to pile on, but this sentence may be the best illustration I've ever seen of the problems with "skeptical" logic. Not only is there an assumption that you can rebut scientific papers by Googling, but there's also an assumption that the easier it is to Google an alleged counterargument, the more damning it is. In reality, as Doug Bostrom says, if a problem of this type seems "obvious," there's a pretty good chance that it's not a problem at all. True skepticism requires discipline, knowledge and humility. Unless it's backed up with actual evidence, a statement like "it is relatively easy to take a sample that will confirm what anyone may want it to confirm" comes across as a lazy -- and ultimately nihilistic -- attempt to muddy the waters, IMO. -
Doug Bostrom at 11:59 AM on 22 May 2010There's no empirical evidence
PaulK, I may be wrong but as far as I know Tamino has never been found wrong w/regard to posts he's made on his site. I think if you have sufficient force of your conviction behind you, you ought to hie yourself to Tamino's site, tell him you think he's presenting junk science and is insufficiently trained and then do your best to prove it. You delivered the insult, now you should defend it. You have no earned reputation for reliability whereas Tamino does, so really the onus is on you to establish yourself as a superior intellectual force. Failing that, I don't find your reliance on such remarks as "the author of that site is not well trained in basic science" at all persuasive and you are indeed wasting your time here.
Prev 2395 2396 2397 2398 2399 2400 2401 2402 2403 2404 2405 2406 2407 2408 2409 2410 Next


