


 Arguments


Recent Comments
Prev 2439 2440 2441 2442 2443 2444 2445 2446 2447 2448 2449 2450 2451 2452 2453 2454 Next
Comments 122301 to 122350:
-
papabob at 05:54 AM on 16 March 2010Watts Up With That's ignorance regarding Antarctic sea ice
I have quit discussing the subject with the folks to whom melting glaciers, thinning arctic shelf ice, thinning of the Greenland Ice Cap and other phenomena are just "natural occurances" and warming has nothing to do with them!! -
Geo Guy at 05:45 AM on 16 March 2010Antarctica is gaining ice
A group of scientists ( Eric Rignot, Jonathan L. Bamber, Michiel R. van den Broeke, Curt Davis, Yonghong Li, Willem Jan van de Berg & Erik van Meijgaard) recently assessed the loss in ice mass from 1992 to 2006 in Antarctica using radar interferometry and regional climate modeling and published their findings in Nature Geoscience. In a nutshell their findings identified ice mass loss in East Antarctica to be minimal but in the western part of the continent identified widespread losses along the Bellingshausen & Amundsen seas in the amount of 59% over ten years. In the Peninsula area losses were estimated at 140%. However they identified the losses as being concentrated along narrow channels occupied by outlet glaciers and attributed the cause to ongoing and past glacier acceleration. The concludedthat "changes in glacier flow have a significant, if not dominant impact on ice sheet mass balance." This issue goes back to my previous comment that any interpretations made from aggregated data should be taken with a grain of salt - especially when dealing with gravimetric readings. Contoured maps showing highs and lows and changes to those highs and lows over time are more relevant than a simple time series graph as posted in this article. -
NewYorkJ at 04:45 AM on 16 March 2010Watts Up With That's continued ignorance regarding Antarctic sea ice
"Perhaps Steve was distracted by the continental cooling in Figure 1 and didn't notice the warming over the ocean. " It defintely seemed odd to me that Goddard was using that map to support his assertion that cooling was leading to sea ice increases. It could also be that he's confusing sea ice and continental ice. Many serious readers of WUWT seem likely to make that mistake. -
ptbrown31 at 02:57 AM on 16 March 2010Watts Up With That's continued ignorance regarding Antarctic sea ice
It is also interesting to look at the Ice Mass loss of the Antarctic Ice sheet which has been accelerating noticeably. http://www.columbia.edu/~mhs119/IceSheet/Velicogna.pdf http://www.agu.org/pubs/crossref/2009/2009GL040222.shtml -
HumanityRules at 01:28 AM on 16 March 2010Watts Up With That's continued ignorance regarding Antarctic sea ice
Having said all that I don't see how Zhang's system can lead to a trend. It should produce a dymanic situation where the ocean upwelling should alternate between being switched on and off. -
HumanityRules at 01:16 AM on 16 March 2010Watts Up With That's continued ignorance regarding Antarctic sea ice
6.CBDunkerson at 00:53 AM on 16 March, 2010 From Zhang's abstract "The model shows that an increase in surface air temperature and downward longwave radiation results in an increase in the upper-ocean temperature and a decrease in sea ice growth, leading to a decrease in salt rejection from ice, in the upper-ocean salinity, and in the upper-ocean density. The reduced salt rejection and upper-ocean density and the enhanced thermohaline stratification tend to suppress convective overturning, leading to a decrease in the upward ocean heat transport and the ocean heat flux available to melt sea ice.The ice melting from ocean heat flux decreases faster than the ice growth does in the weakly stratified Southern Ocean, leading to an increase in the net ice production and hence an increase in ice mass. This mechanism is the main reason why the Antarctic sea ice has increased in spite of warming conditions both above and below during the period 1979–2004 and the extended period 1948–2004." and from section d "This indicates that the increasing P [precipitation] is not the main cause of the simulated increase of Antarctic sea ice cover. Zhang is all about increasing sea/surface air temp leading to increasing ice extent. Precipitation is of minor importance to his theory. -
CBDunkerson at 01:07 AM on 16 March 2010CO2 levels during the late Ordovician
RSVP, your 'scenario 3' is inherently flawed... CO2 and other GHGs do absorb infrared radiation (at various wavelengths), but they then re-emit it. Thus your argument that a 100 ppm increase in CO2 doesn't have the capacity to retain enough heat to cause significant warming is entirely irrelevant... NO ONE claims that is happening. Rather, because of that extra 100 ppm CO2 more infrared radiation which WAS going up and escaping out into space is instead absorbed and re-emitted back down... where it is then retained in things like the land and oceans which DO have the capacity to store a great deal of heat and cause global warming. -
HumanityRules at 00:58 AM on 16 March 2010Watts Up With That's continued ignorance regarding Antarctic sea ice
The Boning 2008 paper seems to be covering an area of the Southern Ocean outside the range of the antarctic sea ice (30oS to 60oS). I don't think this should be included in "the full array of empirical data" -
CBDunkerson at 00:53 AM on 16 March 2010Watts Up With That's continued ignorance regarding Antarctic sea ice
HumanityRules, I see nothing in Zhang which suggests that ice production should be inversely proportional to local sea temperature. Rather the opposite in fact. Zhang argues (amongst other things) that the GLOBAL increase in temperature has caused a GLOBAL increase in water vapor and thus greater precipitation. That increased precipitation would act to increase ice formation throughout Antarctica... but would be hampered in doing so in areas where the oceans have warmed significantly. This is one of the reasons most researchers expect the Antarctic sea ice trend to reverse... as the oceans continue to warm (and the ozone hole to close) the balance of forces will tip back. The flaw in your argument here is the same as with the common 'skeptic' argument that increased temperatures will not lead to drought because there will be more precipitation... both ignore that the extra precipitation will not fall in perfect proportion on the locations of increased evaporation. -
Mal Adapted at 00:21 AM on 16 March 2010CO2 levels during the late Ordovician
Chriscanaris @40: "I ask because people tend to resist making changes when not faced with immediate profits, costs, or like consequences. Moreover, we find it very difficult to consider consequences extending beyond our lifetimes (and perhaps our immediate offspring's')." I'm with you on that. The deacon's grace: Lord bless me and my wife, Son John and his wife, We four and no more. Science can often tell us, with a high degree of certainty, what will happen in the future. What it can't tell us is why we should care. It seems unlikely to me that Homo sapiens faces outright extinction. Population may crash, but there will be survivors, who will keep breeding. That's hardly an uplifting prospect, though. I'm glad I have no offspring. -
HumanityRules at 00:16 AM on 16 March 2010Watts Up With That's continued ignorance regarding Antarctic sea ice
This recent paper highlights the fact that sea ice increase varies for the seas around antarctica. JOURNAL OF GEOPHYSICAL RESEARCH, VOL. 113, C07004, doi:10.1029/2007JC004564, 2008 Antarctic sea ice variability and trends, 1979–2006 D. J. Cavalieri and C. L. Parkinson It shows the greatest increase in sea ice in the Ross Sea. And the smallest (in fact a decrease in ice) in the Bellingshausen/Amundsen seas. Your Fig2 seems to show strongest sea warming in the B/A seas (the dark red along the west coast). And some of the lowest temp increases in the Ross Sea (the pink/blue area below the Ross Ice shelf). Just to summarize that because it seems counter-intuitive to the counter-intuitive Zhang theory. B/A Sea - Strongly warmer sea temp. Lowest (reduced) ice trend increase. Ross Sea - Weakly warmer/cooler seas. Highest ice trend increase. Does it matter that this seems the opposite to the Zhang theory? -
mspelto at 23:51 PM on 15 March 2010Watts Up With That's continued ignorance regarding Antarctic sea ice
#2 and #3 You are getting carried away with the amount of sea ice change. It is true you could starve an ice sheet for moisture, however, the actual precipitation rates in Antarctica have not been declining. Bromwich Monaghan Further the amount of sea ice increase is insignificant in terms of moisture transport distances. Focus on the actual air temps in the region during the sea ice formation period. Temp map -
gpwayne at 22:42 PM on 15 March 2010Watts Up With That's continued ignorance regarding Antarctic sea ice
"It could therefore easily be the case that increased sea ice near Antarctica will accelerate ice loss from the continent". In which case, this could also be a contributory factor in the mass loss now discovered in the EAIS, which took me rather by surprise since, like everyone else, I thought it was stable compared to the WAIS. -
Ebel at 22:29 PM on 15 March 2010CO2 levels during the late Ordovician
The fact that greenhouse gases absorb infrared radiation is rarely disputed - not even by Gerlich and Tscheuschner. But a body that absorbs, must necessarily also emit. This fact explains the division of the atmosphere into two layers: • at bottom of the troposphere where vertical circulation prevails and the temperature gradient is determined by the circulation and not by the radiation balance, and • above is the stratosphere , where the temperature profile is determined by the balance of radiation (absorbed energy of radiation = emitted energy of radiation). Boundary conditions for radiation intensities in the atmosphere are the high level of infrared radiation upward from the warm surface of the Earth, and the the practically non-existent downward infrared radiation from outer space. The total radiation from Earth into space must equal the absorbed radiation from the sun. Temporary fluctuations in this balance result in temperature changes which more or less (depending on the storage capacity of air, solid earth, ocean) quickly restore equilibrium. As a result of these conditions, the intensity upward flux decreases, and intensity downward flux increases. A temperature profile based on a dormant atmosphere which maintains the balance of radiation (absorbed radiation energy = emitted radiation energy, the vertical part would be reach to the surface) would show temperatures at lower altitudes changing quickly altitude increases (steep temperature gradient), such that initially small air movements increase rapidly - air that's a bit warmer than the surrounding air accelerates as it rises, and air that's a little colder than the surrounding air accelerates going down. The result is a temperature gradient that's nothing more than an edge case : When the air rising, the decrease in pressure causes it to cool at precisely the same rate as the surrounding air. Above, rising air would cool faster than the surrounding temperature decreases, causing it to drop back down to its resting point , leaving air stratification in a stable state. The driving mechanism of vertical circulation in the troposphere is that the air at the surface is warmed more than the surrounding air, and therefore rises. Because more is emitted than absorbed, the rising air is cooled, and gives off latent heat (from the condensation of water vapor) and the rate of ascent gets slower and slower until it reaches zero { this is the end of the troposphere. The convective and latent heat that is injected into the troposphere complements the energy balance at the surface. How quickly the pressure (or altitude) in the atmosphere is reached, at which the temperature is so high that the air stratification becomes unstable (the boundary between the troposphere and stratosphere - tropopause), depends on the absorption length of radiation in the atmosphere, as well as on the concentration of greenhouse gases. The higher the concentration, the faster the critical value is reached. Therefore, as a first approximation, it can be assumed that the column pressure of greenhouse gases in the tropopause is constant. But this is only a very rough approximation, since the temperature in the stratosphere has to decrease: As the surface temperature increases, wavelengths that the atmosphere only absorbs to a small extent, radiate for the most part directly into space. Consequently, the temperature conditions change such that less heat from the greenhouse gases radiates into space. This has the consequence that with increasing concentration of the greenhouse gas the column pressure decreases. Thus, the radiation conditions near the surface have practically no influence on the temperature profile. Arguments such as saturation of transparency through the atmosphere have no meaning. In the paper by Gerlich and Tscheuschner the tropopause is mentioned three times, two times that the tropopause would be mistaken with the ionosphere, and once in another quote. No connection to the greenhouse effect is shown - for Gerlich and Tscheuschner, there is apparently no cause for separation of the atmosphere. In reality, the actual location of the tropopause varies due to wind, etc. Note: At low pressures, there is still a temperature peak. This is the result of UV absorption and ozon e formation. UV is absorbed, but the absorbed energy is emitted as infrared. Since the UV is absorbed, the UV intensity decrease based on an e-function, and for small temperature changes, the emitted power is roughly proportional to the temperature. Based on this approach, the following equation describes the observed temperature profile between 220mbar (11 km height) and 1mbar (47 km height) very well. T = 56, 5°C + 67,3K * exp(p/5,03 mbar) The exponential term in this equation describes the heating (UV-ozone-process) from above. It follows that the heating from above can be ignored in case of pressures greater than 50mbar (< 20 km altitude: < 3 mK), and is not responsible for the constant temperature in the stratosphere. An increase in CO2 concentration leads to an increase and cooling of the tropopause. A water vapor feedback is not taken into account. -
mikeh1 at 22:26 PM on 15 March 2010The Dunning-Kruger effect and the climate debate
For 1077 at 08:17 AM on 16 February, 2010 After my post at 95, I realised that 1077 may have been attempting to illustrate the Dunning-Kruger effect. If that is the case there is no need for an apology. -
mikeh1 at 22:23 PM on 15 March 2010The Dunning-Kruger effect and the climate debate
For 1077 at 08:17 AM on 16 February, 2010 The actual quote from the NOAA site is "Data are reported as a dry air mole fraction defined as the number of molecules of carbon dioxide divided by the number of all molecules in air, including CO2 itself, after water vapor has been removed" Note the "all molecules in air". So your statement "Can you please enlighten a poor soul - who studied chemistry and physics quite some time ago - what exactly is "a molecule of air"?" looks rather silly. Feel free to post an apology. -
Jacob Bock Axelsen at 22:06 PM on 15 March 2010Watts Up With That's continued ignorance regarding Antarctic sea ice
Gildor and Tziperman (2003) has an interesting box-model where sea ice actually triggers major deglaciation for the pleistocene 100ky cycles by capping precipitation to the accumulation zone of the ice sheet. It could therefore easily be the case that increased sea ice near Antarctica will accelerate ice loss from the continent. -
barry1487 at 22:00 PM on 15 March 2010Watts Up With That's continued ignorance regarding Antarctic sea ice
Typo.On a more positive side, he also dropped by to clearly articulate why he thinks the Southern Ocean is warming.
-
RSVP at 21:28 PM on 15 March 2010CO2 levels during the late Ordovician
CBDunkerson at 02:26 AM on 13 March, 2010 "RSVP, your model for testing the existence of the greenhouse effect seems to be lacking a Sun. Put in a visible light laser being continuously fired at the anvil to heat it up and make sure that the energy flows are significant enough for instruments to detect and you'd have a valid comparison. " Sorry for not replying sooner. Not sure why a "sun" or continuous heat source is needed. When I refer to comparing a cooling profile, I am talking about tracking the cooling of the anvil over time, until the anvil reaches the ambiente (assuming it is well below 100 C or 150 C). You would then superimpose these curves, and for that small difference of CO2 in column of say 3 meters (pick your height), it is hard to imagine there would be any appreciable difference. The curves would lay exactly one on the other. This would essentially indicate to what extent CO2 affects cooling. (i.e., zilch). Just for grins, the experiment should be conducted for incremented percentages of CO2 all the way up to 100%. This might help confirm other theories such as what might be happening on Venus. Again. I am not denying that CO2 absorbs IR. What I am saying is that what matters is the relative heat capacities of say the anvil of our thought experiment and this ity, bity amount of CO2 gas. There are three ways matter interacts with light. At least I can only think of three. 1) reflects it (as in a mirror), 2) passes it through (as in clear glass), 3) absorbs it (as in a black body). If I was being told that GHG acted as a mirror, case 1, such that photon emission was being hampered from the getgo, I could understand this AGW theory. But the experts are telling me that CO2 ABSORBS energy (case 3), meaning that heat capacity is the determinant which implies CO2 is acting like a heat sink. And whereas the mass of a heat sink determines its efficiency, the extra 100 ppm of anthropogenic CO2 in our atmosphere is essentially zero as compared to the mass (an therefore heat capacity) of land, water, etc. 100ppm is even almost zero compared to the air itself. So if we are going to entertain disucussions of AGW, it might make more sense to look at the effects of slash and burn, farmlands, human structures such as buildings, asphalt on highways, warming of water in artificial damns, etc. -
Riccardo at 18:43 PM on 15 March 2010Guest post: scrutinising the 31,000 scientists in the OISM Petition Project
shawnhet, "I was always taught that the scientific method proceeded by proposing a hypothesis that allowed testable predictions to be made." Indeed. What has this has to do with GCM? This is a quite common misunderstanding of the meaning of model. They are "just" a mathematical expression of more or less complicated physical laws, the theory is the big picture. Think about Arrhenius, his theory is the same we debating today but the model calculations are enormously different. Obviously we do not ignore GCM and their ability, but it's a different issue than the theory itself. They do a reasonable job in describing how the earth climate works, unless as Lucia says you think that "about 0.2 *C/decade" is a whole lot away from the estimated 0.16 °C/decade. It really surprises me that you "don't care what they describe". How do you test a model if not with as many as possible actual data and, eventually, new and still unrecognized effects? The future is uncertain by definition, especially when it will be at least in part decided by human actions and unpredictable natural forces. If, say, the sun decides to slow down for some decades, will it disprove the ability of GCM? No, of course, you'll plug in the new data and run them again, but it's not a prediction. Indeed, climatologists do not the word "predictions", the say "projections". "I can do just about as good a job as the GCMs by assuming a zero feedback model with a strong influence from the PDO." You sure could do it, but do you have any solid physical basis for it or you're just playing with numbers? As we all know, a correlation is just a hypothesis , then comes the physics. A model works differently, you plugin the physics and see the outcome. This is exactly why we CAN scientifically say that X is better than Y, just a correlation would not suffice. -
yocta at 17:30 PM on 15 March 2010CO2 levels during the late Ordovician
gallopingcamel. I haven't read that article you linked but as far as I can tell it is not a peer reviewed article but made to look so. The lead author (http://www.sciencebits.com/ClimateDebate) also seems to be quite critical of the IPCC and realclimate anyway (maybe he has some "bias and prejudice"?). When independent science academys from different countries all endorse the core findings of the IPCC I will more likely believe the claims the authors make from these organizations than something else. In no way does it mean I accept what they say at face value (hence why i've joined this site.) Tom Dayton linked to this video in John's other post which I highly recommend. Naomi Oreskes addresses the whole idea of consensus in science. She finishes with a quote by Sir Bradford Hill made when he overcame his skepticism with the link of smoking and cancer: All scientific work is incomplete—whether it be observational or experimental. All scientific work is liable to be upset or modified by advancing knowledge. That does not confer upon us a freedom to ignore the knowledge we already have, or to postpone the action that it appears to demand at a given time. -
actually thoughtful at 17:04 PM on 15 March 2010CO2 levels during the late Ordovician
Galloping camel wrote: "Ten years ago the Hockey Team was supreme; anyone who dared to question their views was branded as stupid, venal or even evil. The "science was settled" was being trumpeted throughout the "Main Stream Media" and woe betide any brave soul who dared speak against AGW. You talk about "ad hominem" attacks but have you forgotten how dissenters were treated? If you need reminding, the Climategate emails may help. Take a look at the ones mentioning Patrick Michaels or Fred Singer. " I don't recall this series of events. As I recall, folks wanted to argue with Al Gore about whether warming was happening. In the context of whether CO2 causes warming (ie is a greenhouse gas, and is being released ed by humans) he said "the science is settled." 10 years later it still seems that ALGORE was correct. Can you point me to the emails that are melting the arctic or Greenland? Emails showing people being people do not change the science, nor most people's opinion of the science. Tom -
shawnhet at 13:27 PM on 15 March 2010Guest post: scrutinising the 31,000 scientists in the OISM Petition Project
dhogaza:And the rest of the paragraph is a blend of speculation. "couldn't've predicted the temperature increase from 1910-1945"? If it were possible to predict changes in solar insolation and frequency of volcanic eruptions decades in the future, well, yes, they *could* have. I think you'll find that if one compares the proposed forcing for the 1910-45 period to the observed temperature that the climate was behaving as though it was subject to more forcing that we currently accept. I know that one can always fall back on the error bars because they are so wide, but that doesn't really help the idea that the GCMs are good predictors of climate. Riccardo, "The GCMs are not the hypotheis, they're just calculations; it should be quite obvious that model calculations are not a theory, and they never will." I find this a fascinating idea. I was always taught that the scientific method proceeded by proposing a hypothesis that allowed testable predictions to be made. If the GCMs are not hypotheses, then by what reason are they a part of the scientific method. Surely the fact that there are more than one GCM establishes that the calculations can be done more than one way(IOW they are not simply some automatic process that makes no difference to the predictions). If the GCMs are not hypotheses, should we just ignore them from a scientific standpoint? No, I don't think so. We should just accept them as what they are: individual hypotheses about the nature of the climate. We can then use them to make a variety of tests about the real world and see which of them(if any) match the real world behavior and how often they can do so. "And no, GCM are not calibrated to the same data they reproduce, this is simply wrong." Rather than spend a lot of time going over this issue, Lucia does a good job of discussing model tuning here(about halfway down the page). http://rankexploits.com/musings/2009/how-far-off-are-the-ar4-aogcms/ "They are able to describe many other things you overlooked." Again, I don't care what they describe, its what they predict that matters IMO. "Then, following your first claim the logical conclusion is that there is consesus both on the AGW theory and on the ability of GCM. What is surprisingly missing is your consensus." Why do I need a consensus? The fact is that I can do just about as good a job as the GCMs by assuming a zero feedback model with a strong influence from the PDO. This matches the periods where the GCMs do less well better and the most recent period too. The point is that regardless of the number of people that think that hypothesis X is valid, until we can come up with an unambiguous test that separates if from hypothesis Y, we can't scientifically say that X is better than Y. Cheers, :) -
HumanityRules at 13:14 PM on 15 March 2010CO2 levels during the late Ordovician
38.dhogaza at 16:39 PM on 13 March, 2010 The temp reconstruction is very similar to the one shown in the paper, it is not controversial. The sourse I think is irrelevant unless you can show that it is inaccurate. The new papers aknowledge they can't account for changes seen over the first half of the Ordovician, that is stated in the text. You're correct the biodiversity plot is irrelevant but interesting. It made me think about a thing or two. I'm not really trying to refute the work. I'm just saying that these new papers have their own limitations just like the work that generated the previous estimate. In fact it seems a little remit of John that he clearly state the drawbacks of the previous study yet does not highlight them for this work. You can not say that the Young work now represents a new consensus on the subject. I'm not sure science works like that. -
Pierre-Normand at 13:06 PM on 15 March 2010CO2 levels during the late Ordovician
Another well-known example of a causality relation going both ways: A child on the back seat of a car can cause an accident. An accident of the back seat of a car can cause a child. -
Pete Dunkelberg at 12:57 PM on 15 March 2010Guest post: scrutinising the 31,000 scientists in the OISM Petition Project
The only type of disagreement that counts is science is published papers. After your paper gets through peer review and is more widely viewed it stands or not. I would the expect the people who created the petition to know this. -
dhogaza at 12:35 PM on 15 March 2010CO2 levels during the late Ordovician
dhogaza (#57), the trouble with the climate models is that they are doing a really poor job thus far.
And this statement is simply incorrect. They do a very good job of recreating paleoclimate scenarios, more recent events like cooling due to Pinatabu (done as a *prediction*, not hindcast), ENSO-like events arise as emergent properties of the major models, etc etc. NASA recently publicized the fact that water vapor feedbacks at various altitudes and with various temperature change scenarios, as measured by the AIRS sensor on the Aqua satellite, matches model predictions for such scenarios. In detail. On and on and on. Model validation efforts do *not* support your contention. And, of course, as far as the fact that we don't see monotonic increases in temperature, but rather a signal with considerable noise, is also consistent with individual model runs that show exactly the same kind of behavior. Again, on and on and on ... -
dhogaza at 12:31 PM on 15 March 2010CO2 levels during the late Ordovician
gallopingcamel:With regard to the link that you kindly provided, the folks who "shot down" L&C09 hardly inspire confidence; RealClimate as a whole fails the objectivity test (unlike this fine web site).
So your objection boils down to an ad hominem (ad sitium?) attack on Real Climate, rather an attack on the arguments made by those who shot down L&C 09. Figures. And Riccardo repeats exactly what I pointed out before:As per L&C09 paper, they didn't prove any model wrong given that they used the wrong ones.
They're essentially arguing that models developed for a totally different purpose prove that the coupled GCMs are wrong. That's like claiming that the low scores typical of soccer matches disprove predictions that professional US basketball teams average about 100 points a game! It's a different game! They're different models! If you are going to defend this, then there's not much reason to converse with you. My guess is that you didn't bother to read the rebuttal at Real Climate, nor the paper itself linked to by yocta. It's fingers-in-the-ears la-la-la L&C09 might be right all they way, eh?For example almost every paper supporting AGW is contradicted by some other paper. They can't all be right.
This statement isn't true. And those that do are typically garbage. G&T claiming that CO2 can't warm the planet because this would violate the 2nd law of thermodynamics. L&C09 cherry picking data then comparing it with models of type A claiming that this proves that models of type B are wrong. -
gallopingcamel at 11:53 AM on 15 March 2010CO2 levels during the late Ordovician
yocta (#60), The peer review process is not a big issue for me. It suffers from the faults and failings of most human endeavors; it should be no surprise that plenty of peer reviewed papers prove to be wrong. For example almost every paper supporting AGW is contradicted by some other paper. They can't all be right. Take the paper at the head of this thread, Royer 2006 and updates such as Royer 2010. You can find a direct rebuttal at: http://www.phys.huji.ac.il/~shaviv/ClimateDebate/RoyerReply.pdf If the experts can't agree and big money is at stake the general public has to figure out who makes the most sense. -
yocta at 09:21 AM on 15 March 2010CO2 levels during the late Ordovician
RE#58 gallopingcamel: Can you please support your claim that climate models "are doing a really poor job thus far."? L&C09 is hardly a silver bullet. You say: With regard to the link that you kindly provided, the folks who "shot down" L&C09 hardly inspire confidence; RealClimate as a whole fails the objectivity Well it didn't take me long by google to actually find the paper that TFOW wrote (in press at the time RealClimate mention it) which is now available through Geophysical Letters. So unless you want to debate the whole peer review process... -
Riccardo at 09:19 AM on 15 March 2010CO2 levels during the late Ordovician
gallopingcamel, the calculations of the forcing takes into account just CO2 but the sensitivity includes feedbacks, e.g. water vapour. Not included are other forcings, natural or related to human emissions, e.g. aerosol, CH4, etc. As per L&C09 paper, they didn't prove any model wrong given that they used the wrong ones. You cannot pull a wheel out from a car and claim it isn't good. Although my analogy is definitely crude, this is more or less (one of?) the mistake in that paper. Please avoid personal opinions on anyone, scientist or commenter, and stick to their science instead. -
gallopingcamel at 08:57 AM on 15 March 2010CO2 levels during the late Ordovician
dhogaza (#57), the trouble with the climate models is that they are doing a really poor job thus far. L&C09 is simply the latest experimental information available and it provides a plausible explanation for the failure of climate models generally. Over the next few years satellite measurements will continue to accumulate and the error bars will shrink. Let's talk again when better information is available. With regard to the link that you kindly provided, the folks who "shot down" L&C09 hardly inspire confidence; RealClimate as a whole fails the objectivity test (unlike this fine web site). Riccardo (#56), Thanks, I stand corrected. I agree that radiative forcing calculations are simplistic when applied to high concentrations or atmospheres that have vapors present (e.g. water or sulphuric acid). -
Doug Bostrom at 06:20 AM on 15 March 2010Guest post: scrutinising the 31,000 scientists in the OISM Petition Project
shawnhet at 05:15 AM on 15 March 2010 It's always better to argue from an informed position. Get the background information you need on climate models here: Simple models of climate change General circulation models of climate -
Tom Dayton at 05:54 AM on 15 March 2010Guest post: scrutinising the 31,000 scientists in the OISM Petition Project
shawnhet, if you want to argue about the predictive power of climate models, the appropriate thread is Models are unreliable. -
Riccardo at 05:30 AM on 15 March 2010Guest post: scrutinising the 31,000 scientists in the OISM Petition Project
shawnhet, very crude claims indeed. The consesus has indeed formed around tons of data, which is what you should expect. The GCMs are not the hypotheis, they're just calculations; it should be quite obvious that model calculations are not a theory, and they never will. But anyways, the ability of GCMs to reproduce climate has been assessed by scientists and the consesus around them, as yo ask, is clear. They reproduce the rise in temperature of the first half of the last century and even the last ten years, at least if you look at the results not as a yearly point by point match but as an overall trend. And no, GCM are not calibrated to the same data they reproduce, this is simply wrong. They are able to describe many other things you overlooked. Then, following your first claim the logical conclusion is that there is consesus both on the AGW theory and on the ability of GCM. What is surprisingly missing is your consensus. -
dhogaza at 05:24 AM on 15 March 2010Guest post: scrutinising the 31,000 scientists in the OISM Petition Project
The point of science is not consensus, it is prediction. If a theory makes good predictions, it will naturally cause the birth of a consensus around it. However, forming a consensus prior to the ability to make predictions doesn't really tell you much.
That's exactly how the mainstream climate science consensus came about. Read Spencer Weart's "The Discovery of Global Warming". Your second paragraph simply demonstrates that you have a lot to learn about GCMs. This: "Since the GCMs were calibrated using the data they are the most effective at "predicting", that doesn't really tell us much." Simply tells us you don't know how they work. And the rest of the paragraph is a blend of speculation. "couldn't've predicted the temperature increase from 1910-1945"? If it were possible to predict changes in solar insolation and frequency of volcanic eruptions decades in the future, well, yes, they *could* have.pretty poorly for the last 10-15 years
Nope. With proper error bars, the models have done fine. Individual model runs show the kind of variability we see in real climate, including periods of faster and slower warming. I suspect you're one of those that believe that since the *average* of many model runs shows "smooth, monotonic warming" that each model run shows the same (they don't) or that models "predict" that climate should do the same (they don't). And my guess is that you're one of those who ignore error bars (which grow rapidly as the timeframe under consideration shrinks) or has been sucked in by baloney such as seen over at lucia's blog. Arguments such as you make have no traction in the scientific community for a reason, I'm afraid - they're just wrong. -
shawnhet at 05:15 AM on 15 March 2010Guest post: scrutinising the 31,000 scientists in the OISM Petition Project
The point of science is not consensus, it is prediction. If a theory makes good predictions, it will naturally cause the birth of a consensus around it. However, forming a consensus prior to the ability to make predictions doesn't really tell you much. If one treats the GCMs as hypotheses and looks at how effective, they would've been at predicting the changes in temperatures over the last 100 years, the only reasonable answer is that they aren't very good at all. They couldn't have predicted the temperature increase from 1910-1945, would've done OK for about 1945-1998, and pretty poorly for the last 10-15 years. Since the GCMs were calibrated using the data they are the most effective at "predicting", that doesn't really tell us much. Cheers, :) -
dhogaza at 02:08 AM on 15 March 2010CO2 levels during the late Ordovician
gallopingcamel ... L&C (2009) was quite thoroughly shot down in a follow-on paper in GRL. And elsewhere ... The best part of the story is how they cherry-picked snippets of data to fit their conclusion, though the bit about using model results that didn't include all changes in forcing to "disprove models" is a close second IMO (the model results they used had been generated to explore response to SST changes only). If they're going to complain that coupled atmosphere-ocean GCMs are giving incorrect results, one would expect them to actually *compare* with such results, wouldn't one? James Annan was quick to pick up on that point. I'm curious, is there any reason you read L&C (2009) in isolation? Or did you simply pick up a summary from one of the usual denial sites? -
Riccardo at 20:13 PM on 14 March 2010CO2 levels during the late Ordovician
gallopingcamel, the often used aproximate relationship between forcing F and CO2 concentration is F(W/m^2)=5.35*ln(C/Co) and the temperature increase DT is proportional to the forcing DT=l*F where l is the climate sensitivity. So you get: DT=5.35*l*ln(C/Co) if you take Co as the current value (380 ppm) and a climate sensitivity of l=0.8 K/(W/m^2) you get different numbers. Anyway, the linear aproximation between DT and F cannot be pushed as far as 10000 ppm. -
Ebel at 20:03 PM on 14 March 2010CO2 levels during the late Ordovician
The greenhouse effect has nothing to do with the heat conductivity - nothing to do with the change due to increase in CO2 concentration. A saturation does not exist. Under saturation, some understand that on the surface of the earth emitted photons hardly reach the universe - but there is strongly absorbed which is also strongly emitted. Instead of reaching the ground than other photons emitted photons the universe - what does that have to do with saturation? With increasing concentration of greenhouse gases is changing the pressure and temperature of the Earth's tropopause increasingly in the direction of Venus and Mars tropopause. The column pressure of CO2 in the Earth's tropopause is approximately 0.11 mbar - this is comparable to the pressures of the Venus and Mars tropopause, which are almost pure CO2 atmospheres. Sincerely, -
Doug Bostrom at 18:32 PM on 14 March 2010Watts Up With That's ignorance regarding Antarctic sea ice
GFW at 15:35 PM on 14 March, 2010 Yeah, the thing about curves is they don't have any notion of where to end. I do think that fitting curves to existing data is an interesting exercise, thought provoking, as long as one does not put on skis and follow the line wherever it leads, no matter how far. -
gallopingcamel at 16:59 PM on 14 March 2010CO2 levels during the late Ordovician
From Peru (#51), according to the IPCC (AR4) climate models the radiative forcing due to CO2 has a logarithmic relationship to global temperature. Thus using your numbers and taking today's conditions as a starting point the relationship between CO2 and global temperature should look like this: 1,000 ppm add 2.5 Celsius 2,000 ppm add 4.4 Celsius 10,000 ppm add 8.8 Celsius While most scientists accept that CO2 has a significant effect some believe that the IPCC exaggerated the scale. For example, Lindzen & Choi (2009) suggest that the radiative forcing is six time weaker than the IPCC says. If L&C09 is correct you can divide the above temperature increases by a factor of 6. The Venusian atmosphere is ~97% CO2 (970,000 ppm). If our atmosphere had the same composition one would expect temperatures to be ~21 Celsius higher than today assuming the IPCC is right. Please note that I am a physicist rather than a climate scientist so the real experts may dispute my numbers! -
GFW at 15:35 PM on 14 March 2010Watts Up With That's ignorance regarding Antarctic sea ice
Hmm, I think Dr. Roper's heart is in the right place, but his curve fits are a little too theoretical and make unwarranted extrapolations. For example, he has this really cool fit to sea level as a function of temperature, but it ignores the fact that with the current configuration of the continents, it doesn't matter how hot it gets - 70 meters sea level rise is about all we can get by melting all the ice. -
GFW at 14:53 PM on 14 March 2010CO2 levels during the late Ordovician
I just realized one could misread my third sentence. Replace with "The temperature at a fixed altitude near the saturation threshold altitude goes up as the concentration of CO2 and the saturation threshold altitude both go up. -
GFW at 14:50 PM on 14 March 2010CO2 levels during the late Ordovician
The thing to understand about saturation is that there is always an altitude above which the absorption is not saturated. That altitude goes up with overall concentration of course. The temperature at that altitude goes up as the concentration goes up. But that means the temperature at every level below that altitude also goes up (search on "atmospheric lapse rate"). -
Philippe Chantreau at 12:27 PM on 14 March 2010Guest post: scrutinising the 31,000 scientists in the OISM Petition Project
I'd go further and highlight thay any scientific field that is studied enough will, at some point, see the emergence of some level of consensus, unless no significant progress is being made in the understanding of that field. Scientific consensus is the normal extension of progressing knowledge. -
From Peru at 11:16 AM on 14 March 2010CO2 levels during the late Ordovician
If we continue to release CO2 to the atmosphere, at what point will the CO2-greenhouse effect saturate (that is, the point at which all the IR in the CO2-absorbed wavelenghts is absorbed, so that any further CO2 concentration increase will have no effect on greenhouse effect)? 1000 ppm? 2000 ppm? 10 000 ppm? By the way, is Venus already CO2-saturated in the CO2 wavelenghts? -
Nick Palmer at 07:06 AM on 14 March 2010Guest post: scrutinising the 31,000 scientists in the OISM Petition Project
Phillippe Chantreau writes: There seems to be some misunderstanding as to what scientific consensus means...The consensus model of Earth climate slowly emerged from all the research being done. Study after study being reviewed and published. It is not a consensus of opinion but of research results Brilliant! - about time somebody highlighted this. The denialists represent the consensus that we talk about basically as meaning that we are saying that a majority of scientists believe a certain thing. All they did with the Oregon petition was craft a cleverly weasel worded statement, as I pointed out earlier in these comments, that enabled them to say 'look - this huge number of "scientists" don't agree with the consensus' and Bob's your Uncle - an enduring denier meme, supremely and successfully misleading to the general public, was born. Perhaps we need to emphasise that it is the enormous weight of evidence and research that is the "consensus" view. -
Doug Bostrom at 06:09 AM on 14 March 2010Watts Up With That's ignorance regarding Antarctic sea ice
A fellow posted here yesterday with a curve fitting/function derivation exercise for Antarctic sea ice versus ozone hole intensity (sorry, not enough coffee yet, can a hole be "intense?"). Antarctic Summer Sea Ice Area Prof. Roper surmises from his exercise that Antarctic sea ice should shortly be heading into decline, but he adds the caveat, "Many more data are needed in the future to make this date more certain." Dr. Roper does some other fun derivations elsewhere on his site, mostly based on paleo data. Interesting to think about. He has a large collection of ruminations on global warming from a physicist's perspective here: Global Warming Web Pages by L. David Roper I hope Dr. Roper will continue to post here. -
Peter Hogarth at 05:42 AM on 14 March 2010Watts Up With That's ignorance regarding Antarctic sea ice
There was a question about how ice melts at -13 C, of course Johns figure 3 is temperature anomaly, with seasonal variations removed. If we put them back in: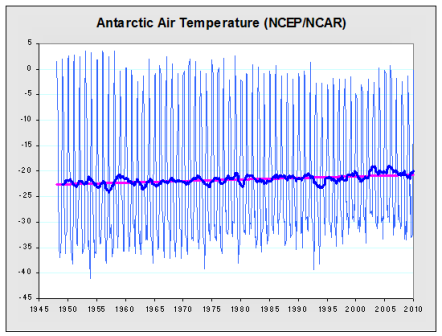 The data is NOAA: http://www.esrl.noaa.gov/psd/cgi-bin/data/timeseries (-70 to -90 latitude loaded). These are monthly values so the summer daily values will be a bit higher judging by the Northern Hemisphere monthly/daily data. Anyway, the chart gives the idea, (temp in summer can get above freezing)...
90.Berényi Péter at 11:18 AM on 11 March, 2010
Nice graphics! the 2002 minimal Ozone hole is curious, but there's bigger dips/peaks in sea ice elsewhere. Though there is good evidence of significant Antarctic sea ice reductions in the 20th century overall, the small upwards trend over past 30 years is the interesting factor.
The data is NOAA: http://www.esrl.noaa.gov/psd/cgi-bin/data/timeseries (-70 to -90 latitude loaded). These are monthly values so the summer daily values will be a bit higher judging by the Northern Hemisphere monthly/daily data. Anyway, the chart gives the idea, (temp in summer can get above freezing)...
90.Berényi Péter at 11:18 AM on 11 March, 2010
Nice graphics! the 2002 minimal Ozone hole is curious, but there's bigger dips/peaks in sea ice elsewhere. Though there is good evidence of significant Antarctic sea ice reductions in the 20th century overall, the small upwards trend over past 30 years is the interesting factor.
Prev 2439 2440 2441 2442 2443 2444 2445 2446 2447 2448 2449 2450 2451 2452 2453 2454 Next


