


 Arguments


Recent Comments
Prev 2441 2442 2443 2444 2445 2446 2447 2448 2449 2450 2451 2452 2453 2454 2455 2456 Next
Comments 122401 to 122450:
-
Riccardo at 07:29 AM on 8 April 2010Ocean acidification: Global warming's evil twin
I found some common misconceptions over the internet and here in the comments. The first, and the least important, is the use of the word acidification. Doug already clarified the meaning and its use; but neverthless, it's obviously irrelevant. Call it de-alkalinization or pH change, it doesn't matter, what's important is the effect. Some people think that CO2 in water forms HCO3- plus H+, the former then decomposes into CO3-- plus H+ and then increasing CO2 will increase CO3--. If true, it would favour the formation of calcium carbonate. Unfortunately, the opposite is true. The buffering effect to CO2 induced pH reduction consists in limiting the H+ concentration increase by formation of more HCO3- at the expenses of CO3--. Calcification is then limited not by availability of Ca++ but by CO3-- concentration, which is declining along with pH. pH has the same fate as CO2 in the sense that skeptics claim, for example, that it's not true that pH reduction influences corals growth, the latter being related to temperature. Did anyone ever say that corals growth is governed just by pH? Corals, as well as other shell forming organisms, respond (among other things) to temperature, true; but a reduced pH will increase their stress and limit the resilience to increasing temperature. Other human induced stresses (pollution) come also into play and clearly more stress means less resilience. Similarly, no one ever said that all species are getting into trouble, at least not in the short run. For example, some organisms (e.g. foraminifera) form calcite while others (e.g. corals) aragonite structures. The latter is more soluble than the former, so it is expected that aragonite forming organisms will be more vulnerable to pH reductions. And this is not the whole story. Some organisms, for example, are able to use different chemical paths to form their shells making them much more resilient to water acidification. The last myth that comes to my mind is that you need to have an acidic water (pH<7) to have any impact on calcium carbonate dissolution. This is not true, any alteration of a chemical equilibrium brings the reaction one way or another. -
JRuss at 07:22 AM on 8 April 2010Ocean acidification: Global warming's evil twin
The solubility of carbon dioxide in water varies greatly with temperature and pressure. At the surface of the ocean, [760 mm Hg] the solubility in grams of CO2 in 100 g (pure water)is .3346 @ 0 C, .2318 @ 10 C, .1688 @ 20 C, .1257 @ 30 C, etc. Global warming warms the ocean surface causing release of CO2. Global cooling allows the ocean to absorb CO2 as the ocean cools. But in the deep oceans there are lakes of almost pure CO2. Presumably, much of this is from under sea volcanoes where the pressure is high enough for CO2 to liquefy, and being denser the water, fall to the ocean floor. Slowly, this CO2 does migrate to the ocean surface. During the global cooling from 2004 to 2009, our oceans did absorb more CO2 resulting in a decrease in pH. Now that our globe is again warming, I expect the oceans to release vast quantities of CO2 and thus increase the pH of the ocean's surface. During of period of global warming, the amount of oceanic release of CO2 can be greater then all from all the power plants and vehicles man has made. -
From Peru at 06:52 AM on 8 April 2010Ocean acidification: Global warming's evil twin
So the K-T impact caused cooling or warming? Or to be more explicit, what happened , a "Nuclear Winter" or a "Greenhouse Oven"? Dinosaurs died frozen or cooked? -
Marcel Bökstedt at 06:02 AM on 8 April 2010Southern sea ice is increasing
I’m not convinced that this problem is well understood yet. My feeling is that it is dangerous to use data from the sea off Antarctica as evidence either for or against AGW, until there is a consistent model covering the whole area. Unfortunately, it might not be so easy to provide one. I’ve been trying to read the literature, and intend to give my dumbed down version of it below, in the hope that someone with more expertise can correct me. OBSERVATIONS: Much of this depends on the “reanalysis” project, that tries to reconstruct climate data for the period 1957-96. It seems clear from Boning el al that there is a measured warming trend of the water of the Southern Ocean (between 30 and 60 degrees south, down to 2000 meters). The reanalysis of temperature records seem (Zhang) to show that in the interval 1979-2004 the air surface temperature in the much smaller “ice covered area” around Antarctica has been rising. There is also a measured increase in Antarctic sea ice extent (Turner et al and references therein) In addition to this there is also a further measured change, related to the Antarctic Oscillation (also called Southern Annular Mode). There are two modes (Thompson & Solomon): High index means cold polar temperatures, strong western winds, and low index means the opposite. This index has been rising, increasing winds and decreasing polar temperature. There is evidence that this development is driven by the “ozone hole”. All of the above seem to comparatively safe. In particular the simplistic argument “more ice means the South Polar Sea is colder” is nonsense, we do know that the Polar Sea is getting warmer, so that the extent of ice on the Ocean is definitely a bad proxy for temperature, But when it comes to explanations of what we see, things look a lot more murky to me. Two main players seem to be the layering of the Southern Ocean water (less dense water above denser water) and the constant western winds around 60 degree. THE EKMAN SPIRAL: The wind possibly contributes to the mixing of layers in an interesting way: the wind drives an ocean current which runs around the Antarctic moving from West to East. This current extends down into the ocean, with the surface water moving fastest, and deeper water moving in the same direction, but slower, Because of the Coriolis effect, the current will try to veer to the left, which means towards the North. Now, since the surface water moves faster than the deeper water, the net effect is stronger at the surface, So surface water will move to the North, which forces deep water to the south. This creates a down-welling North of the current, and an upwelling South of the current. This whole business is called an Ekman spiral. BONING: The paper by Boning et al. quotes measurements that seem to show that even if the circumpolar winds have been increasing, that “Ekman spiral” has not become stronger. They believe that the reason for this is that the increased wind also produces more eddies, which confuse the whole picture. They note the the models that has been used cannot resolve those eddies (they are too small). If they are right, the lack of enhanced mixing of layers in the ocean is not yet theoretically understood. ZHANG: Zhang’s paper is a pure model study The main point of the article is that he can construct a model of the South Sea that agrees with two important seemingly contradictory measured factS: it has a warming ocean, but an increase in sea ice. I think that the mechanism proposed by Zhang is slightly (but not essentially) different from what John describes. The motor driving various changes is the increase in surface temperature. This initially leads to a decrease in production of new sea ice. The top water gets warmer and less salty. Both these changes work in the same direction, they both make the top layer less dense. The next thing that happens is that since the top layer is gets dense, there is less upwelling of warm water. This means that less ice is melted. So now, both less ice is created and less ice is melted. The model says that the change in melting is bigger than the change in the creation of new ice, so the net effect is that we get less ice. But wait? If less ice melts in the top layer, the salinity will increase, counteracting the previous effect? Zhang says that this is so, but we still have to take the warming of the top layer into account! This warming makes the top layer lighter, decreasing mixing of layers. So now there are lots of things going on: Since the top water gets warmer, less ice is produced. On the other hand, less ice is melted by upwelling deeper warm water. Then there is precipitation, but Zhang does not believe that the increase in precipitation is the decisive effect. And the sum of the three effects "creating less new ice", “destroying less old ice" and "warming the water" is actually that the top layer gets less dense - driving the cycle. This all seems a bit subtle for my taste, taking the big uncertainties into account. For instance, what happened to Boning’s eddies, which were supposed to be important? But at least this is a testable model. TURNER: This paper seems to ignore questions of up and down convection in the oceans, the questions that dominated Boning et al. and Zhang.et al. Instead it focuses on the strengthening of the western wind – the high index of the Antarctic oscillation. Another important point of this paper is that they break down the increase in sea ice into geographical areas and seasons. In particular, the ice in the Ross sea (close to the pole) has been increasing, while the ice in the Bellinghausen-Amundsen sea (father from the pole) has been decreasing. This is clearly important, and the regional differences should be explained. There is some modeling going on, but the upshot seems to be unclear (they conclude that it could all be natural variability). The paper is often cited for explaining increased sea ice by the polynyas in the Ross sea. It seems to me that they only suggest this mechanism, but they don’t give strong arguments for it. Possibly I’m missing something. -
Alexandre at 05:17 AM on 8 April 2010Are we too stupid?
Jacob #56 Axelrod shows that a cluster of cooperating individuals can displace the defectors and persist against mutations, making tit-for-tat evolutionary stable. In other words, the fisherman could try to convince a small group to put trust in him. I´ll try to find the time to have a look at Axelrod´s paper. Ostrom´s research finds something different: even though she detects that impulse of autruistically staying within the rules, when you don´t have means to enforce the rule, in her lab experiments and field research, this usually collapses as free riders appear more and more. Of course, some means to "enforce the rules" can be some informal, cultural behaviour like diminishing one´s reputation or maybe some physical harassment. This has been observed in small fisher communities, for example. But I don´t see this working in some nationwide scale, let alone worldwide. BTW, in environmental issues I have never seen any successful case of solving air pollution without proper legislation. This is the coercion option Hardin finally resorts to in his paper. Not having the results of Axelrod and followers he still faces the problem of how to agree on the necessary reform. Coercion is a necessary part of any law. The most successful stories involve the users themselves working out an agreement (even if they resort to the state´s coercive power to enforce it). To reach the agreement can be difficult, but it´s a necessary step. You see any alternative? This is why Milinski's results are so interesting: it can be handled using indirect reciprocity alone. I assume you mean some kind of voluntary action that would lead to the agents "preferring" to stay within the rules (even if informal rules). I don´t see this happening in large scale (nation, world). And I don´t know any success stories with something as diffuse as air pollution. Think of car gas emissions - that´s only within a city, and I´ve never seen a city controlling this kind of pollution with indirect reciprocitiy alone. -
Ned at 05:09 AM on 8 April 2010Ocean acidification: Global warming's evil twin
RSVP writes: "there are other examples of mass-extinctions coinciding with global warming and increases in atmospheric carbon dioxide" If I am not mistaken, in previous posts, arguments have been made against anthropogenic global warming as being faster than historically warmer periods produced solely by nature. Here is a switch that simply proves mankind is just as much a part of nature as anything else. You're right. In the 4.5 billion year history of the Earth, there have been six or more brief episodes of extreme climate change that each killed off a large fraction of life on the planet. If you use that as your yardstick, then our impact on the planet is not unprecedented in magnitude. I'm not sure what the policy relevance of this is, however. Does the fact that AGW won't be worse than a comet slamming into Yucatan mean that we shouldn't bother trying to prevent or reduce the impact of AGW? That's setting a pretty high bar for action, IMHO. -
Tom Dayton at 03:42 AM on 8 April 2010A database of peer-reviewed papers on climate change
Following up on Dennis's comment, compare E&E's web site to the clear and complete information for authors on the web site of the journal Science. -
Dennis at 03:35 AM on 8 April 2010A database of peer-reviewed papers on climate change
Poptech @29: You wrote: "E&E does use a real peer-review process as I have stated multiple times." You've stated that, but haven't provided any evidence beyond writing E&E "follows the standard academic review process." Can you direct us to evidence for that? I have found nothing of value from the E&E website -- no policy statement, no links to a parent organization's policy, nor the names of scientific peers who oversee the process. -
Ned at 03:33 AM on 8 April 2010Oceans are cooling
All that said, I think Doug Bostrom has the most important point here: Without doing more work, neither of us can be believed. The problem is, neither of us really knows what we're talking about here, not with the degree of expertise needed to sort out the instrumentation problem you believe you see. Fortunately, we amateurs are not the last word on this matter, instead we've got actual scientists working on the case. I concur entirely with this. -
Ned at 03:28 AM on 8 April 2010Oceans are cooling
BP writes: Anyway. Even by eyeballing (and disregarding lack of significance) the trend between 1959-2001 is 0.2 × 10²² J/year perhaps. It translates to a 0.12 W/m2 net "forcing" at TOA on average during this 42 years long interval. This seems a bit low. I get 0.26 W/m2 at the ocean surface, not 0.12 TOA, and TOA should be *higher* because of the albedo. Trend +2.4E21 J/year OHC700 (Ishii) or +3.2 (Levitus) or +4.1 (Domingues), from Levitus 2009 Conversion to watts 7.6E13 (Ishii) or 1.0E14 (Levitus) or 1.3E14 (Domingues) Area of oceans 3.61E14 m2 Trend at surface, not TOA +0.21 W/m2 (Ishii) or 0.28 W/m2 (Levitus) or 0.36 (Domingues) For comparison, NASA GISS has a table of annual net radiative forcings here. If you take the 1969-2003 forcings, multiply them by the area of the ocean and convert to J/year, the average over that time period is 1.0E22 J/year. So the OHC700 trend from those three papers is anywhere from 24% to 41% of what GISS suggests it should be. That's a bit low, even assuming some of the heat is going into the ocean below 700m. I'm going to have to read and think more about this; I may be forgetting something. For comparison, Domingues shows the following figure comparing their results to model predictions, including those of GISS: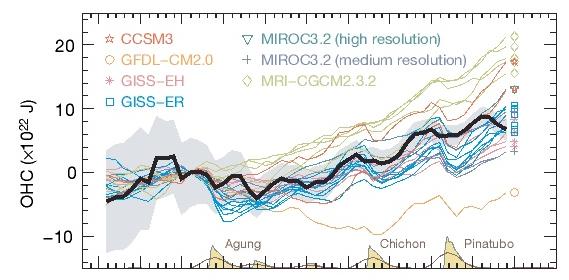 That seems to show their observations falling nicely in the middle of the ensemble of models, which is hard to reconcile with a trend that's only 24% to 41% of what would be predicted from forcings. Unfortunately at the moment Nature's website seems to be down so I'll have to go back and reread Domingues later to see how they explain this.
-
John Cross at 03:19 AM on 8 April 2010Ocean acidification: Global warming's evil twin
GFW: Part of your answer is that during ice ages, carbon is sequestered in the land in the form of dead vegetation. As the ice then recedes the vegetation can decay and CO2 is released. Regards, John -
Riccardo at 02:49 AM on 8 April 2010Oceans are cooling
I agree with Berényi Péter, it's a travesty that we can not track the energy flow through the climate system ... More details in the well known Trenberth's paper. -
GFW at 02:36 AM on 8 April 2010Ocean acidification: Global warming's evil twin
Ah, at least part of the answer to my question at 13 is likely to be related to the answer to johnd's questions at 11 regarding the definition of "surface". -
GFW at 02:33 AM on 8 April 2010Ocean acidification: Global warming's evil twin
Figure 1 suggests that dissolved CO2 in the ocean is historically in near equilibrium with atmospheric CO2. That makes sense given the rather large contact area. But it raises a huge question for me, one that must have been answered somewhere but I've so far not stumbled on it. What is the actual form of the carbon sink that interchanges with the atmosphere to form the Milankovitch-driven glacial cycle? My understanding is that in the slow cooling phase of the cycle, carbon is sequestered at the bottom of the ocean via the "rain" of dead organisms. If that understanding is correct, how does that reverse during the (relatively fast) warming phase of the cycle? -
Doug Bostrom at 02:27 AM on 8 April 2010Ocean acidification: Global warming's evil twin
RSVP, there's a fundamental difference between us and much of the rest of nature. Unlike a large rock following a deterministic Newtonian existence leading to an orbital rendezvous with Earth, we're not mindless, we have some iota of influence on our destiny. We've sprung from nature, but for better or worse we've transcended a limitation shared by most other features of the natural world and have got a least a few levers of control in our hands. We're not supposed to be "dumb as a rock"; to be mindless is no longer in our nature. -
Doug Bostrom at 02:13 AM on 8 April 2010Oceans are cooling
Berényi Péter, you do need to supply a hypothesis better than simply being suspicious of what could be a coincidental string of increases in observed OHC over 3 years. That's not really a workable hypothesis at all, not without elaboration. Assuming your notion about instrumentation changes is valid, I think you're missing a potential explanation for the "anomalous jump" you see, namely that adding instrumentation improved our ability to measure OHC. If I buy into the idea that 3 years of increasing OHC is down to instrumentation issues, I can as easily say the increase is due to better perception as you may say it's an error introduced by instrumentation changes. Without doing more work, neither of us can be believed. The problem is, neither of us really knows what we're talking about here, not with the degree of expertise needed to sort out the instrumentation problem you believe you see. Fortunately, we amateurs are not the last word on this matter, instead we've got actual scientists working on the case. After all of our handwaving is finished, they're still the horse's mouth with regard to this issue. -
johnd at 02:13 AM on 8 April 2010Ocean acidification: Global warming's evil twin
When the term "surface water" is used in relation to the oceans, it is generally used to identify a specific zone within the ocean. However it seems in this thread that the terms Ocean pH and surface water pH are both being used and interchanged, even in the OP graph. When surface water pH is mentioned, what depth of water is it referring to? When Ocean pH is mentioned does this refer to the full depth of the entire ocean or just different terminology that actually means surface water pH? For clarity perhaps it needs to be defined what each refers to, especially when pH values are being mentioned. -
RSVP at 01:59 AM on 8 April 2010Ocean acidification: Global warming's evil twin
"there are other examples of mass-extinctions coinciding with global warming and increases in atmospheric carbon dioxide" If I am not mistaken, in previous posts, arguments have been made against anthropogenic global warming as being faster than historically warmer periods produced solely by nature. Here is a switch that simply proves mankind is just as much a part of nature as anything else.Response: The one example of time-frames used above is the PETM which occured over a time-frame of thousands of years. This is substantially slower (at least an order of magnitude) than current warming. It's not just the amount of CO2 that we're emitting that is the problem with global warming - the rate is also important because climate is changing faster than nature is able to adapt. So while there have been other past periods where climate changed faster than nature could adapt, current conditions are even worse.
The primary lesson when looking at past climate change is that it gives us insights into how the planet responds to changes such as more atmospheric CO2 and/or disturbances in energy balance. And what we learn is that the planet is highly sensitive to changes in energy imbalance and that extinction rates increase when the climate change is more rapid. -
Berényi Péter at 01:32 AM on 8 April 2010Oceans are cooling
#15 doug_bostrom at 04:47 AM on 7 April, 2010 why should we arbitrarily decide a particular year's increase is an error simply because it's the largest difference on the graph? I have explained it above. The energy needed to create such a jump is missing. you should supply a hypothesis to explain how one year's error can influence subsequent derivations of OHC? No, I do not have to. But I have already supplied one anyway. Instrumentation and coverage changed a lot between fourth quarter 2002 & third quarter 2003.
-
John Cross at 01:25 AM on 8 April 2010Ocean acidification: Global warming's evil twin
I was going to comment on what acidification means, but Doug did that. Then I was going to post about averaging large numbers but Tom did that. All I can do is to back up Tom's point with a link to Taminos. John -
Tom Dayton at 01:21 AM on 8 April 2010Ocean acidification: Global warming's evil twin
fydijkstra wrote "3. The oceans have a huge buffering capacity." Of course. But actual measurements reveal that the buffering is insufficient, because the pH has changed despite that buffering. That's not speculation, it is measurement. You wrote "5. A shift of the pH from 8.3 to 8.1 is not serious for most organism." Your statement is too vague to be useful, or even meaningful. If you actually read the actual scientific papers you will see highly specific descriptions of exactly what the consequences are expected to be, not just for individual species directly affected by such pH changes, but also for other species affected by the cascading effects such as disruption of the food chain. -
Tom Dayton at 01:10 AM on 8 April 2010Ocean acidification: Global warming's evil twin
fydijkstra wrote"2. Just as a global temperature, 'the' global ocean pH does not exist. We have only calculations of the average of various separate measurements. The accuracy of such an average can be estimated at 0.15 pH-units. This means, that the pH shift that is found now, is only slightly more than the error in the measurement. Statisticians have an expression for such a difference: ‘not significant’."
Of course both "global temperature" and "global ocean pH" are expressed as averages. Your misinterpretation of the standard uses of those terms is just as pointless and distracting as your misinterpretation of the term "acidification," as Doug pointed out. Regarding the "accuracy" of the average pH measurement: Randomly distributed errors in the individual measurements cancel each other, increasing confidence in the average measurement as the number of measurements increases. Read about the Law of Large Numbers. Statistical significance is not calculated as simply as you described. -
Berényi Péter at 01:03 AM on 8 April 2010Oceans are cooling
#15 Ned at 05:04 AM on 7 April, 2010 What strikes me about this figure is how close the agreement is among the three different teams By the year 2004 the difference between Leviticus vs. Ishii & Kimoto is more than 6 × 10²² J. Of course you can call this agreement close, provided the meaning of this word is redefined. In fact the discrepancy between them is so large, that huge error bars are needed to make them consistent. With those error bars I would be surprised to find a trend different from zero at any reasonable level of significance. It would be nice to have all the data in digital format and perform such a test. Anyway. Even by eyeballing (and disregarding lack of significance) the trend between 1959-2001 is 0.2 × 10²² J/year perhaps. It translates to a 0.12 W/m2 net "forcing" at TOA on average during this 42 years long interval.
On the other hand according to the Mauna Loa record, CO2 has increased from 315.98 ppmv to 371.07 ppmv. If we accept the estimated sensitivity of 3.7 W/m2 for carbon dioxide doubling given in IPCC AR4 WGI 2.3.1 as a reference point, it should mean a 0.86 W/m2 increase in "forcing" by the year 2001 relative to 1959.
Log CO2 being almost linear, average should have been 0.43 W/m2. More than 70% of it is nowhere to be found. And not even feedbacks are taken into account yet. With them the effect measured is barely more than 10% of the radiative imbalance projected by IPCC.
The artificial jump of 2003 introduced by Levicus at al. would not improve the situation much. It would make the figure above 15-20% perhaps (of expectations based on mainstream climate science).
Either OHC history reconstructions are useless or theory misses some strong negative feedback.
Anyway. Even by eyeballing (and disregarding lack of significance) the trend between 1959-2001 is 0.2 × 10²² J/year perhaps. It translates to a 0.12 W/m2 net "forcing" at TOA on average during this 42 years long interval.
On the other hand according to the Mauna Loa record, CO2 has increased from 315.98 ppmv to 371.07 ppmv. If we accept the estimated sensitivity of 3.7 W/m2 for carbon dioxide doubling given in IPCC AR4 WGI 2.3.1 as a reference point, it should mean a 0.86 W/m2 increase in "forcing" by the year 2001 relative to 1959.
Log CO2 being almost linear, average should have been 0.43 W/m2. More than 70% of it is nowhere to be found. And not even feedbacks are taken into account yet. With them the effect measured is barely more than 10% of the radiative imbalance projected by IPCC.
The artificial jump of 2003 introduced by Levicus at al. would not improve the situation much. It would make the figure above 15-20% perhaps (of expectations based on mainstream climate science).
Either OHC history reconstructions are useless or theory misses some strong negative feedback.
-
Doug Bostrom at 00:39 AM on 8 April 2010Ocean acidification: Global warming's evil twin
fydijkstra, it seems this word "acidification" touches a hot button for a lot of folks, perhaps the same way as does thinking of C02 as a pollutant. When the relative pH number is reduced, a solution is said to be "acidified." It's a convention in our language you're not going to be able to change. It's the same deal as speaking of relative temperature. A gas at 2,500 degrees C is said to "cool" if its temperature is later found to be at 2,400 degrees centigrade. It's not cool by any means, but it has cooled. Easy, eh? Getting hung up on this point does the rest of your post no credit. -
gallopingcamel at 00:35 AM on 8 April 2010What CO2 level would cause the Greenland ice sheet to collapse?
Ned (#80), My apologies for taking so long to get back to you. The response from Environment Canada arrived a few minutes ago. Here it is: From: Env Canada Weather-Météo -
fydijkstra at 00:21 AM on 8 April 2010Ocean acidification: Global warming's evil twin
1. Neutral water has a pH of 7, below 7 we call it acid, above 7 it is alkaline. With a pH of 8.1 we cannot speak of acidification. The ocean remains alkaline, though slightly less al-kaline. 2. Just as a global temperature, 'the' global ocean pH does not exist. We have only calcula-tions of the average of various separate measurements. The accuracy of such an average can be estimated at 0.15 pH-units. This means, that the pH shift that is found now, is only slightly more than the error in the measurement. Statisticians have an expression for such a difference: ‘not significant’. 3. The oceans have a huge buffering capacity. Excess CO2 is neutralized by chemical and biological mechanisms. Calcification by phytoplankton removes a lot of CO2, which is stored in the cell walls, and deposited to the bottom after death of the plankton cells. Maybe these buffering mechanisms are is the reason that the pH – as found in ice-cores – has never decreased below 8.1, nor has it risen above 8.3 in the past 800,000 years. 4. By the way, I would not simply accept pH-measurements in 800,000 year old ice cores. The assumption that the chemical composition of the ice cap and the air bubbles within it has not changed for 800,000 years – under hundreds of bars of pressure – is unproven. CO2-measurements in ice caps conflict with stomata-indices, that show that 10,000 years ago the CO2-concentration was higher than today. Nevertheless no biological disasters happened at that time. 5. A shift of the pH from 8.3 to 8.1 is not serious for most organism. An optimum pH-range of 0.5 to 1.0 pH-units is normal. I myself studied the growth of mushroom mycelium, and found optimal growth in the pH range from 6.5 to 7.5. Small shifts in pH are biologically insignificant. 6. Predictions of a further drop in pH by 0.3 or 0.4 units are highly speculative, as long as the buffer mechanisms of the oceans are insufficiently understood. -
Ned at 23:58 PM on 7 April 2010Ocean acidification: Global warming's evil twin
I wrote: a mass extinction caused a comet impact [...] Er, that obviously should have been "a mass extinction caused by a comet impact" The mass extinction did not in fact cause the comet impact. -
Ned at 23:56 PM on 7 April 2010Ocean acidification: Global warming's evil twin
Thanks for an interesting post, John. I had not seen the Pelejero 2010 paper before. One small note. John Cook writes: A similar situation occurred 65 million years ago during the Cretaceous–Tertiary extinction event. Most of the planktonic calcifying species became rare or disappeared. Readers might wonder why a mass extinction caused a comet impact would show signals of ocean acidification. It was initially assumed that the main impact (pun not intended) of the K-T event would have been rapid global cooling caused by the injection of dust and aerosols into the stratosphere. But in recent years geoscientists have realized that the carbonate rocks at the site of the Chicxulub crater would have provided a massive pulse of carbon into the atmosphere. This would initially have been primarily in the form of CO, which would have rapidly evolved into tropospheric ozone, CH4, and ultimately CO2. The result would be a very rapid and intense warming -- RF probably peaked around 8 W/m2, dropping to 2 W/m2 by year 10 as the CO, O3, and CH4 evolved into CO2. From year 10 on, the warming episode would have persisted for centuries thanks to the long lifetime of the CO2 pulse. Fig. 6 from Kawaragi et al. 2009. (a) Temporal evolutions of change in abundances of CO, CH4, O3, and OH after the Chicxulub impact. The amounts of CO and NO released into the atmosphere are assumed to be 2.8 × 10¹⁶ mol and 5.0 × 10¹³ mol, respectively. (b) Temporal evolutions of radiative forcing of tropospheric O3, CH4, CO2, and their total. The radiative forcing of CO2 is the sum of contribution of CO2 oxidized from CO through photochemical reactions and shock-induced CO2. Right vertical axis represents the increase in surface temperature corresponding to the radiative forcing.
That long-lived pulse of CO2 from carbonate rocks at Chicxulub is presumably the explanation for the signs of ocean acidification at the K-T impact. Massive flood basalt outbreaks at the Deccan Traps would also have released a lot of CO2, and is also widely suspected to be implicated.
Fig. 6 from Kawaragi et al. 2009. (a) Temporal evolutions of change in abundances of CO, CH4, O3, and OH after the Chicxulub impact. The amounts of CO and NO released into the atmosphere are assumed to be 2.8 × 10¹⁶ mol and 5.0 × 10¹³ mol, respectively. (b) Temporal evolutions of radiative forcing of tropospheric O3, CH4, CO2, and their total. The radiative forcing of CO2 is the sum of contribution of CO2 oxidized from CO through photochemical reactions and shock-induced CO2. Right vertical axis represents the increase in surface temperature corresponding to the radiative forcing.
That long-lived pulse of CO2 from carbonate rocks at Chicxulub is presumably the explanation for the signs of ocean acidification at the K-T impact. Massive flood basalt outbreaks at the Deccan Traps would also have released a lot of CO2, and is also widely suspected to be implicated.
-
tobyjoyce at 23:51 PM on 7 April 2010Are we too stupid?
I have just realised that I viewed a "tragedy of the commons" firsthand. May be off-topic - let the moderator decide. My family came in a long line of West of Ireland sheep-farmers in hilly country (think of the Scottish highlands). While the lowlands were divided up and walled, the upper hill slopes were known as "commonage". Those with commonage rights could graze their sheep there, and had "turbary" - the right to dig peat from the bogs for winter fuel. My father was a large landowner (he counted as a "rancher":)) I can remember plenty of land conflicts, but never one that involved the commonage. The areas were we had commonage, associated with the purchase of adjacent land, I could not grasp - but my mother claimed she knew every inch. How was the commonage so well policed? I think because all the conditions conditions Jacob mentions were in place: a) social punishment - a family overstocking the commonage would receive strong social sanction, not to mention finding their sheep had mysteriously jumped off a cliff. b) the population is sufficiently enlightened about the facts - there was a accepted social equality among the sheep-farmers, & a great spirit of assistance at lambing and sheep-shearing. It was not all about fear of a). c) everybody knows that they will pay a price if they do not contribute in time. The "laws" of the commonage were ingrained in custom, and the sanctions were well known. So where was the tragedy? Well, it came about through an external source - the European Union. Through the Common Agricultural Policy, farmers started to receive "headage" grants for the number of sheep they owned. This encouraged overgrazing. Furthermore, EU law did not recognise "commonage", so farmers were encouraged to formally divide the slopes into plots of land like the lowlands. It has come to pass that the remaining farmers (in the larger holdings)are dependent on handouts, the slopes overgrazed and the lakes polluted by sheep droppings. It was not exactly as Hardin imagined it, because the farmers were persuaded by an outside source (politicians, government advisers, lawyers) rather than self-motivated. But it was close enough. Also, the older "commonage" was not Utopia. Most of the small farmers had uneconomic holdings and were dependent on small handouts anyway (known as "farmer's dole"). But, environmentally, the unwritten commonage rights brought about better land management than modern, formal legal rights. My questions are: Is there a lesson here? What would a modern libertarian or legal positivist make of all this? -
Arkadiusz Semczyszak at 23:25 PM on 7 April 2010Ocean acidification: Global warming's evil twin
In all such a long article that JC has not entered the ocean pH will have for 100 x ? years. And ... will always be a > 7 ... I’m looking - maybe on number of the fossils calcareous Ammonites genera in Triassic/Jurassic/Cretaceous (W.J. Kennedy 1977 in Patterns of Evolution, Amsterdam) and The Bahamas Banks, and comparison with carbon dioxide concentration in T/J/C oceanic (probably even > 4 x higher than It is a modern) and air (see: for example http://upload.wikimedia.org/wikipedia/commons/7/76/Phanerozoic_Carbon_Dioxide.png) and temperature in this period (perhaps http://www.nzetc.org/etexts/Bio16Tuat01/Bio16Tuat01_004a.jpg) I can see great correlations in this older geological period: higher p.CO2, temperature = higher calcareous biomasses …, specifically by Ammonites: ~215 millions years BP = maximum - ~ 180 of genera, and 600 - 2100 ppmv CO2 , ~110 m. years BP = maximum - 180 of genera, and 500 - 2300 ppmv CO2,; similarly what about a temperature. In the Triassic/Jurassic/Cretaceous a calcareous organisms are like warm… What about modern times? M. D. Iglesias-Rodriguez et al, in: Phytoplankton Calcification in a High-CO2 World - Science, 18.04.2008 (downloadable from http://www.sb-roscoff.fr/Phyto/index.php?option=com_docman&task=doc_details&gid=418&Itemid=112); say: “From the mid-Mesozoic, coccolithophores have been major calcium carbonate producers in the world's oceans, today accounting for about a third of the total marine CaCO3 production.” “Field evidence from the deep ocean is consistent with these laboratory conclusions, indicating that over the past 220 years there has been a 40% increase in average coccolith mass.” I remind You same important papers (as I think) from Idso: “In a study of calcification rates of massive Porites coral colonies from the Great Barrier Reef (GBR), Lough and Barnes (1997) found that "the 20th century has witnessed the second highest period of above average calcification in the past 237 years." “Buddemeier et al. (2004) have continued to claim that the ongoing rise in the air's CO 2 content and its predicted ability to lower surface ocean water pH (which is also a key claim of Orr et al .) will dramatically decrease coral calcification rates, which they say could lead to "a slow-down or reversal of reef-building and the potential loss of reef structures in the future." However, they have been forced to acknowledge that "temperature and calcification rates are correlated, and [real-world] corals have so far responded more to increases in water temperature (growing faster through increased metabolism and the increased photosynthetic rates of their zooxanthellae) than to decreases in carbonate ion concentration." -
Jacob Bock Axelsen at 22:57 PM on 7 April 2010Are we too stupid?
Alexandre "Our fisherman, alone, may choose to go on fishing even if he values the long term." Axelrod shows that a cluster of cooperating individuals can displace the defectors and persist against mutations, making tit-for-tat evolutionary stable. In other words, the fisherman could try to convince a small group to put trust in him. He can also make the consumers discriminate against the defectors through indirect reciprocity by them favoring the single cooperator. This might not be hard as the consumers are also interested in a steady flow of fish in the future. "The only way out is to articulate a rule of use of the resource - collectively- and find a way to enforce it." This is the coercion option Hardin finally resorts to in his paper. Not having the results of Axelrod and followers he still faces the problem of how to agree on the necessary reform. "I'd say CO2 emissions are on the high end of difficulty for this kind of game. Worldwide, difficult to monitor, no direct or immediate consequences to the cheater..." It is clearly safe to say that it is a hard problem. This is why Milinski's results are so interesting: it can be handled using indirect reciprocity alone. It is not easy to hide a coal power plant, so this may be published. The media attention will affect the legislation and thus the defecting country can be indirectly punished by regulating consumer patterns. -
Ned at 22:22 PM on 7 April 2010Are we too stupid?
gallopingcamel writes: You mention CO2 "lagging". I think that fact alone destroys the idea that CO2 provides dominant forcing for global temperatures. When temperatures are rising, CO2 gets released into the atmosphere ~600 years later, nudging temperatures higher still. I'm really disappointed and frankly discouraged that you'd bring up this "lag proves that CO2 doesn't cause warming" claim. I would expect that from someone whose only familiarity with climate change issues is coming from websites like WUWT. I wouldn't expect it from someone like yourself who's spent many days reading and posting on this site. John Cook explains why CO2 lags temperature in the Pleistocene glacial/interglacial record here: CO2 lags temperature - what does it mean? It was also the subject of a blog post from just a few months ago (Why does CO2 lag temperature?). More recently, the subject of the CO2 time lag came up in this thread. One commenter suggested that in the paleoclimate record CO2 has never led temperature, always lagged. I responded by (a) explaining that this is an illogical argument, and (b) there have been many cases where CO2 changes preceded (and caused) changes in temperature. There are lots of other relevant comments in that thread as well. In fact, you yourself were part of that discussion! Help us out here, GC. What can we do to keep the same mistaken claims from popping up over and over and over again? I'm sure you're not deliberately trying to be provocative. So what's up? -
Alexandre at 22:19 PM on 7 April 2010Are we too stupid?
oops. for some reason, the link above came out wrong. Here's the right link to Ostroms Wikipedia page. -
Alexandre at 22:17 PM on 7 April 2010Are we too stupid?
Ostrom's research summarized in the Wikipedia page. -
Alexandre at 22:01 PM on 7 April 2010Are we too stupid?
Riccardo, I totally agree. And I would add that you're not able to (individually) find a way out of the Tragedy of the Commons even if you are aware of it. Try to picture the fisherman that notices his results diminishing, and he knows it's because of overharvesting. If he chooses to fish less, he will suffer the cost of this decision, and he will not increase the chances of perpetuating the resource (in the individual decision). Chances are, he will only leave more fish for other fishermen to overharvest. Our fisherman, alone, may choose to go on fishing even if he values the long term. The only way out is to articulate a rule of use of the resource - collectively- and find a way to enforce it. I'd say CO2 emissions are on the high end of difficulty for this kind of game. Worldwide, difficult to monitor, no direct or immediate consequences to the cheater... It's so diffuse that you have whole countries attempting to free-ride. I again suggest Elinor Ostrom's work. She even uses Game Theory as an initial test hypothesis - it's useful, but human behavior proves to be more complex than that. -
Marcus at 21:58 PM on 7 April 2010Are we too stupid?
embb accuses me of setting up a "convenient straw man" in blaming the Oil Industry for the bulk of the skepticism out there. In truth, I'm just telling it as I see it. Look at the evidence: Exhibit A: Heartland Institute. Major skeptical organization, has received funding from the Fossil Fuel industry over the years-particularly Exxon. Exhibit B: George C Marshall Institute. Major skeptical organization which receives money from Exxon, amongst others, & has a former Exxon lobbyist, William O'Keefe, as its CEO. Exhibit C: Global Climate Coalition. Another Skeptic Organization-now defunct-had members from a number of large oil & automobile companies, as well as a lobbyist for Exxon. It also received considerable funding from the Oil industry in particular. Exhibit D: The Lavoisier Group. Key members are current or former members of Western Mining Corporation, Alcoa & other coal/mineral companies. Exhibit E: major skeptics, such as Ian Plimer, William Kininmonth & Garth Paltridge are all members of the group named in Exhibit D. So we see that, though not the source of *all* skepticism, the oil, coal & aluminium industries are definitely deeply involved in the skeptic "movement"-mostly because action against climate change will go against their short term interests. This isn't a straw man, its just THE FACTS! -
Riccardo at 21:07 PM on 7 April 2010Are we too stupid?
And that's a huge problem, the short temporal horizon. We kind of look at next quarter or next year. This fits well in the framework of the tragedy of the commons, immediate individual benefit but in the long run we all lose. Pious wishes or looking far? Or both. -
embb at 19:13 PM on 7 April 2010Are we too stupid?
Marcus, you are kidding yourself, as many AGW people do, if you think that the skepticism is coming from the Big oil. that is a convenient straw-man but not very useful if you want to have a real discussion. Concerning the "tragedy of the commons" I think we have a situation where the benefits of "cheating" are high and immediate while the benefits of playing by the rules are a sort of "promised land" in a 100 years. No wonder no one has found a solution to this, except for pious wishes. -
bvangerven at 18:14 PM on 7 April 2010Are we too stupid?
#9 Glenn Tamblyn: I’m afraid you’re all too right. By the way: Can anyone provide me with the scientific background as to why the world population would ever level out at about 9 to 10 billion (other than by mass starvation)? It seems to me – but I am uninformed – that population growth is mainly regulated by the amount of food (or more generally: resources) available. Which also means that any increase in crop produce will not end world hunger, it will just cause the world population to grow some more. -
Marcus at 16:38 PM on 7 April 2010Are we too stupid?
GC. if we go nuclear you will *still* raise CO2 emissions. After all, its not like you can just pull uranium out of the ground & chuck it in a reactor-it requires significant amounts of downstream & upstream processing-which in turn requires energy investment (usually from fossil fuel sources). Also, as we have only 100 years worth of economically viable uranium at current levels of use, a major expansion of nuclear power use could see all the readily available uranium consumed before the middle of this century-& the rest depleted by the end of the century. We'll also have mountains of nuclear waste which most countries *still* don't know what to do with. On the other hand, most households & businesses waste as much as 30%-50% of their energy through inefficiency. Removing these inefficiencies is the low-hanging fruit in both reducing CO2 emissions & postponing the need for expensive new power stations. Industry, too, often wastes energy in the form of thermal pollution. If they captured it & fed the resulting electricity into the grid, then it would displace electricity generated directly from non-renewable sources. Decentralization of our electricity grids could also reduce electricity waste by 10%-15% through the removal of transmission & distribution losses. Also, given that many of the smaller power stations are usually run on "renewable" sources (micro-hydro, co-generation, landfill gas, Solar & Wind), they also will be a good way of directly reducing both CO2 emissions & the generation of other dangerous waste by-products. Of course, its to be hoped that smaller power stations can be better tailored to local demand, instead of running at nearly full capacity 24/7, as most coal & nuclear power stations have to. On our roads, we can significantly reduce CO2 emissions by mandating higher fuel efficiency standards, passing laws to increase car-pooling & public transport use during peak times & by shifting long-distance freight onto rail instead of road. Improving traffic management could also significantly reduce CO2 emissions from unnecessary idling of vehicles-as could a switch to a greater number of hybrid & full electric vehicles. So you see, GC, that many opportunities exist for significant reductions in CO2-opportunities which will provide numerous economic, social & environmental side-benefits & which do not require a switch to nuclear power. "Unfortunately" taking these measures will hurt the profit margins of Big Coal & Big Oil, which is why they're so desperate to cast doubt on climate change-by any means necessary. Whether you accept it or not, all you're doing here is parroting their claims. -
Marcus at 16:24 PM on 7 April 2010Are we too stupid?
GC, CO2 is only a *lagging* factor when climate is being driven *naturally*-how many times do you need this explained to you? Also, this has really only been the case in the Quaternary Era, when we've lived in a relatively CO2 constrained environment. Prior to the Quaternary, CO2 levels were roughly 10 times higher than today, & temperatures were about 6 degrees warmer than at any point in the last 7.2 million years-even though the sun was 10% cooler. Thus it is abundantly clear that CO2 was the primary driver of the pre-Quaternary climate. In the last 50 years, CO2 & temperature have risen in close correlation-& these temperature changes have bucked the trend one would expect given the actions of the other major drivers of climate (Total Solar Insolation & Volcanic Activity). Even the PDO has been on a downward trend the last 30 years, whilst global temperatures have been rising-at the fastest rates in at least the last 8,000 years. That you refuse to accept these facts, & instead keep repeating fossil fuel industry propaganda, highlights that you're all too willing to "carry water" for big business-in spite of your protestations of innocence. Seriously, if you've got nothing useful to add, it makes me wonder why you even bother coming here?! -
Philippe Chantreau at 16:01 PM on 7 April 2010A residential lifetime
The main problem with this is quantitative. I'm not sure it makes any quantitative sense. It took millions of years of natural processes to store all the CH we are now burning. How many years of these processes do we roll back in just 1 year of coal/oil burning? How much vegetation is necessary to store 1 year's worth of emissions? How much land does that require? How can all that vegetation been prevented from releasing its carbon? I don't think that any idea like that is viable if not accompanied by emissions reduction. -
Philippe Chantreau at 15:42 PM on 7 April 2010Are we too stupid?
GC, the reason why you are taking some heat here is because you stoop down to the level of stupid right wing talking points as seen or heard on some radio and TV talk shows. You have given indication that you know better. You cite L&C but you ignore the fact that it was rebutted in the litterature. It's a cheap rethorical shot to point to who the rebuttal's author is and say "well of course he wouldn't say anything else." It so happens that he's saying in the litterature, where L&C were published in the first place. It means that there is objective validity to the rebuttal. In that sense, there is not that much wiggle room where we can "disagree" on what the science tells us. Science is a powerful thing because it enables us to establish what is not a matter of opinion. This: "The trouble with Alarmists is that they swallow all sorts of nonsense if it agrees with their beliefs. Yet their critical faculties are razor sharp when reviewing papers that challenge their beliefs." How are you immune to the same effect? Is ignoring the L&C published rebuttal an indication that you, or other skeptics, do better? Were you equally critical of L&C than of, say, a Mann paper? Why was there no "skeptic" to point out, in the litterature, the shortcomings of McLean & al? Was there any "skeptic" to challenge the ridiculous Soon&Baliunas piece? No there wasn't, even though it was so egregious that the all editorial board resigned. So, how skeptical really are the skeptics? How skeptical was the crowd at WUWT during the carbonic snow incident? Should we engage in that exercise that consists of reviewing how few papers agree with the "skeptics"' beliefs? Ah, but it has already been done by Oreskes. Skeptics regularly cite "papers" published in E&E. That publication has an openly acknowledged goal of providing a voice only for one kind of opinion, and an all but lacking review process. Would you take seriously a paper published in a similar publication (open bias, no real review) professing for the "opposite side"? -"We won't be able to ask the IPCC to return our money!" What is that about? Who's talking about paying money to the IPCC for emissions reduction? This is the kind of talk-show type strawman that should have no place in any of your arguments. Let's put things in perspective: can homeowners whose house lost 40% of its value ask for their money back from Wall Street? If social security goes down the drain before I retire, can I have for my money back? Please... - "When temperatures are rising, CO2 gets released into the atmosphere ~600 years later, nudging temperatures higher still. Yikes, positive feedback!" Yep, that's what the science says. Do you have any scientific analysis offering a convincing alternate argument? Is there a scientifically credible way for the low orbital forcing to generate the temperature variations seen in the paleo record? If not, then what is that yikes about? Not everything is a matter of opinion or perception. If you bang your head against a wall, it will damage your skin, bone and eventually brain tissues. There is no alternate view on that. It will. You may silence the indication of the damage (pain) with chemicals, but the damage will happen. -
Doug Bostrom at 15:17 PM on 7 April 2010Are we too stupid?
GC, may I remind you that while you do not own private enterprise, you and the rest of us own our respective governments? The two do not equate, this is easily apparent when one compares the transparency of, for instance, NASA versus that of Boeing. Benefit to the public is the central mission of our government, or at least for most of us able to read and participate on this site. The public good is the business of government. Private enterprise is a different animal, operating under different rules and with entirely different objectives, not in opposition to our needs but divorced from them. Most notably, the notion of public good is absent from the operational constraints of most private enterprise and indeed is often at cross purposes with the stated mission of such entities. The benefit they yield us is entirely incidental. Alienating ourselves from our own governments by confusing them with private enterprise is not a good way to achieve our objective of government that is responsive to our needs. Rather, we must embrace our governments closely if we wish them to faithfully follow us. -
gallopingcamel at 14:19 PM on 7 April 2010Are we too stupid?
Marcus (#42), Please don't think that I would carry water for big business. I don't like being pushed around by big business or big government. Nevertheless, roads would not get built without governments or businesses, so we have to tolerate them while resisting their efforts to ride rough shod over us. Now we are now back to the "Prisoner's Dilemma". How do you work with others to minimise the punishments that the establishment will exact? -
gallopingcamel at 14:05 PM on 7 April 2010Are we too stupid?
Marcus (#35), You mention CO2 "lagging". I think that fact alone destroys the idea that CO2 provides dominant forcing for global temperatures. When temperatures are rising, CO2 gets released into the atmosphere ~600 years later, nudging temperatures higher still. Yikes, positive feedback! I have no objection to spending trillions to do something useful, such as boosting food and timber production. What makes no sense is spending trillions to do something that later turns out to be ineffective. We won't be able to ask the IPCC to return our money! As you point out, CO2 emissions can be reduced without spending extra dollars. For example, we will continue to build electric power stations regardless of the "Climate Wars". If we choose coal or natural gas the emissions will go up. If we build nukes they won't. Naturally, I am for nukes but not today's dangerous and expensive LWRs. James Lovelock and James Hansen are right on the nuclear power issue although I don't agree with Lovelock's tolerance for higher levels of nuclear radiation. My training in "Radiation Safety" convinces me that we can expand nuclear electrical generation and reduce the inventory of high level nuclear waste at the same time. -
Marcus at 13:39 PM on 7 April 2010Are we too stupid?
"In the spirit of co-operation, even if we disagree on what the science is telling us we can still agree that it makes sense to reduce CO2 emissions." There's the problem though-powerful vested interests have done their level best to ensure *no* co-operation on this issue-& have done their best to make it seem than reducing CO2 emissions makes no sense at all. They don't do it for the benefit of the First World or Developing World's economies-they do it because it will cut into *their* bottom line. By pushing the arguments you do-GC-you're actually advancing the agenda of the Fossil Fuel sector-to the detriment of *all* of us! -
Marcus at 13:33 PM on 7 April 2010Are we too stupid?
Sorry, GC, but criticism of Lindzen & Choi have come about as a result of direct observation. The entire premise of the Iris Effect is that increased warming will lead to an increase in the Iris Effect over the tropics which-in turn-will allow more heat to escape into the upper atmosphere. This model was found to be flawed because satellite observations showed that more energy was allowed in by an increase in the Iris Effect than was allowed out-thus resulting in an overall *positive* forcing. Funny, though, how skeptics are quick to point to papers which back their views even when said papers use methods they usually disparage-like climate modeling! -
Doug Bostrom at 13:06 PM on 7 April 2010Are we too stupid?
GC, would you care to name any "Alarmists"? -
gallopingcamel at 13:03 PM on 7 April 2010Are we too stupid?
chris (#36), The trouble with Alarmists is that they swallow all sorts of nonsense if it agrees with their beliefs. Yet their critical faculties are razor sharp when reviewing papers that challenge their beliefs. The scathing critiques of Lindzen & Choi have come from Kevin Trenberth and associates. If you still believe in "Hockey Sticks" the rebuttals may impress you but I suspect Lindzen will have the last laugh. We are starting to get argumentative here. In the spirit of co-operation, even if we disagree on what the science is telling us we can still agree that it makes sense to reduce CO2 emissions. Put another way, in spite of their differences, Russians and Americans fought against Fascism.
Prev 2441 2442 2443 2444 2445 2446 2447 2448 2449 2450 2451 2452 2453 2454 2455 2456 Next


