


 Arguments


Recent Comments
Prev 2499 2500 2501 2502 2503 2504 2505 2506 2507 2508 2509 2510 2511 2512 2513 2514 Next
Comments 125301 to 125350:
-
joelupchurch at 18:25 PM on 16 January 20102009 - 2nd hottest year on record while sun is coolest in a century
I'm a lukewarmer myself and agree that things are getting warmer, but when years start and end are arbitrary human artifacts. I've plotted monthly temperature anomalies on a 12 month moving average and the HADCRUT and UAH show several higher peaks in the last 10 years. Of course, when you consider the confidence intervals of the various temperature indexes, then the general conclusion would be that we haven't had significant warming or cooling since around 2002. Here is my graph: http://www.anupchurchchrestomathy.com/2010/01/comparing-giss-hadcru-and-uah.html Click on the graph to see it full size. I'll try to add the RSS data when I get some time. -
David Horton at 18:20 PM on 16 January 20102009 - 2nd hottest year on record while sun is coolest in a century
"They usually pay for this kind of propaganda, but you're giving it to them for free!" Are you sure about that Marcus? Something sure does smell in Denmark about "John P." On thread after thread we now find this pattern of some "newcomer" who manages to post first and within a very short time of an article going up. Although he has this amazing efficiency he has apparently never heard or read any climate change material before, and trots out the same tired old stuff as if we are hearing it for the first time. And what old rubbish it is - he uses "real data" he has "global cooling" after two weeks cold snap, oh, and of course, as a farmer, "wish it would warm up so I could consistently raise better crops, extend my growing season and have less fear of severe crop loss from sudden freezes in the spring and fall". I doubt he will come back to this thread, or indeed another one under the same name. But he has got everyone here treating him politely and seriously and answering his questions as if they were a genuine search for truth. Ask yourselves, for a moment, is it really credible that anyone, let alone a "farmer" could really in 2010, be so ignorant about the debates and the data and still manage to find this site and be the first to post? No, it's not, but he has managed to get denialist rubbish in place as the first post and waste everyone's time. Mission accomplished, paid or willing volunteer. -
Doug Bostrom at 17:35 PM on 16 January 2010Why does CO2 lag temperature?
thingadonta at 06:52 AM on 16 January, 2010 "No one is disputing the 'physics of c02' and greenhouse effect, the issue is one of relative effect; c02's physical effects are dwarfed by oceanic circulation changes on temperature intiated by solar variations and ocean current changes..." Could you explain that a little more fully? Is this heat energy you're speaking of, sequestered in the oceans for long periods of time, stored up, isolated somehow? How does that work, exactly? Or are you saying ocean actually add thermal energy to the planet, somehow converting kinetic energy into heat? Are we speaking of magnetohydrodymamics? Solar variations are not enough to drive the sort of thermal changes we see in the history of the planet, and meanwhile the energy has to come from somewhere. If it's not some kind of change in the amount heat retained from sunlight striking the planet, it must have some internal source, or it must have been stored by some means. You apparently do not think the temperature of Earth's surface has much to do with the atmosphere. Or do you? Your explanation does not seem complete. -
Doug Bostrom at 17:23 PM on 16 January 2010Skeptical Science now an iPhone app
Berényi Péter at 16:55 PM on 16 January, 2010 We've got decades of data, each decade brings more signals, more congruence. I'm not sure we disagree about anything, I'm pretty sure if we don't that I will not be able to change your perception. Cheers! -
HumanityRules at 17:08 PM on 16 January 2010Skeptical Science now an iPhone app
My understanding of Roger Pielke's position is that he doesn't deny the human impact on climate. Rather that his interest is in how humanity can mitigate the effects of climate change. He roghtly puts humanity at centre stage and asks what will people need given the changing circumstances. This will need an assessment of the impact at the local level given the non-homogeneity of the changes. This approach seems to differ from much of the rest of climate science in asking "what can humanity do for the good of our future" rather than just "look at the mess we cause". Personnally I don't see a huge problem with his work. -
Albatross at 17:07 PM on 16 January 20102009 - 2nd hottest year on record while sun is coolest in a century
Thanks Pico! -
Craig Allen at 16:59 PM on 16 January 20102009 - 2nd hottest year on record while sun is coolest in a century
The brocken link in Albatross' comment should be If It's That Warm, How Come It's So Damned Cold? -
Berényi Péter at 16:55 PM on 16 January 2010Skeptical Science now an iPhone app
Dough, the very concept of climate does not even make sense in a shorter than let's say three decades time scale. You can look at as many indicators as you want, it does not make a difference. -
Albatross at 16:09 PM on 16 January 20102009 - 2nd hottest year on record while sun is coolest in a century
JohnP, please read this: If It's That Warm, How Come It's So Damned Cold?, at http://www.columbia.edu/‾jeh1/mailings/2010/20100115_Temperature2009.pdf I hope that it will answer many of your questions and concerns-- it is written by a leading authority on global temperature data. Regarding crops, I hope that you are aware that heat stress lowers yields (especially for C3 plants). You (or your children) might also regret wishing for much warmer weather if you are still around 20 years or more from now. Count yourself incredibly lucky thus far. Marcus, I agree. Unless something drastic changes, January 2010 will have record high (for the satellite record) global temp. anomalies. November 2009 was also a record high for that month. -
Marcus at 16:01 PM on 16 January 20102009 - 2nd hottest year on record while sun is coolest in a century
Oh, & you should see the AMSU-A data for the troposphere at a distance of 4km up. 2010, so far, has been 0.3 to 0.6 degrees warmer than the same point at 2009. These temps are also a clear +0.7 degrees higher than the 20-year average (1979-2000). You see, no matter how often some people try & pull the wool over our eyes, the data tells the real story-which is one of ongoing warming! -
Marcus at 15:52 PM on 16 January 20102009 - 2nd hottest year on record while sun is coolest in a century
Also, John P, there are a lot of farmers here in Australia who are thoroughly sick & tired of watching their crops die in the ground due to more frequent heat waves & significant reductions in rainfall during the peak growing periods. I'd say that there are a hell of a lot more farmers who dread increasing warming than would welcome it. Still, I've got to love your persistence in flying the flag for the fossil fuel industry. They usually pay for this kind of propaganda, but you're giving it to them for free! -
Craig Allen at 14:57 PM on 16 January 20102009 - 2nd hottest year on record while sun is coolest in a century
John P: While it doesn't make sense to try to understand climate trends from a single station if you have available data for multiple stations for your region or state, there is non-the-less a discernable upward trend in that dataset (in spite of the substantial year to year variation). I used the R statistical package to analyse your data. It shows that there is an upward trend of .06ºC per decade and that that trend is statistically significant. If instead of the raw data, you use the Fairmont dataset with homegeneity adjustements then the trend is more apparent. I note that using all the available data, the Minnesota Climatology Working Group finds that across most of your state that everage temperature of 1997-2006 is 1 to 4ºF above the 1970-2000 average. They also find that over the last 25 years, water temperatures in Lake Superior have risen 4ºF While this may not seem like much to you, such changes are already great enough to have allowed pine beetles to proliferate and kill off vast areas of US and Canadian pine forests. -
Doug Bostrom at 14:03 PM on 16 January 2010Skeptical Science now an iPhone app
Berényi Péter at 10:44 AM on 16 January, 2010 "And climate prediction is more difficult to verify than weather prediction. It takes time. More than a lifetime..." Not really, unless one is trying to use a single type of measurement to do the verification. However, many measurements are available. When results from multiple independent climatic indicators are consistent with climate predictions, that's verification. If I predict a cold front, I can confirm my prediction by looking for wind, rain, a characteristic swing in barometric pressure as well as a temperature change. Observing some or all of these confirms my prediction to a greater or lesser extent. If I see only rain but no other weather effects, I might conclude that my prediction of a front was incorrect. If I see rain as well as a barometric pressure signature, I've done better with verification. If I see all of the diagnostics, I'm almost certainly correct in my prediction. The same deal applies to climate, but the signals are different. As it happens, we're seeing plenty of signals consistent with predictions of climate change. Temperature changes are actually becoming less important as a primary diagnostic of change, though of course the other changes we see won't happen without a change in temperature, just as we won't see all of the indicators of a cold front unless the front does indeed exist. -
Doug Bostrom at 13:51 PM on 16 January 20102009 - 2nd hottest year on record while sun is coolest in a century
"We all know the northern hemisphere has been the coldest in many years during early January." No, it's cold this year -where you live-. It's been cold in a lot of places, warm in others. Overall, the past year has been warmer. Your local mileage may vary. Here where I live, temperatures's running above average this month. Last month, it was below average. Global warming stopping and starting? No, weather. "I got this from a friend in Farmington MN (a suburb of the Twin Cities. His 120 record actually shows a negative slope and Cooling." But I thought doubters believe that temperature records are unreliable? His may be bad, right? You need to make a more persuasive and consistent argument if swaying opinions is your goal. -
From Peru at 13:18 PM on 16 January 20102009 - 2nd hottest year on record while sun is coolest in a century
John Cook: The Early XX Century Warming(+0,5ºC) peaked at about the same time than WWII(around 1940), then a slight cooling of about -0,1ºC followed until about 10 years when temperatures stayed nearly constant between 1955 and 1975. The Sun Activity instead continued to incrase until mid-1950s, when it began a slow decline. Remarcable is that temperatures peaked BEFORE Solar Activity (a whole solar 11-year cycle indeed!). This seem inconsistent with the hypothesis that the Sun is the main responsible of the Early 20th Century warming. This plus the REGIONAL nature of this warming event (the Arctic and North Temperate zone, while Tropics and Southern latitudes show a near-constant warming rate during the whole century) suggest to me that such warming WAS NOT NATURAL BUT ANTROPOGENIC, but not from Grenhouse Gases but from Aerosol forcing. Has anyone compared the Sulfate vs. Black Carbon emissions making timeseries-graphs like the one presented here? That will do a good to determine which forcing (Solar or Aerosols) had the greatest impact. -
Riccardo at 12:46 PM on 16 January 20102009 - 2nd hottest year on record while sun is coolest in a century
John P, while i might agree with you on many respects, i can not think of the problem of global climate as based on anyone's backyard. Probably other farmers further south are not so willing to have warmer climate. I don't know what happens in your neiborhood, I do not live in USA. But I can tell you that where i live (mediterranean area) we suffered a marked increase in temperature, reduction in precipitations and more heat waves in summer. Farmers here are struggling hard to cope with this new climate and for sure they're not willing to get a warmer one. So, think globally, the earth is one and we all (together!) need to find our way out of this unsustainable trend. -
From Peru at 12:38 PM on 16 January 2010Skeptical Science now an iPhone app
The Arctic Oscillation Index is at a record low. Could this pattern be a result of the extreme sea-ice melt of recent years? If so, could Climate Change increse the risk of BOTH extreme Heatwaves and extreme Cold Snaps? -
John P at 12:16 PM on 16 January 20102009 - 2nd hottest year on record while sun is coolest in a century
Sir Osis of Liver, True but 120 years of actual data and no warming make you wonder. I got this from a friend in Farmington MN (a suburb of the Twin Cities. His 120 record actually shows a negative slope and Cooling..... mhtml:{9CAB5588-3D14-48A7-9773-AF7ABC0BBA08}mid://00000737/!x-usc:http://data.giss.nasa.gov/cgi-bin/gistemp/gistemp_station.py?id=425726580010&data_set=1&num_neighbors=1 -
Sir Osis of Liver at 11:54 AM on 16 January 20102009 - 2nd hottest year on record while sun is coolest in a century
I live in Saskatchewan (north of North Dakota), and we have entered our second week of above zero Celsius weather. We're running somewhere around 12-15C above normal. It is however not unheard of to get this type of weather pattern (locally known as the Pineapple Express). It is exactly why extrapolating local conditions globally is completely foolhardy. -
John P at 11:18 AM on 16 January 20102009 - 2nd hottest year on record while sun is coolest in a century
Something smells in Denmark, to coin a phrase. We all know the northern hemisphere has been the coldest in many years during early January. The stories abound everywhere (I in S. MN. on the Iowa border have yet to see the temperature above freezing this year and spent most of the first two weeks below zero F). Now as us skeptics (realist) are gloating. It just so happens the people behind the curtain, come out and say we just had the warmest January day in recorded history during the frigid plunge? ( Some Global Temperature recording site UAH) Well excuse me, I wasn’t born yesterday. I would like to add, I found this site http://data.giss.nasa.gov/gistemp/station_data/ I typed in my local rural city and asked for raw data graphed since 1886 (real temp data I assume). Anyhow here is the result http://data.giss.nasa.gov/cgi-bin/gistemp/gistemp_station.py?id=425744400040&data_set=0&num_neighbors=1 Amazingly their is not any Hockey Stick My city is near as cold in 2009 as it has ever been in recorded History! No wonder I do not buy into the GW frenzy. I am a Farmer and would wish it would warm up so I could consistently raise better crops, extend my growing season and have less fear of severe crop loss from sudden freezes in the spring and fall…and it I really do have Global Cooling here in Rural MN………..John PS Why don’t some of you guys put in some pertinent cities and see if You also have Global cooling or at least zero warming over the last last 120 years Like I have…….John……… -
Berényi Péter at 10:44 AM on 16 January 2010Skeptical Science now an iPhone app
doug_bostrom at 07:23 AM on 13 January, 2010: "Weather is more difficult to predict than climate" And climate prediction is more difficult to verify than weather prediction. It takes time. More than a lifetime, in fact, so any claim goes. This peculiarity makes weather prediction more difficult and somewhat riskier indeed. -
thingadonta at 06:52 AM on 16 January 2010Why does CO2 lag temperature?
re#32, #33, #34 It is widely known within the scientific literature that the onset of ice ages from around 4+ million years ago was largely caused by oceanic circulation changes, particularly the closing of the Isthmus of Panama between N and S America. The increase in the Southern Ocean from the widening gap between Antartica and Australia is also believed to enhance cooling, becuase the development of a strong Southern Polar wind/ocean belt restricts transfer of cooler water to northern cimes. All of this has nothing to do with c02. A general rule of thumb is: restricted ocean circulation means cooler periods, enhanced ocean circulation means warmer periods. C02 lags follows these temerpature changes due to the strong relationship between ocean temperature and c02 solubility. Oceans dwarf the effects of c02 and greenhouse gases, and plate tectonics and oceanic circulation has nothing to do with c02 and the greenhouse effect. Much the same goes for the end of ice ages. Ice break up caused by orbital changes enhances oceanic circulation causing enhanced warming. This has nothing to do with C02. c02 is 1/10,000 parts per million by volume of the atmosphere (which is a statistic you wont read at green websites), and the relatively small effect of c02 greenhouse warming is dwarfed by oceanic circulation changes on earth temperature. To state simply that 'c02 did it' (ie largely causing the end of ice ages), is not only putting the cart before the horse, but also making the cart pull the horse up the mountain. No one is disputing the 'physics of c02' and greenhouse effect, the issue is one of relative effect; c02's physical effects are dwarfed by oceanic circulation changes on temperature intiated by solar variations and ocean current changes, and c02 follows these changes, it does not cause them. -
djb95054 at 06:35 AM on 16 January 2010It's cosmic rays
Possible error in this article... I try always to verify quotes from original sources in order to eliminate the possibility of misattribution. In this article, there is a quote referenced from a Max Planck article here: http://www.mps.mpg.de/dokumente/publikationen/solanki/r47.pdf (Krivova 2003). The quote is "between 1970 and 1985 the cosmic ray flux, although still behaving similarly to the temperature, in fact lags it and cannot be the cause of its rise. Thus changes in the cosmic ray flux cannot be responsible for more than 15% of the temperature increase". The above referenced .pdf file is a scan and is therefore not searchable for this quote. I have attempted to read the entire article (a daunting task for a non-scientist like myself) and cannot locate the referenced quote. A Google search finds only additional references to this .pdf and this article. Is the above quote actually in the referenced article? If so, I'm blind and didn't see it. If not, where does this quote come from?Response: The quote is on page 281 of that paper, beneath the graph I reference above. -
Riccardo at 04:59 AM on 16 January 2010Skeptical Science now an iPhone app
shawnhet, i just added the PDO index to a trend line. The PDO index was multiplied by 0.1. -
Mizimi at 04:12 AM on 16 January 2010Why does CO2 lag temperature?
Also not mentioned is the increase in WV caused by warming, which will have a greater effect than CO2 released by warming oceans. During a glacial period the atmosphere will be pretty dry - as warming proceeds via the Mkz cycle the tropics will warm substantially with subsequent increase in WV. Czaja & Marshall (2005) estimate that 90% of the heat moved polewards ( above 30 lat) is transported by the atmosphere - which also suggests that warming in a glacial period would be via the atmosphere as during such a period the ocean circulation would be restricted. Which would account for the 'lag' between temp and CO2 levels. -
shawnhet at 02:48 AM on 16 January 2010Skeptical Science now an iPhone app
Riccardo, I don't follow what you've done above. What weight have you given to PDO index values? Cheers, :) -
Riccardo at 22:49 PM on 15 January 2010It's cooling
Doug, just after having hit the submit button, i ended up in Trenberth's own words: "It relates to our ability to track energy flow through the climate system. We can do this very well from 1992 to 2003, when large warming occurred, but not from 2004 to 2008. The quote refers to our observation system which is inadequate to observe Earth's energy flows at the accuracy needed to understand small fluctuations in climate;" Take his words, much better than mine. -
Riccardo at 22:25 PM on 15 January 2010It's cooling
Doug Cannon, we get always back to the same point, short and long term. There's nothing wrong in the data, just not accurate enough to details the short term variability which we all would like to account for. The long term global warming is put aside and not questioned at all by Trenberth. Rememebr also that there's not just black or white, we know everything or we know nothing. Indeed, it's well known that part, the largest probably, of the short term variability can be explained by ENSO alone. This part is know, but it's not all; the remainder comes from other, smaller, contributions. -
Riccardo at 11:37 AM on 15 January 2010Skeptical Science now an iPhone app
shawnhet, oh well, it's then 0.6 °C over 60 years, a "mere" 0.1 °C/decade. But it's quite a rough estimate. Taking a closer look and following your theory, i could fit the PDO index plus a trend to the temperature data through '85-'90 with a slope of just 0.07 °C/decade; from then, the fit becomes quite flat. The residual then represents a sudden jump in the antrhopogenic contribution with a trend of 0.18 °C/decade, a factor of about 2.5. This is what the "PDO theory" gives. In a few words, i got the same trend but shifting the onset of the so called "modern era AGW" 10-15 years ahead. It was nice playing with the numbers, but can anyone enlighten me on the meaning of this result? ;) -
Doug Cannon at 11:34 AM on 15 January 2010It's cooling
Riccardo, "no overall energy balance has been altered" I totally agree. That's the point. Actually, one of my sources for Trenberth's position is last week's "Economist". Unless they have totally misinterpreted his comments he believes the data show an energy imbalance. Since we all know that can't be true, something is wrong with the data. I think a fair paraphrasing of all Trenberth's comments would be: We don't have the right data. Yet. But we'll find it. Then the data will demonstrate there is no imbalance. -
shawnhet at 10:25 AM on 15 January 2010Skeptical Science now an iPhone app
Riccardo, FYI the last shift to a cooling PDO regime took place circa 1945, the shift in 1977 was to a warming regime. Cheers, :) -
Riccardo at 10:18 AM on 15 January 2010It's cooling
Doug Cannon, the fact that we still cannot identify the details of how heat goes around in the climate system in the short term (four years is not that much) should not rise any alarm. Altough some phenomena show a (sort of) cyclic behaviour they all average out in the long run. For example, look here for the PDO. In the end, they could at best justify some "noise" in the trend; no overall energy balance has been altered and these "oscillation" can just move around the heat through the climate system. Indeed, this is what Trenberth refers to in the stolen email, look at the other things he said. -
Doug Cannon at 09:30 AM on 15 January 2010It's cooling
Riccardo Perhaps my reference to Latif implied I was focusing on a relationship between short term and long term variability. There may be one but that wasn't my intention. But trying to say too much in too few words may have caused confusion. I referred to the "past few years". Being more specific, the GRL data at issue is from 2005 up to 2009. When Trenberth said "...we can't account for the lack of warming at the moment and it is a travesty that we can't" he was referring to a similar period. He wasn't talking about a seasonal or yearly basis. He has subsequently made it clear that, his intent was to say that with todays technology we should be able to find the effect of the increased trapped heat, but we haven't yet been able to. (My reading of his meaning is that we will be able to, given all the effort being put on it.) I've not concluded that "we don't understand enough about the natural forcing elements" as you suggest. The point I was making is that Latif has made that conclusion; specifically about "internal decadal variability". He was talking about the North Atlantic in that particular case. In fact he is "lobbying" for a research program to be able to predict that variability. He wasn't referring to El Nino and neither was I. (I don't think you mean to say that we know enough about all the natural forcing elements except for short term phenomena like El Nino. But your comment seems to imply that.) So, to belabor the "arbitary mixing" a bit further: (a)the lack of warming that Latif suspects is due to natural forcing that we need to understand better and.. (b)Trenberth's frustration with our inability to find the warming that has to be there based on the absorbed/reflected radiation imbalance... are connected in a way. They relate to the same earth during the same period of time. It doesn't seem to arbitrary to wonder if the long term cycle in (a) is in a phase of it's cycle that affects the warming in (b). I shouldn't be so presumptious to think that I know the answer. I don't. But I reserve the right to wonder if understanding the decadal oscillations of the oceans and an improved ability to measure the heat content of the oceans would lead us to an answer. -
timbo1235 at 09:02 AM on 15 January 2010Skeptical Science now an iPhone app
Might have snow in the Aussie Alps this Sunday (my snowboard is itching). I'm waiting for an Andrew Bolt (check him out SS, he's a nutbag, writes for the Herald Sun) article claiming that coz it's snowing in Jan, GW/AGW is a sham! -
Riccardo at 08:49 AM on 15 January 2010Skeptical Science now an iPhone app
shawnhet, 0.4 °C between the last two PDO shifts (1977 and 1998) means roghly 0.2 °C/decade of anthropogeic warming. I bet many others will agree. -
johnmacmot at 08:09 AM on 15 January 2010Skeptical Science now an iPhone app
Chris, as a non-scientist, can I pass on my appreciation of your clear, informed posts on this site. Thanks to John Cook also for providing such a valuable resource among the slosh of irrational and ignorant nonsense around the net. -
shawnhet at 08:07 AM on 15 January 2010Skeptical Science now an iPhone app
Here is the Mann paper in question: Observed and simulated multidecadal variability in the Northern Hemisphere T. L. Delworth1 and M. E. Mann2 Abstract Analyses of proxy based reconstructions of surface temperatures during the past 330 years show the existence of a distinct oscillatory mode of variability with an approximate time scale of 70 years. This variability is also seen in instrumental records, although the oscillatory nature of the variability is difficult to assess due to the short length of the instrumental record. The spatial pattern of this variability is hemispheric or perhaps even global in scale, but with particular emphasis on the Atlantic region. Independent analyses of multicentury integrations of two versions of the GFDL coupled atmosphere-ocean model also show the existence of distinct multidecadal variability in the North Atlantic region which resembles the observed pattern. The model variability involves fluctuations in the intensity of the thermohaline circulation in the North Atlantic. It is our intent here to provide a direct comparison of the observed variability to that simulated in a coupled ocean-atmosphere model, making use of both existing instrumental analyses and newly available proxy based multi-century surface temperature estimates. The analyses demonstrate a substantial agreement between the simulated and observed patterns of multidecadal variability in sea surface temperature (SST) over the North Atlantic. There is much less agreement between the model and observations for sea level pressure. Seasonal analyses of the variability demonstrate that for both the model and observations SST appears to be the primary carrier of the multidecadal signal. http://www.springerlink.com/content/ght24jjem312qnh0/ Ned:"When I asked you for a physical justification of PDO as a "substantial forcing" of global climate, you said that Michael Mann's proxy studies show a "60 [] year cycle" that's "consistent with" the PDO." Well, frankly, the broad components of a physical mechanism isn't that hard to come by. PDO can affect ocean temps, precipitation, air pressure and (probably) cloudiness, and causes wide shifts in some biological markers as well. some combination of these factors could easily have climate effects. "Second, you're blurring the distinction between correlation and causation. Suggesting that the PDO is a "substantial forcing" wrt global climate is not the same as suggesting that it's "correlated with" (or "consistent with" as you wrote) global climate." I'm not sure what point you are trying to make here, but you asked for evidence that it was a substantial forcing and I pointed you in what was IMO the right direction. "Thirdly, PDO ain't ENSO. How many "sixty year cycles" have we been through since the start of the global mean temp record?" See Mann above. "With all due respect, as far as I can tell, your "skepticism" is purely unidirectional. When it comes to claims for the existence of anthropogenic climate change, you're exceptionally skeptical. When it comes to claims that might question the existence of anthropogenic climate change, the skepticism all disappears. A true skeptic wouldn't promote the idea that a mysterious and poorly understood "PDO" is a substantial forcing of climate without strong evidence e.g. a clear physical basis or very strong empirical analysis." It seems to me that someone who was a skeptic would look at the good correlation btw PDO and climate and say that there is a pretty good chance that whatever causes changes in the PDO index can also cause changes climate. He would not hand wave about it being mysterious or poorly understood, he would go about seeing what he can predict about climate using that idea. For the record, I have no disagreement with anthro warming effects, my disagreement is with the proposed magnitude of the anthro effect. On John Cook's PDO correlation page, he states that when the PDO last shifted towards cold as it seems to now, temps were 0.4C cooler. I don't have an issue with ascribing that entire 0.4C to anthro causes. Cheers, :) -
chris at 06:13 AM on 15 January 2010Skeptical Science now an iPhone app
I think you're misunderstanding or misinterpreting Mann’s work shawnhet. Let’s look at the question of the role of natural (ocean) “oscillations” to long term surface temperature trends from the point of view of Mann’s studies (focussing on relevant work from the last few years, since this is more likely to represent current scientific knowledge and Mann’s current views). I’d say the following points are supported by the scientific evidence; they’re all from Mann’s recent analyses. 1. There’s no doubt that historical measures/proxies of ocean indices (Nino/ENSO; PDO, NAO etc), shows that these indices undergo fluctuations that are associated at the first level with local changes in sea surface temperature (SST) (and at secondary levels with various local effects experienced on inhabited land surfaces, like temperature variations, rainfall and drought levels etc.). 2. Mann has published many examples of these. The general conclusions might be summarized as: a. These indices show variability but are neither periodic in the manner that might be meant by the term “oscillation” [see (b.)], nor do they contribute to long term temperature trends. Thus in Mann and Emanuel (2006) and Sabatelli and Mann (2007), measured and proxy values of El Nino and NAO indices expending back into the 19th century are presented and discussed. These don’t show any regular variation or trend; they’re fluctuations around a mean value. Might they contribute to long term temperature trends in the manner that you and Pielke suggest? Mann doesn’t think so [Mann and Emanuel (2006)]:“In short, there is no evidence that a natural climate oscillation contributes to long-term tropical North Atlantic SST variations.”
b. What is the origin of ocean fluctuations? Might they be internal elements of the climate system that can periodically “pump up” (and cool down) the surface temperature in the manner you suggest? Or might they be responses to variations in external forcings? Mann’s analyses supports the latter interpretation. In his recent review of climate over the last 2000 years (Mann, 2007), he ascribes long term fluctuations in various ocean indices as the response to external forcings:“ The substantial cooling in large parts of Europe at the height of the conventionally defined European LIA during the late seventeenth and early eighteenth century appear to be related in large part to long-term variations in the NAO, discussed above, which in turn appear to have been associated (Figure 8) with a large-scale dynamical response of the climate system to natural radiative forcing by explosive volcanic activity (Shindell et al. 2003, 2004) and solar output (Shindell et al. 2001, 2003).”
Likewise Mann ascribes variations in ENSO as a response to variations in external (volcanic/solar) forcing. In other words (according to Mann), changes in ocean fluctuations (that some seem to want to ascribe as internal “oscillations” of the climate system), likely aren’t internal oscillations at all, but responses to external forcing. c. Are changes in local SST as measured by various ocean “indices”, indications of global scale temperature variations? Mann doesn’t think so. In his recent review (Mann, 2007), he presents evidence, for example, that during the MWP and LIA, the warming (MWP) and cooling (LIA) in the high N latitudes, were associated with cooling (MWP) and warming (LIA) in the tropical Pacific:“The conclusion that the tropical Pacific appears to have been in a cold La Niña–like state during the MWP and a warm El Niño–like state during the LIA implies that surface temperature changes in the tropical Pacific may have offset extratropical temperature changes (where these periods were relatively warm and cold respectively), reducing the amplitude of global or hemispheric-mean temperature changes from what would be deduced based on extratropical proxy data alone.”
In summary, Mann’s published analyses support the conclusions that: (i) Ocean SST fluctuations as indicated by various ocean “indices” don’t contribute to long term temperature trends in the manner you and Pielke suggest. (ii) Rather than being internal “oscillations” of the climate system that have significant “oscillatory” contributions to global surface temperature trends, local short and long term ocean fluctuations are likely largely a response to external forcing (solar, volcanic, and no doubt to anthropogenic greenhouse and aerosol forcing). (iii) When considered on a global scale local ocean fluctuations tend to cancel (as one might expect from the redistribution of ocean heat either due to internal or forced effects), and so these indices don’t indicate much of a contribution to global scale temperature trends. This is all pretty much consistent with the work by Tsonis, Swanson, Latif and Keenleyside cited in papers in my post above (see post #16), that ocean variations (in heat distribution) might modulate the surface temperature, but on the long (multidecadal scale) relevant to predicting the effects of massive enhancement of greenhouse gas concentrations on global surface temperature, these average to something close to zero, and thus (as Mann states explicitly) don’t have much of an effect on the temperature trend arising from an external forcing (like massive enhancement of greenhouse gas concentrations). M. E. Mann and K. A. Emanuel (2006) Atlantic Hurricane Trends Linked to Climate Change EOS 87, doi:10.1029/2006EO240001 M. E. Mann (2007) Climate Over the Past Two Millennia Annual Review of Earth and Planetary Sciences 35: 111-136 Sabbatelli TA and Mann ME (2007) The influence of climate state variables on Atlantic Tropical Cyclone occurrence rates J. Geophys. Res. 112, art #D17114 -
NewYorkJ at 04:43 AM on 15 January 2010Skeptical Science now an iPhone app
"Well, you could look up the papers of that rabid anti-warmer Michael Mann whose tree-ring proxy studies have found a 60 or year cycle in temps consistent with the PDO ;)" You might want to run by your hypothesis by Dr. Mann, rather than assuming your interpretation of his work is correct. "IAC, as I have said, pretty good evidence is plotting the correlation of temps vs. PDO." Science is not based on finding correlations. There's a correlation between the Dow Jones and global mean temperature as well. Global warming causation solved! "You may want to pay particular attention to the inflection points where a period with a rising temperature trend shifts to a falling one and vice versa." PDO positive phases are associated with somewhat more and stronger el Ninos, and negative phases with somewhat more and stronger la Ninas and less el Ninos. So affect on the short-term trend (few years of transition between each phase) might be observed. RealClimate has a nice post on the topic that takes apart Roy Spencer's attempt to assign a more significant portion of warming to natural cycles. http://www.realclimate.org/index.php/archives/2008/05/how-to-cook-a-graph-in-three-easy-lessons/ -
Ned at 04:43 AM on 15 January 2010Skeptical Science now an iPhone app
Shawnhet, you wrote "I think that you'd find that giving the PDO index a substantial forcing value will improve the fit quite a bit btw forcing and temp." When I asked you for a physical justification of PDO as a "substantial forcing" of global climate, you said that Michael Mann's proxy studies show a "60 [] year cycle" that's "consistent with" the PDO. That's not very helpful, IMHO. First, I strongly doubt that Mann would agree with your characterization that PDO is a "substantial forcing". Second, you're blurring the distinction between correlation and causation. Suggesting that the PDO is a "substantial forcing" wrt global climate is not the same as suggesting that it's "correlated with" (or "consistent with" as you wrote) global climate. Thirdly, PDO ain't ENSO. How many "sixty year cycles" have we been through since the start of the global mean temp record? With all due respect, as far as I can tell, your "skepticism" is purely unidirectional. When it comes to claims for the existence of anthropogenic climate change, you're exceptionally skeptical. When it comes to claims that might question the existence of anthropogenic climate change, the skepticism all disappears. A true skeptic wouldn't promote the idea that a mysterious and poorly understood "PDO" is a substantial forcing of climate without strong evidence e.g. a clear physical basis or very strong empirical analysis. -
Riccardo at 04:32 AM on 15 January 2010It's cooling
Doug Cannon, in your comment i found two different concepts mixed arbitrarly, short versus long term variability. If, with Tremberth, we can't say where the heat has gone on a sesonal or yearly basis, the same does not apply to longer periods. You are not allowed to do this extrapolation. Even worst, you cannot conclude that "we don't understand enough about the natural forcing elements." unless by "enough" you mean, for example, the timing of next El Nino and its strength or the like. Skepticism is definitely healthy and is at the very core of the progresses of science; misinterprenting or disregarding what is known is not. -
shawnhet at 03:36 AM on 15 January 2010Skeptical Science now an iPhone app
Ned:Is there any physical basis for this? Do you have citations to any papers discussing why "PDO" should represent a large forcing on global climate Well, you could look up the papers of that rabid anti-warmer Michael Mann whose tree-ring proxy studies have found a 60 or year cycle in temps consistent with the PDO ;) "PDO isn't really an "oscillation", it's just a numerical index that flips back and forth at irregular intervals and that doesn't seem to have a strong physical manifestation (compared to, say, ENSO). If we're going to posit that it plays an important role in modulating global climate, I for one would like to see some convincing evidence." ??? It flips back and forth, but isn't an oscillation? IAC, as I have said, pretty good evidence is plotting the correlation of temps vs. PDO. You may want to pay particular attention to the inflection points where a period with a rising temperature trend shifts to a falling one and vice versa. Ray Ladbury, meet the physics of turbulent systems, you two haven't met at all. Cheers, :) -
Doug Cannon at 02:10 AM on 15 January 2010It's cooling
"How do we find out what's happened from 2003 until now? Unfortunately, there is no time series (that I know of) of the planet's total heat content up to present time." Information from Sydney Levitus, Geophysical Research Letters, 2009 shows that for past few years the heat content of the oceans has not been rising (rising sea level in that period can be accounted for by runoff; not temperature.) This is what Trenberth and Latif have been referring to. Basically the books don't balance. I appreciate that not everyone places a high faith in satellite measurements, but they all say that the earth has been absorbing more energy during that time. If so, it has to show up somewhere and the mystery is that it hasn't. Latif seems to think it's in the oceans. Probably more sensible than any other alternative. But he acknowledges that we don't understand enough about the natural forcing elements. To me this also raises serious doubts that we really can get a true average measurement of ocean heat content. To those of us who believe that scientific skepticism is healthy, it would seem to be a mistake to conclude that we know the earths total heat content is still rising without looking for alternative answers to the mystery.Response: Levitus' data covers only the upper ocean heat which shows more variability than the total ocean heat. Measurements of ocean heat down to 2000 metres deep show that the oceans are still accumulating heat. -
Ned at 13:09 PM on 14 January 2010Skeptical Science now an iPhone app
shawnhet writes: "I think that you'd find that giving the PDO index a substantial forcing value will improve the fit quite a bit btw forcing and temp." Is there any physical basis for this? Do you have citations to any papers discussing why "PDO" should represent a large forcing on global climate? IMHO it's not uncommon for people who don't want to accept the idea of anthropogenic climate change to fall back on rather vague and unscientific suggestions about "oscillations" (be they PDO, AMO, or AO). PDO isn't really an "oscillation", it's just a numerical index that flips back and forth at irregular intervals and that doesn't seem to have a strong physical manifestation (compared to, say, ENSO). If we're going to posit that it plays an important role in modulating global climate, I for one would like to see some convincing evidence. -
Riccardo at 10:28 AM on 14 January 2010Why does CO2 lag temperature?
I could not find anywhere in the post the claim that CO2 in the *only* feedback ... probably thingadonta missed the title of this post. -
yocta at 10:13 AM on 14 January 2010Why does CO2 lag temperature?
RE$ thingadonta Care to back it up with the actual papers that support your hypothesis? -
David Horton at 09:54 AM on 14 January 2010Why does CO2 lag temperature?
"the usual 'insertion' of greenhouse gas forcings favoured by some academics", and, um, favoured by physics. -
thingadonta at 09:36 AM on 14 January 2010Why does CO2 lag temperature?
"•Deglaciation is not initiated by CO2 but by orbital cycles •CO2 amplifies the warming which cannot be explained by orbital cycles alone •CO2 spreads warming throughout the planet". Inconvenient fact No. 1, not mentioned. On any normal day which warms after a cool night/period, cloud cover decreases, which amplifies the warming substantially. None of the papers you refer to mention this simple fact. If the earth warms, cloud cover, especially in temperate zones, decreases. There are numerous papers on this subject. It's therefore not all c02 amplifying and spreading the warming after ice ages. Inconvenient fact No.2, not mentioned. When ice cover decreases after an ice age, the amount of reflected sunlight substantially decreases; this happens in a relatively short time once the ice cover thins from widespread but thin cover over Eurasia and North America early in the warming trend, to vast areas which rapidly thin to next to nothing, causing a tipping point reduction in reflected sunlight over large areas, further reduced cloud cover and amplifying the warming trend. Inconvenient Fact No.3, not mentioned. Oceans take many centuries/thousands of years to warm after an ice age. Once ocean current patterns begin to change, also associated with ice break ups, the redistribution of heat leads to relatively rapid earth warming. Such factors as above can account for amplifying warming at the end of the ice age without the usual 'insertion' of greenhouse gas forcings favoured by some academics. C02 and other greenhouse gases are not the only driver of warming after an ice age as you fail to mention; apart from orbital changes, other natural earth factors than a small rise in greenhouse gases substanitally amplify the warming. -
Jesús Rosino at 08:57 AM on 14 January 2010Models are unreliable
By the way, have you read this RC post?: http://www.realclimate.org/index.php/archives/2009/12/updates-to-model-data-comparisons/ It seems that Hansen's 1988 model is indeed (slightly) overestimating the observed warming trend: "the old GISS model had a climate sensitivity that was a little higher (4.2ºC for a doubling of CO2) than the current best estimate (~3ºC) [...] it seems that the Hansen et al ‘B’ projection is likely running a little warm compared to the real world". Hansen's model shows 0.26 +/-0.05 ºC/dec, whereas the real world shows 0.19 +/-0.05 ºC/dec. However, for this comparison, as well as the climate sensitivity, it must be taken into account that "Scenario B in that paper is running a little high compared with the actual forcings growth (by about 10%)". AR4 models give 0.21 +/-0.16 ºC/dec. Anyway, this was already highlighted by Hansen et al 2006: "Close agreement of observed temperature change with simulations for the most realistic climate forcing (scenario B) is accidental, given the large unforced variability in both model and real world. Indeed, moderate overestimate of global warming is likely because the sensitivity of the model used (12), 4.2°C for doubled CO2, is larger than our current estimate for actual climate sensitivity, which is 3+/-1°C for doubledCO2, based mainly on paleoclimate data" -
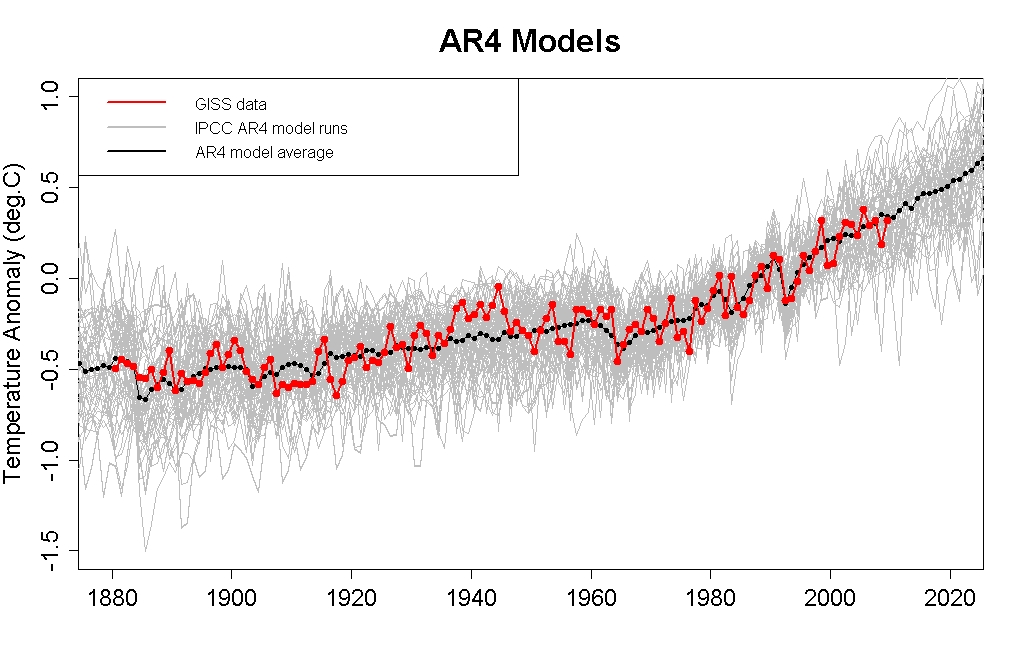
Jesús Rosino at 08:34 AM on 14 January 2010Models are unreliable
A bit nitpicking on my side, John, but in the "Further reading" section you say "Tamino compares IPCC AR4 model results[...] versus observations", wherheas the picture is his Fig. 3: "compare the GISS data to the models listed in IPCC AR4 chapter 8 except for the CCCMA models". The one that reflects all the IPCC models is his Fig. 1. Both graphs are very similar, indeed. Cheers!Response: Thanks for the feedback, I've updated the wording to reflect this.
Prev 2499 2500 2501 2502 2503 2504 2505 2506 2507 2508 2509 2510 2511 2512 2513 2514 Next


