


 Arguments


Recent Comments
Prev 2560 2561 2562 2563 2564 2565 2566 2567 2568 2569 2570 2571 2572 2573 2574 2575 Next
Comments 128351 to 128400:
-
Quietman at 11:31 AM on 13 May 2009It's the sun
ps Ice cores have already proven that CO2 follows temps, not the other way around. This means that regardless of how much CO2 there was, it is irrelevant. It was NOT the cause and only confirms that CO2 increases with increased temperatures some time afterward, that's all. -
Quietman at 11:27 AM on 13 May 2009It's the sun
Patrick by "blowing smoke" I mean bad science procedures. They assume AGW and try to make the past fit the hypothesis rather than study of the period and let the science speak for itself WITHOUT ASSUMPTIONS. -
Quietman at 11:24 AM on 13 May 2009It's the sun
had to lasting s/b had no lasting -
Quietman at 11:23 AM on 13 May 2009It's the sun
Chris The PETM is a spike of zero duration in geologic time. It represents an event that caused a heat peak but not a continued warming as it immediately cooled. The cause of this spike is unknown and as it had to lasting effect is irrelevant. The later climb represents changes in ocean currents in direct response to the Med being cut off from the Pacific. -
Quietman at 11:15 AM on 13 May 2009It's the sun
Patrick It would be interesting if true, however they are blowing smoke. -
Quietman at 11:13 AM on 13 May 2009It's the sun
"The geothermal flux is just too small (around 0.1 W/m2 compared to the greenhouse-augmented solar flux absorbed by the Earth’s surface of over 150 W/m2). " Yes and the continents are fixed. This is an old story that isn't true. It is not a constant but a variable. -
Quietman at 11:08 AM on 13 May 2009Volcanoes emit more CO2 than humans
ginckgo "The term thermohaline circulation (THC) refers to the part of the large-scale ocean circulation that is driven by global density gradients created by surface heat and freshwater fluxes." This is the wiki definition. It's incomplete, but close. What part do you not understand? -
David Horton at 10:50 AM on 13 May 2009A broader view of sea level rise
Ron Cram "The mid-19th century was during the pre-industrial period" is simply not true. The industrial revolution got under way in the middle of the eighteenth century (and arguably could even be traced back to about 1700) and was in full swing by the mid nineteenth. There was then a "second industrial revolution' from about 1880 to 1914 as the technological developments of the first part of the industrial revolution allowed the start of all kinds of new industries. So if you want to look at human contributions to global warming you need to look a long way back. And then observe the acceleration of industrial production as time went by. -
Quietman at 10:49 AM on 13 May 2009It's the ocean
[In 2005 James Hansen, Josh Willis, and Gavin Schmidt of NASA coauthored a significant article (in collaboration with twelve other scientists), on the “Earth’s Energy Imbalance: Confirmation and Implications” (Science, 3 June 2005, 1431-35). This paper affirmed the critical role of ocean heat as a robust metric for AGW. “Confirmation of the planetary energy imbalance,” they maintained, “can be obtained by measuring the heat content of the ocean, which must be the principal reservoir for excess energy” (1432). ... In 2007 Roger Pielke, Sr. suggested that ocean heat should be used not just to monitor the energy imbalance in the climate system, but as a “litmus test” for falsifying the IPCC’s AGW hypothesis (Pielke, “A Litmus Test…”, climatesci.org, April 4, 2007). Dr. Pielke is a Senior Research Scientist in CIRES (Cooperative Institute for Research in Environmental Sciences), at the University of Colorado in Boulder, and Professor Emeritus of the Department of Atmospheric Science, Colorado State University, Fort Collins. One of the world’s foremost atmospheric scientists, he has published nearly 350 papers in peer-reviewed journals, 50 chapters in books, and co-edited 9 books.] The Global Warming Hypothesis and Ocean Heat I think that this was an excellent point. -
Quietman at 10:45 AM on 13 May 2009Climate's changed before
ps Volcanos actually causing ENSO is far fetched and yes a bit silly. It's what happens on the ocean floor near the subduction zone where the driver for ENSO resides. -
Quietman at 10:41 AM on 13 May 2009Climate's changed before
ginckgo Sorry, that was posted for Patrick who was up to speed on vulcanism. The Volcanos thread has the argument presented with links to recent articles explaining the background. I am missing one reference about ENSO and I can't find it again to post a link. When I do it will also be posted in the Volcano thread. John wants us to keep the subject relevance when we can. From your statement I think you have some reading to catch up on. :) -
Quietman at 10:33 AM on 13 May 2009Arctic sea ice melt - natural or man-made?
Patrick Considering that was a pro-AGW article in the "call for actions" for the greens columns, you don't seem very receptive. -
chris at 07:53 AM on 13 May 2009A broader view of sea level rise
re #9 1. solar irradiance. Ron you are mistaking the longish term trend in solar irradiance (which shows no net warming contribution at least since the mid 20th century and a small cooling contribution during the last couple of decades [*]), and the contribution from the solar cycle. Several analyses indicate that the peak to minimum solar cycle contributes of the order of 0.1 oC of cooling to the Earth's surface temperature (e.g. [**]). In a world warming under a greenhouse-induced radiative imbalance, at around 0.15 oC per decade, we expect the solar cycle cooling to "overpower" the greenhouse induced warming during the downturn (cooling) part of the cycle. Of course in the real world the solar cycle contribution is difficult to pull out since stochastic variation in the climate system (El Nino’s, volcanoes, cloud cover variation and such-like) generally masks the small solar cycle contribution in the surface temperature record. At present, since the solar minimum we’re currently in is somewhat prolonged we’re likely getting the full cooling “whack” from that. 2. steric (warming) contribution to sea level rise. You can’t take the minimum in an uncertainty range and base any conclusions on that whatsoever. After all one could use your “strategy” and state that the steric contribution to sea level rise is as much as 2.5 mm per year! Four years is an extremely short period of time in this context, and reduction in uncertainties requires longer analyses, certainly so if one is attempting to make fundamental, all-encompassing conclusions as you are. 3. As the recent papers I cited show, the evidence indicates there is a steric (warming) contribution to sea level rise during the last few years. That’s not necessarily incompatible with the Argo float data which shows a rather small steric contribution to sea level rise during this period. Perhaps some of the heat has penetrated somewhat more deeply into the oceans. Perhaps some of the Argo data is still flawed. This is a very new technology, and only 18 months ago it was shown that a problem with the Argo data was fooling everyone into thinking that the oceans were cooling: http://earthobservatory.nasa.gov/IOTD/view.php?id=35805 http://earthobservatory.nasa.gov/Features/OceanCooling/ as you said in your post #1 in reference to sea level rise and heat content: “If data shows one going up and one going down, they may have an error in their data somewhere. Within certain margins of error, this data has to correlate”. Exactly so. However the recent papers (see my post #7) seem to have reconciled any dichotomy. Sea levels have risen during the period 2004-2008. Some of this is due to ocean warming (steric) and some (likely more) due to increased ocean mass (land ice melt). Just as one cannot pick arbitrary extrema in uncertainty ranges to try to make a point, nor can one arbitrarily make a personal selection of which of two opposing data sets are correct under circumstances where there is uncertainty. After all the (short!) history of the Argo floats would tend to indicate that it’s more likely that any error (if there is an error) lies there. And we should reemphasise that we are dealing with extremely short periods of analyses! 4. pre-industrial sea level rise The evidence indicates that sea levels didn’t rise significantly during the millennium before the mid/late 19th century (see paper [***] in post #7). The notion that sea level rise is due to recovery from the Little Ice Age doesn’t make much sense in the context of the sea level record. After all, if any cooling forcings pertaining to the LIA were removed, the sea level rise would occur initially with a rapid rate that would decrease as the “recovery” was approached. The record (see John Cross’s figure 1 above) shows the opposite. In any case the “recovery” from the LIA was pretty much complete by the early/mid 19th century: http://en.wikipedia.org/wiki/Little_Ice_Age http://en.wikipedia.org/wiki/File:Sunspot_Numbers.png You specifically suggested (your post #1) that sea levels should “rise at a rate much greater than the natural rates seen during the non-industrialized years”. The evidence indicates that is the case, at least as far as net sea level rises are concerned. There was no significant net change in sea level (as far as we can tell) during the millennium (at least) before the mid-19th century (see my post #7); sea levels rose very slowly from the late 19th century (see John Cook’s fig. 1 above), and the rate of increase has accelerated through the mid-late 20th century. And although the early release of CO2 from fossil fuel use (and land clearance) was smallish in the late 18th/early 19th century, it was quite significant (atmospheric CO2 levels rose from 277 – 286 ppm in the period from the late 18th to mid 19th century [***], and this should have produced a small warming (0.1 oC within a climate sensitivity of 3 oC per doubling of atmospheric CO2). So the initial rise in sea level could indeed “be attributed to anthropogenic CO2”. Maybe it wasn’t of course. But you are making strong assertions that are either contradicted by straightforward evidence, or are only compatible with the arbitrary selection of extrema in ranges of uncertainties. [*] Lockwood M and, Frohlich C (2008) Recent oppositely directed trends in solar climate forcings and the global mean surface air temperature. II. Different reconstructions of the total solar irradiance variation and dependence on response time scale Proc. Roy. Soc. A 464, 1367-1385. abstract: We have previously placed the solar contribution to recent global warming in context using observations and without recourse to climate models. It was shown that all solar forcings of climate have declined since 1987. The present paper extends that analysis to include the effects of the various time constants with which the Earth's climate system might react to solar forcing. The solar input waveform over the past 100 years is defined using observed and inferred galactic cosmic ray fluxes, valid for either a direct effect of cosmic rays on climate or an effect via their known correlation with total solar irradiance (TSI), or for a combination of the two. The implications, and the relative merits, of the various TSI composite data series are discussed and independent tests reveal that the PMOD composite used in our previous paper is the most realistic. Use of the ACRIM composite, which shows a rise in TSI over recent decades, is shown to be inconsistent with most published evidence for solar influences on pre-industrial climate. The conclusions of our previous paper, that solar forcing has declined over the past 20 years while surface air temperatures have continued to rise, are shown to apply for the full range of potential time constants for the climate response to the variations in the solar forcings. [**]J. L. Lean and D. H. Rind (2008) How natural and anthropogenic influences alter global and regional surface temperatures: 1889 to 2006 Geophys. Res. Lett. 35, L18701. This isn’t stated in the abstract, but the analysis indicates a solar cycle (max-min) surface temperature change of 0.11 oC with a one month lag. [***]D. M. Etheridge et al (1996) "Natural and anthropogenic changes in atmospheric CO2 over the last 1000 years from air in Antarctic ice and firn J. Geophys Res. 101, 4115 -4128.Response: It's a common mistake but my name is John Cook, not John Cross :-) -
Wondering Aloud at 06:49 AM on 13 May 2009Are sea levels rising?
Sorry John Thanks for the correction AIG? What the heck? simple typo. I do that a lot. I think the implication in AIT is that this is a likely near term consequence. I know you can find proponents trying to scare us with it being a near term thing. It is mighty hard for people to get frightened over something that might happen hundreds if not thousands of years in the future. Please expand on fractal sketicism. Explain, sounds like fun. -
Ron Cram at 04:50 AM on 13 May 2009A broader view of sea level rise
Chris, I can appreciate the quote in the L&W paper: "we find that the sum of steric sea level and the ocean mass component has a trend of 1.5 +/- 1.0 mm/a over the period, in agreement with the total sea level rise observed by either Jason-1 (2.4 +/- 1.1 mm/a) or Envisat (2.7 +/- 1.5 mm/a) within a 95% confidence interval." In other words, the steric rise could be as little as 0.5mm/a over a multiyear period and some portion of this is due to salinity changes. I don't see how this is any different than the finding by Josh Willis that there has been no increase in ocean heat content since 2003. If one understands the impact of "0.85 ± 0.15 watts per square meter" radiative impact spoken of by Hansen, you would expect a much greater than observed warming. If you have been following the debates on total solar irradiance, you will note that changes in solar irradiance are said to be trivial. The lack of ocean heating cannot be traced to solar minimum, at least not by AGW alarmists. Regarding sea level rise centuries ago, yes, you would expect sea level to rise as the planet is coming out of the Little Ice Age. The mid-19th century was during the pre-industrial period and the beginning of sea level rise cannot be attributed to anthropogenic CO2. Regarding the amount of data needed for analysis, scientists will always prefer more data to less and they should. That does not mean that we do not have enough data now to seriously question the theory of AGW and to begin searching for ways the theory may need to be modified. To restate: It is not possible for an anthropogenically caused radiative imbalance of 0.85 ± 0.15 watts per square meter not to show up in warming oceans year over year over year without some observable intervention such as a major volcano. I just do not see how anyone can argue with that very basic observation. -
chris at 03:52 AM on 13 May 2009A broader view of sea level rise
re #1: Ron, I think we can get too carried away with analyses over very short periods, and it’s an excellent idea of John’s to expand his analysis of sea level rise with a historical perspective. However going back to the recent period, the absence of warming in the upper oceans during the last five years can’t really be taken as evidence that our understanding of the effects of enhanced greenhouse gas concentrations is flawed, and it’s certainly not true that “If AGW theory is true ocean heat content and sea level would rise uninterrupted year over year over year.” As for your additional comment that “it would rise at a rate much greater than the natural rates seen during the non-industrialized years.”, the evidence is actually consistent with that assertion . There are a number of points: 1. Global warming theory (that enhanced greenhouse gas levels results in an enhanced global surface temperature at equilibrium, somewhere in the region of 2-4.5 oC per doubling of atmospheric CO2) certainly doesn’t require an uninterrupted rise in heat content/sea level. Obviously one can have periods where the radiative forcing in a warming world is temporally static or reduced (say the few years during which the insolation drops towards the solar minimum such that it opposes the small enhanced greenhouse warming for this period). We might well find no heat uptake by the oceans, and no warming during this period. During the solar “upswing” towards the solar maximum, enhanced insolation will reinforce (rather than oppose) slowly rising greenhouse forcing. 2. The other question is whether heat uptake by the oceans really has stopped during 2003. That conclusion/assumption is actually not fully consistent with the evidence. It’s correct that there has been little heat uptake in the upper (700 metres) of the ocean as measured by Argo floats. However if one considers the ocean heat budget in the manner that you suggest in your post (i.e. the steric, warmth-induced sea level rise and mass rise from land ice melt should be consistent with measured sea level rise determined from satellites), the most recent analyses indicate that there has been some enhanced steric (heat uptake) contribution to sea level rise during the last five years (see references below [*, **]. These papers indicate that 15% (Cazenave) or 40-50% (Leuliette and Miller) of the sea level rise in the period 2004-2008 is steric (i.e. due to heat uptake). 3. Obviously these are very short periods of measurement/analysis. We certainly don’t expect an uninterrupted rise in sea level, and a 4-5 year period with no steric contribution to sea level rise (i.e. due to heat uptake) isn’t unexpected. However that actually seems not to be the case. The oceans likely have absorbed heat during the last 5 years. Obviously even if there is no net heat uptake due to a temporary balance of radiative forcing, we expect the sea level to continue to rise due to mass uptake from melting land ice in a warm world… 4. John Cross has shown that the evidence indicates sea level rise has accelerated since the mid/late 19th century. During at least the 1000 before the mid 19th century, and likely for a further millennium before that, the evidence indicates that there was little if any net sea level rise [***]. [*]Cazenave A et al. (2009) Sea level budget over 2003-2008: A reevaluation from GRACE space gravimetry, satellite altimetry and Argo Glob. Planet. Change 65, 83-88. abstract: From the IPCC 4th Assessment Report published in 2007, ocean thermal expansion contributed by similar to 50% to the 3.1 mm/yr observed global mean sea level rise during the 1993-2003 decade, the remaining rate of rise being essentially explained by shrinking of land ice. Recently published results suggest that since about 2003, ocean thermal expansion change, based on the newly deployed Argo system, is showing a plateau while sea level is still rising, although at a reduced rate (similar to 2.5 mm/yr). Using space gravimetry observations from GRACE, we show that recent years sea level rise can be mostly explained by an increase of the mass of the oceans. Estimating GRACE-based ice sheet mass balance and using published estimates for glaciers melting, we further show that ocean mass increase since 2003 results by about half from an enhanced contribution of the polar ice sheets - compared to the previous decade - and half from mountain glaciers melting. Taking also into account the small GRACE-based contribution from continental waters (<0.2 mm/yr), we find a total ocean mass contribution of similar to 2 mm/yr over 2003-2008. Such a value represents similar to 80% of the altimetry-based rate of sea level rise over that period. We next estimate the steric sea level (i.e., ocean thermal expansion plus salinity effects) contribution from: (1) the difference between altimetry-based sea level and ocean mass change and (2) Argo data. Inferred steric sea level rate from (1) (similar to 0.3 mm/yr over 2003-2008) agrees well with the Argo-based value also estimated here (0.37 mm/yr over 2004-2008). Furthermore, the sea level budget approach presented in this study allows us to constrain independent estimates of the Glacial Isostatic Adjustment (GIA) correction applied to GRACE-based ocean and ice sheet mass changes, as well as of glaciers melting. Values for the CIA correction and glacier contribution needed to close the sea level budget and explain GRACE-based mass estimates over the recent years agree well with totally independent determinations. [**] Leuliette EW and Miller L.(2009) Closing the sea level rise budget with altimetry, Argo, and GRACE Geophys Res. Lett. 36, art # L0406 abstract: An analysis of the steric and ocean mass components of sea level shows that the sea level rise budget for the period January 2004 to December 2007 can be closed. Using corrected and verified Jason-1 and Envisat altimetry observations of total sea level, upper ocean steric sea level from the Argo array, and ocean mass variations inferred from GRACE gravity mission observations, we find that the sum of steric sea level and the ocean mass component has a trend of 1.5 +/- 1.0 mm/a over the period, in agreement with the total sea level rise observed by either Jason-1 (2.4 +/- 1.1 mm/a) or Envisat (2.7 +/- 1.5 mm/a) within a 95% confidence interval. [***]Church JA et al. (2008) Understanding global sea levels: past, present and future. Sustainability Science 3, 9-22 . abstract: The coastal zone has changed profoundly during the 20th century and, as a result, society is becoming increasingly vulnerable to the impact of sea-level rise and variability. This demands improved understanding to facilitate appropriate planning to minimise potential losses. With this in mind, the World Climate Research Programme organised a workshop (held in June 2006) to document current understanding and to identify research and observations required to reduce current uncertainties associated with sea-level rise and variability. While sea levels have varied by over 120 m during glacial/interglacial cycles, there has been little net rise over the past several millennia until the 19th century and early 20th century, when geological and tide-gauge data indicate an increase in the rate of sea-level rise. Recent satellite-altimeter data and tide-gauge data have indicated that sea levels are now rising at over 3 mm year(-1). The major contributions to 20th and 21st century sea-level rise are thought to be a result of ocean thermal expansion and the melting of glaciers and ice caps. Ice sheets are thought to have been a minor contributor to 20th century sea-level rise, but are potentially the largest contributor in the longer term. Sea levels are currently rising at the upper limit of the projections of the Third Assessment Report of the Intergovernmental Panel on Climate Change (TAR IPCC), and there is increasing concern of potentially large ice-sheet contributions during the 21st century and beyond, particularly if greenhouse gas emissions continue unabated. A suite of ongoing satellite and in situ observational activities need to be sustained and new activities supported. To the extent that we are able to sustain these observations, research programmes utilising the resulting data should be able to significantly improve our understanding and narrow projections of future sea-level rise and variability. -
Wondering Aloud at 03:38 AM on 13 May 2009A broader view of sea level rise
Good Post, I don't know how real the error bars can be on this, but I appreciate their existence in any event. I think we are seeing uncertainty being addressed and perhaps over simplified explanations are wrong no matter which side puts them forward. I wonder what a best straight line fit would tell you? Do you have a steady rise with rate variation due to climate variation or some other cause? Or is a curve as above really a better fit? Is it my imagination or do times of fast temp increase not match real great with times of maximum sea level rise? Is there a time lag? Much to think about. -
Ron Cram at 03:01 AM on 13 May 2009A broader view of sea level rise
Steve, I am very familiar with the instrumental error found by Josh Willis. The significant ocean cooling previously reported was the result of an error in the fall rate of the instrument. Josh Willis is a fine scientist. Even after the error was corrected, the oceans have not warmed since 2003. That is a huge problem for anyone who understands the claim of a radiative imbalance for our climate system. -
Ron Cram at 02:57 AM on 13 May 2009A broader view of sea level rise
Philippe, I cannot recall if Hansen says it exactly the way Roger Pielke, the ISI highly cited climatologist I referenced above, says it. If you understand the assertion made by Hansen, then the conclusion in unavoidable. Is there a radiative imbalance or not? Is there any physical theory that would allow for a radiative imbalance in one year and not in the following year? Yes, a volcanic eruption would tend to block the sun for a period of time. It happened with Pinatubo and the oceans cooled. Other than volcanoes, there is very little noise. Absent a volcanic eruption, the radiative imbalance would be there year after year after year. Where is all that heat going? A miniscule amount is stored in dirt and rocks, even less in the atmosphere, and the vast majority is stored in the oceans. There is no competing theory. Hansen's abstract at http://www.sciencemag.org/cgi/content/abstract/308/5727/1431 states the following: "Our climate model, driven mainly by increasing human-made greenhouse gases and aerosols, among other forcings, calculates that Earth is now absorbing 0.85 ± 0.15 watts per square meter more energy from the Sun than it is emitting to space. This imbalance is confirmed by precise measurements of increasing ocean heat content over the past 10 years." The oceans definitely did warm in the 1990s. This paper was published in 2005. Hansen has not been touting ocean heat content since it has been determined the oceans have not warmed since 2003. -
Steve L at 02:57 AM on 13 May 2009A broader view of sea level rise
Hi John: the link to Church 2006 didn't work for me. I wanted to see why in Figure 1 the standard deviation, after narrowing from 1870 to about 1995 then seems to broaden again. The other tidbit I found surprising was the apparently much greater effect of El Chichon vs Pinatubo. I think Ron Cram would like your old post: http://skepticalscience.com/Mystery-of-the-vanishing-ocean-heat.html and the linked update. -
Philippe Chantreau at 02:03 AM on 13 May 2009A broader view of sea level rise
Ron says: "If AGW theory is true, ocean heat content and sea level would rise uninterrupted year over year over year." All noise would completely disappear? Why? References on that assertion (real papers, not blog posts)? -
Ron Cram at 00:49 AM on 13 May 2009A broader view of sea level rise
John, first let me commend you on a fine post. However, it seems to me it could have been written by a AGW skeptic. It is a good thing to get some historical perspective on climate change. Too often the alarmists fail to look at the extent of natural climate variability. Your post is actually drawing attention to the fact the globe has been warming naturally since the Little Ice Age. Kudos to you. Regarding how many years of data are required for a solid analysis, the issue goes directly to the quality of data and the physical theories involved. For example, if you are talking about annualized global surface temp (confounded with microsite issues and UHI effects) and measured in hundredths of a degree like HadCRUT3 - then yes you need more than a handful of years to have a viable trend. If you are talking ocean heat content and sea level rise, it is a different story. One of the greatest causes of sea level is thermal expansion. As the oceans get warmer, the sea level rises. Prior to 2003, we had sparse coverage of ocean temps and knew little about ocean depths. We now have more than 3000 ARGO network floats covering the globe giving us the best data on ocean temps down to 700m. It is far superior to the land-based observation system we have. And sea level is also measured very precisely by satellites giving us much better confidence of our instrumentation. So what physical theories are involved? The most important one is AGW itself. James Hansen has claimed that due to anthropogenic CO2 the earth has a radiative imbalance so that the earth's energy budget is out of balance. We have more heat coming into our climate system each year than going out. It is an interesting theory and could be catastrophic. Where would we see the most obvious evidence this theory is true? In the oceans! Water is very efficient at storing heat and the size and depth of the oceans means the heat stored there is many, many times greater than the heat stored in rocks or atmosphere. If AGW theory is true, ocean heat content and sea level would rise uninterrupted year over year over year. And it would rise at a rate much greater than the natural rates seen during the non-industrialized years. I have not actually seen any data on recent sea level rise, but I have read papers on ocean heat content. In calculating ocean heat content, scientists cross-check data from ARGO floats with the satellite measurements of sea level. If data shows one going up and one going down, they may have an error in their data somewhere. Within certain margins of error, this data has to correlate. According to Josh Willis of JPL, ocean heat content has not increased since 2003. This fact is the greatest challenge to the theory of AGW. And it tells me that sea level rise cannot be too great. Roger Pielke, an ISI highly cited climatologist, has blogged on AGW and ocean heat content at http://climatesci.org/2009/02/09/update-on-a-comparison-of-upper-ocean-heat-content-changes-with-the-giss-model-predictions/ Of course, other factors can impact sea level rise. One of them is plate tectonics. If plates shift and the ocean bowl is not as deep, sea level will rise. I look forward to your next post on sea level rise.Response: I venture to say the difference between my post and a skeptic post is I haven't drawn any wild conclusions like "AGW is falsified" by the sea level record. An emerging theme on this website is that you need to get a complete picture in order to draw reliable conclusions. I haven't even begun to look at why sea level is rising. To do that, you need to look at all the causes of sea level rise - thermal expansion, melting glaciers, melting and calving ice sheets. That, again, is a topic for another post. The point of this post (and the previous post) was merely to disabuse the notion that sea level rise had stopped.
As for ocean heat, why would you say ocean heat needs to show monotonic increase from year to year? On the contrary, measurements over the past 50 years of ocean heat have shown a noisy signal where short periods of cooling are not unusual amidst the long term warming trend. As this post shows, look at the complete record, not a short period, before drawing conclusions. -
ginckgo at 13:54 PM on 12 May 2009Climate's changed before
Thanks for your response, Chris I don't have an issue with significant changes in volcanic activity influencing climate - the correlation is quite obvious. However, Quietman's #106 post (para. 3) seemed to imply that it is the heat released into water that substantially drives climate by altering ocean currents. There's a difference between the influence on climate that subaerial volcanic gas emissions can have (effectively altering the total amount of solar energy in the system), and that of heat out of the earth's interior. The references you cite only focus on the former, but Quietman is mainly arguing direct and indirect influences from the latter. I've never seen any data on the effect of ocean basin heat on the global ocean current conveyor belt. It is generally accepted that this is mostly driven by Thermohaline circulation in our Icehouse climate (dominated by the polar ice caps), which probably overwhelms most other influences on larger scales. Surface current changes (which can influence upwelling) can be caused by changes in atmospheric circulation, but again, this is not influenced by heat released from the earth. It's interesting to note that during a Greenhouse climate (e.g. Cretaceous) the global circulation tends to be driven by Halothermal circulation (dominated by evaporation at the equator), which is much weaker and can easily lead to stagnant oceans. -
Geoff Larsen at 11:08 AM on 12 May 2009Is the climate warming or cooling?
In reading through the post the comments on this thread I find it amazing that no-one has mentioned the effect of the volcanoes, El Chichon in Apr 1982 & Pinatubo in June 1991. If you look at the top chart the significant cooling effect of these events is self evident & further they explain in large part the low/negative trends mentioned in1977-1985 & 1987-1996. The cooling effects of these events occur in the latter years of these periods. What is unique about the flat period abt 2000-2009, since after 1960, is that this has occurred in the absence of a major, cooling, volcano. Furthermore the trends calculated over the past 30 years would have been significantly less if El Chichon & Pinatubo had not occurred (these events occurred in the first half of the past 30 year period). See also: - http://rankexploits.com/musings/2009/how-would-figure-95a-from-the-ar4-look-today/ -
Patrick 027 at 09:38 AM on 12 May 2009Arctic sea ice melt - natural or man-made?
"very weak GHG" A milligram is not much mass. A trillion milligrams = a billion g = a million kg = a thousand metric tons. Massive. -
Patrick 027 at 09:24 AM on 12 May 2009Arctic sea ice melt - natural or man-made?
Quietman - CO, and I suspect, HC, will oxydize to CO2 anyway; but CO and HC are themselves undesirable in the air (above some limits). The reasons that these and NOx are called 'pollution' is not mainly from any direct radiative forcing but from more direct biological effects (NOx -> acid rain -> not good for plants, statues, etc.). On a per atom C basis, CO and HC may be worse for the environment than CO2 (but when those C atoms are fossil C emissions, they ultimately add CO2 to the atmosphere anyway), but this does not in any way imply that massive anthropogenic CO2 emissions do not have serious consequences. "According to the Federal Register the goal is to limit CO, NOx and HC by converting it to CO2 and water vapor as the end product of combustion. Why would we intentionally produce pollution?" 1. So what if the policy at one time ignores global warming risk? Once upon a time, there were few restrictions on smoking and ciggarette advertising - why would people not restrict an unhealthy product? Well, it is unhealthy, and (libertarian objections aside) now we have restrictions. 2. There are many substances or other things (heat, sound) that are present naturally at some level, but can be harmful if found in significantly higher concentrations. Some things (so far as I know, Hg, some artificial substances, etc.) are not beneficial to most or all organisms at any concentration, but there is some (generally very low) background level that can be tolerated. Some substances (Pb, Se) are benificial or even necessary for some or most organisms in small or trace amounts, but will generally be harmful in higher quantities. UV radiation can work as a natural disinfectant, produce hyroxyl radicals in the atmosphere that help cleanse the atmosphere of some substances (though in the short term it can produce photochemical smog when other pollutants are present), and it helps our bodies make vitamin D (though some of us do not need this because of modern food processing); but UV radiation can also cause cancer and fade colors, etc. Generally people obviously enjoy and benifit from light and sound, some level of heat, etc, but there can be too much (or too little). There are such things as light, sound, and heat pollution (they can have environmental effects as well). Early in earth's history, HCN and H2S may have been very important to life, while free O2 was toxic, but for most ecosystems today, the reverse is the case. Rain is naturally a litte acidic, but acid rain is problematic. Some places may naturally have different geochemical and geophysical conditions that only a small subset of organisms are adapted to - they may thrive there, but this doesn't imply such conditions should be artificially replicated in many other places. Life has and will adapt to changing conditions, including changing CO2 levels and their climatic effects, but evolution can only go so far so fast; large sudden changes into relatively unfamiliar conditions (as measured by time since last occurence) are costly; either such an increase in CO2 or such a decrease (unless immediately following such an increase - and even then...) can/will be problematic; I don't know what such a decrease would be called, but in the context of such an increase, additions of CO2 from outside a balanced cycle can be considered pollution. -
chris at 08:35 AM on 12 May 2009Models are unreliable
-
Patrick 027 at 05:21 AM on 12 May 2009It's the sun
Great info, chris! -
chris at 22:33 PM on 11 May 2009Is the climate warming or cooling?
re #16 WA you make two entirely contradictory statements:Lee I was trying to explain that a theory that fails to explain the observations. All observations, not just selected ones, must be discarded.
and:It is clear that the hypothesis of AGW by CO2 as popularized by people like James Hansen and Steve Schneider 20 years ago, i.e. 2-3 degrees C net warming by the year 2000, was totally wrong.
Unfortunately you are continually reluctant to address observations, and just make stuff up. A made up falsehood is not an "observation". That amounts to little more than trolling. It's very easy to establish, for example, what Hansen predicted 20 years ago. He set up early GCM models, published in 1988, that projected warming under different emission scenarios [*]. The projections under modest emission scenarios very similar to those actually accruing in the intervening years were that the global temperature would warm in 2000 (from 1960 levels) by 0.4 oC (scenario C; emissions to stop after 2000) or 0.5 oC (scenario B; this is the emissions scenario that most closely matches the intervening reality). Even the scenario (scenario A) designed to assess excess emissions "on the high side of reality", only projected a warming by 2000 of around 0.75 oC. Add about 0.3 oC if you wish to normalise these values with respect to mid 19th century temperatures. The actual global surface temperature at 2000 was rather close to Hansen's modelled projections. since you can download this stuff (try: http://pubs.giss.nasa.gov/docs/2006/2006_Hansen_etal_1.pdf for a description of this work - see Figure 2)... ...it's very difficult to see what you gain by creating obvious falsehoods. You may not have much understanding of science, but you should at least know that it's based on evidence ,and generally individuals post here accordingly. Making up stuff to support an agenda isn't skepticism! [*]Hansen J et al. (1988) Global climate changes as forecast by Goddard Institute for Space Studies three-dimensional model. J Geophys Res 93:9341–9364. -
chris at 20:36 PM on 11 May 2009Volcanoes emit more CO2 than humans
re #215 Quietman, your assertion:That government site that posted a hypothesis for the volcanic nature for the root cause for ENSO....
...is a gross overinterpretation of the relevant scientific evidence! The evidence (see [**, ***, ***] below) indicates that very strong volcanic eruptions of a magnitude that result in significant injection of volcanic aerosols into the stratosphere, can influence ocean circulation through the effects of the stratospheric aerosols on solar radiative forcing. There is no evidence whatsoever that "volcanic nature" is the "root cause" of ENSO. In fact the authors specifically state that this effect (aerosolic effect on radiative forcing) doesn't cause ENSO changes (El Nino's in the winter following the eruption), but enhances their probabilities and amplitudes. I posted abstracts of some of the relevant papers on another thread, but this thread seems most appropriate and I'll repost them here. Note that it's not the volcanic activity per se that is responsible. The heat from tectonics is far too small (the geothermal flux is around 0.1 W/m2 compared to the combined solar-greenhouse surface flux above 150 W/m2). It's the effects of volcanic aerosols on solar radiative forcing at the surface. [*]J. B. Adams et al (2003) Proxy evidence for an El Niño-like response to volcanic forcing. Nature 426, 274-278 Abstract: Past studies have suggested a statistical connection between explosive volcanic eruptions and subsequent El Niño climate events1, 2. This connection, however, has remained controversial3, 4, 5. Here we present support for a response of the El Niño/Southern Oscillation (ENSO) phenomenon6, 7 to forcing from explosive volcanism by using two different palaeoclimate reconstructions of El Niño activity8, 9 and two independent, proxy-based chronologies of explosive volcanic activity5 from ad 1649 to the present. We demonstrate a significant, multi-year, El Niño-like response to explosive tropical volcanic forcing over the past several centuries. The results imply roughly a doubling of the probability of an El Niño event occurring in the winter following a volcanic eruption. Our empirical findings shed light on how the tropical Pacific ocean–atmosphere system may respond to exogenous (both natural and anthropogenic) radiative forcing. [**] Emile-Geay J et al. (2008) Volcanoes and ENSO over the past millennium. J. Climate 21, 3134-3148. abstract: The controversial claim that El Nino events might be partially caused by radiative forcing due to volcanic aerosols is reassessed. Building on the work of Mann et al., estimates of volcanic forcing over the past millennium and a climate model of intermediate complexity are used to draw a diagram of El Nino likelihood as a function of the intensity of volcanic forcing. It is shown that in the context of this model, only eruptions larger than that of Mt. Pinatubo ( 1991, peak dimming of about 3.7Wm(-2)) can shift the likelihood and amplitude of an El Nino event above the level of the model's internal variability. Explosive volcanism cannot be said to trigger El Nino events per se, but it is found to raise their likelihood by 50% on average, also favoring higher amplitudes. This reconciles, on one hand, the demonstration by Adams et al. of a statistical relationship between explosive volcanism and El Nino and, on the other hand, the ability to predict El Nino events of the last 148 yr without knowledge of volcanic forcing. The authors then focus on the strongest eruption of the millennium (A. D. 1258), and show that it is likely to have favored the occurrence of a moderate-to-strong El Nino event in the midst of prevailing La Nina-like conditions induced by increased solar activity during the well-documented Medieval Climate Anomaly. Compiling paleoclimate data from a wide array of sources, a number of important hydroclimatic consequences for neighboring areas is documented. The authors propose, in particular, that the event briefly interrupted a solar-induced megadrought in the southwestern United States. Most of the time, however, volcanic eruptions are found to be too small to significantly affect ENSO statistics. [***]Christiansen B (2008) Volcanic eruptions, large-scale modes in the Northern Hemisphere, and the El Nino-southern oscillation. J. Climate 21, 910-922 . abstract: The author analyzes the impact of 13 major stratospheric aerosol producing volcanic eruptions since 1870 on the large-scale variability modes of sea level pressure in the Northern Hemisphere winter. The paper focuses on the Arctic Oscillation (AO) and the North Atlantic Oscillation (NAO) to address the question about the physical nature of these modes. The hypothesis that the phase of the El Nino-Southern Oscillation (ENSO) may control the geographical extent of the dominant mode in the Northern Hemisphere is also investigated, as well as the related possibility that the impact of the eruptions may be different according to the phase of ENSO. The author finds that both the AO and the NAO are excited in the first winter after the eruptions with statistical significance at the 95% level. Both the signal and the significance are larger for the NAO than for the AO. The excitation of the AO and the NAO is connected with the excitation of a secondary mode, which resembles an augmented Pacific-North American pattern. This mode has opposite polarity in the Atlantic and the Pacific and interferes negatively with the AO in the Pacific and positively in the Atlantic in the first winter after the eruptions, giving the superposition a strong NAO resemblance. Some evidence is found that the correlations between the Atlantic and the Pacific are stronger in the negative ENSO phase than in the positive phase, although this difference is not statistically significant when all data since 1870 are considered. The author does not find any evidence that the impact of the volcanic eruptions is more hemispheric in the negative than in the positive ENSO phase. -
chris at 19:48 PM on 11 May 2009Climate's changed before
Gincko There is a weak statistical relationship between volcanic activities and ENSO with an enhanced probability of El Nino-like conditions in the winter following a volcanic eruption. Contemporary interest in this idea comes from a study published in Nature a few years back [*]. More recent research [**,***] supports a weak correlation and indicates that it is only the most vigorous volcanic eruptions that result in ejection of volcanic aerosols into the stratosphere that produce significant effects on ocean circulation. Of course this effect has nothing whatsoever to do with the heat from the volcanoes per se! That is just silly. As you say, the geothermal flux is simply too weak, although I believe there is some evidence that undersea crustal heat flow can influence ocean mixing and thus help to draw warmth down to the deeper oceans in a warming world (???). Obviously anyone asserting a contribution of geothermal heating to global warming should provide evidence not that this very weak geothermal flux exists, but that this has increased in line with periods of known global warming (like now!). The advocates of that notion seem reluctant to come up with any such evidence…. The weak relationship between strong volcanic eruptions and ENSO is due to the aerosolic load and its effects on radiative solar forcing.. I have to say I haven’t read the papers in detail, so the exact mechanism isn’t clear to me. If I have time I’ll have a more detailed look… [*]J. B. Adams et al (2003) Proxy evidence for an El Niño-like response to volcanic forcing. Nature 426, 274-278 abstract: Past studies have suggested a statistical connection between explosive volcanic eruptions and subsequent El Niño climate events1, 2. This connection, however, has remained controversial3, 4, 5. Here we present support for a response of the El Niño/Southern Oscillation (ENSO) phenomenon6, 7 to forcing from explosive volcanism by using two different palaeoclimate reconstructions of El Niño activity8, 9 and two independent, proxy-based chronologies of explosive volcanic activity5 from ad 1649 to the present. We demonstrate a significant, multi-year, El Niño-like response to explosive tropical volcanic forcing over the past several centuries. The results imply roughly a doubling of the probability of an El Niño event occurring in the winter following a volcanic eruption. Our empirical findings shed light on how the tropical Pacific ocean–atmosphere system may respond to exogenous (both natural and anthropogenic) radiative forcing. [**] Emile-Geay J et al. (2008) Volcanoes and ENSO over the past millennium. J. Climate 21, 3134-3148. abstract: The controversial claim that El Nino events might be partially caused by radiative forcing due to volcanic aerosols is reassessed. Building on the work of Mann et al., estimates of volcanic forcing over the past millennium and a climate model of intermediate complexity are used to draw a diagram of El Nino likelihood as a function of the intensity of volcanic forcing. It is shown that in the context of this model, only eruptions larger than that of Mt. Pinatubo ( 1991, peak dimming of about 3.7Wm(-2)) can shift the likelihood and amplitude of an El Nino event above the level of the model's internal variability. Explosive volcanism cannot be said to trigger El Nino events per se, but it is found to raise their likelihood by 50% on average, also favoring higher amplitudes. This reconciles, on one hand, the demonstration by Adams et al. of a statistical relationship between explosive volcanism and El Nino and, on the other hand, the ability to predict El Ni no events of the last 148 yr without knowledge of volcanic forcing. The authors then focus on the strongest eruption of the millennium (A. D. 1258), and show that it is likely to have favored the occurrence of a moderate-to-strong El Nino event in the midst of prevailing La Nino-like conditions induced by increased solar activity during the well-documented Medieval Climate Anomaly. Compiling paleoclimate data from a wide array of sources, a number of important hydroclimatic consequences for neighboring areas is documented. The authors propose, in particular, that the event briefly interrupted a solar-induced megadrought in the southwestern United States. Most of the time, however, volcanic eruptions are found to be too small to significantly affect ENSO statistics. [***]Christiansen B (2008) Volcanic eruptions, large-scale modes in the Northern Hemisphere, and the El Nino-southern oscillation. J. Climate 21, 910-922 . abstract: The author analyzes the impact of 13 major stratospheric aerosol producing volcanic eruptions since 1870 on the large-scale variability modes of sea level pressure in the Northern Hemisphere winter. The paper focuses on the Arctic Oscillation (AO) and the North Atlantic Oscillation (NAO) to address the question about the physical nature of these modes. The hypothesis that the phase of the El Nino-Southern Oscillation (ENSO) may control the geographical extent of the dominant mode in the Northern Hemisphere is also investigated, as well as the related possibility that the impact of the eruptions may be different according to the phase of ENSO. The author finds that both the AO and the NAO are excited in the first winter after the eruptions with statistical significance at the 95% level. Both the signal and the significance are larger for the NAO than for the AO. The excitation of the AO and the NAO is connected with the excitation of a secondary mode, which resembles an augmented Pacific-North American pattern. This mode has opposite polarity in the Atlantic and the Pacific and interferes negatively with the AO in the Pacific and positively in the Atlantic in the first winter after the eruptions, giving the superposition a strong NAO resemblance. Some evidence is found that the correlations between the Atlantic and the Pacific are stronger in the negative ENSO phase than in the positive phase, although this difference is not statistically significant when all data since 1870 are considered. The author does not find any evidence that the impact of the volcanic eruptions is more hemispheric in the negative than in the positive ENSO phase. -
ginckgo at 14:39 PM on 11 May 2009Climate's changed before
#106: Crustal heat contributes relatively negligible amounts to the system. Certainly not enough to significantly influence ocean currents. In today's Icehouse climate they are primarily driven by Thermohaline circulation, which in itself is driven by the creation of cold saline waters in polar regions. I have never heard of any correlation between ENSO and tectonic factors. I'd like to see the data for that. Plus, tectonics doesn't fluctuate on ENSO time scales, nowhere near. I don't even know where to start on the last paragraph - not even wrong comes to mind. -
ginckgo at 13:37 PM on 11 May 2009Volcanoes emit more CO2 than humans
Volcanoes don't drive ocean currents. Read up on thermohaline circulation. -
ginckgo at 12:42 PM on 11 May 2009Human CO2 is a tiny % of CO2 emissions
@#4: "Oceanic CO2 release decreases the acidity of sea water and carbonate fixing biota do better and lock up more CO2 allowing more CO2 to enter the oceans." This is wrong. CO2 absorbed by water generally INCREASES the acidity, thus lowering the ability of organisms to secrete carbonate. And where they do secrete it, it dissolves more readily once they are dead. The only saving grace here may be that calcium carbonate has an inverse solubility relative to temperature, i.e. as temperature goes up, solubility decreases. -
chris at 08:15 AM on 11 May 2009It's the sun
Re #348/350 I was talking about the PETM (Paleo-Eocene Thermal Maximum. You should try to be a bit more specific/explicit in your discourse! The PETM had nothing to do with the collision of the African and Eurasian plates (see post # 329 on this thread) and is characterised by a massive spike in the atmospheric CO2 concentration (possibly originally in the form of methane) and is contemporaneous with the opening up of the North Atlantic at the nascent plate boundary. The warm Eocene period is itself very likely due to high CO2 concentrations as indicated by proxy CO2 measurements from sediments from those periods [**]. Likewise the long, slow cooling in the middle to late Eocene is associated with a continual slow decrease in atmospheric CO2 concentrations as indicated by proxy CO2 measures from cores [***]. There’s very little evidence that it is heat from (changes in) tectonic activity that generates warming above background levels. The geothermal flux is just too small (around 0.1 W/m2 compared to the greenhouse-augmented solar flux absorbed by the Earth’s surface of over 150 W/m2). Nevertheless recent evidence supports a fundamental role for plate tectonics and continental drift in Eocene warming/cooling. In this case it is the Northward movement of the Indian plate towards Asia that is proposed as the source of the slow, slow ramp up of atmospheric CO2 (and associated warming) and the slow,slow loss of CO2 that progressed into the Oligocene and gave the world Antarctic glaciation. The scenario is as follows [****]: a. As the Indian plate drifted Northwards through the late Mesozoic and into the early Cenozoic (Paleozoic-early Eocene [*]), the carbonate-rich deposits on the ocean floor of the Asiatic margin of the Tethys ocean were subducted beneath the Asiatic plate resulting in their decarbonation and the steady release of CO2 over millions of years. Around 65 MYA and lasting for about 1 million years the massive Deccan traps formation was created in the centre-West of the “Indian” continent as basaltic outpouring from eruption of a mantle plume. b. This “CO2 factory” ceased around 50 MYA as the ocean between the continents was consumed. Continental collision resulted in strong uplift in the collision zone, producing enhanced rainfall. c. The movement of the Indian continent and its massive Deccan Trap into the equatorial belt, together with the enhanced rainfall arising from mountain formation produced strong weathering. Basaltic rocks like the Deccan are strong consumers of CO2 (5-10 times more CO2 consumed compared to granitic rocks under similar weathering conditions). From around 50 MYA through to the late Eocene, CO2 levels dropped, the Earth cooled and 35 MYA or so ago the Earth was sufficiently cool for a substantial ice cap to form in Antarctica….. ([*]for a temporal evolution of global temperature during these periods see: http://en.wikipedia.org/wiki/File:65_Myr_Climate_Change.png) [**] T. K. Lowenstein and R. V. Demicco (2006) Elevated Eocene Atmospheric CO2 and Its Subsequent Decline Science 313, 1928-9. abstract: Quantification of the atmospheric concentration of CO2 ([CO2]atm) during warm periods of Earth's history is important because burning of fossil fuels may produce future [CO2]atm approaching 1000 parts per million by volume (ppm). The early Eocene (~56 to 49 million years ago) had the highest prolonged global temperatures of the past 65 million years. High Eocene [CO2]atm is established from sodium carbonate minerals formed in saline lakes and preserved in the Green River Formation, western United States. Coprecipitation of nahcolite (NaHCO3) and halite (NaCl) from surface waters in contact with the atmosphere indicates [CO2]atm > 1125 ppm (four times preindustrial concentrations), which confirms that high [CO2]atm coincided with Eocene warmth. [***]M. Pagani et al. (2005) Marked Decline in Atmospheric Carbon Dioxide Concentrations During the Paleogene Science 309, 600-603. abstract: The relation between the partial pressure of atmospheric carbon dioxide (pCO2) and Paleogene climate is poorly resolved. We used stable carbon isotopic values of di-unsaturated alkenones extracted from deep sea cores to reconstruct pCO2 fromthe middle Eocene to the late Oligocene (45 to 25 million years ago). Our results demonstrate that pCO2 ranged between 1000 to 1500 parts per million by volume in the middle to late Eocene, then decreased in several steps during the Oligocene, and reached modern levels by the latest Oligocene. The fall in pCO2 likely allowed for a critical expansion of ice sheets on Antarctica and promoted conditions that forced the onset of terrestrial C4 photosynthesis [****] D. V. Kent and G. Muttoni (2008) Equatorial convergence of India and early Cenozoic climate trends Proc. Natl. Acad. Sci. USA. 105, 16065-16070 abstract: India's northward flight and collision with Asia was a major driver of global tectonics in the Cenozoic and, we argue, of atmospheric CO2 concentration (pCO2) and thus global climate. Subduction of Tethyan oceanic crust with a carpet of carbonate-rich pelagic sediments deposited during transit beneath the high-productivity equatorial belt resulted in a component flux of CO2 delivery to the atmosphere capable to maintain high pCO2 levels and warm climate conditions until the decarbonation factory shut down with the collision of Greater India with Asia at the Early Eocene climatic optimum at ≈50 Ma. At about this time, the India continent and the highly weatherable Deccan Traps drifted into the equatorial humid belt where uptake of CO2 by efficient silicate weathering further perturbed the delicate equilibrium between CO2 input to and removal from the atmosphere toward progressively lower pCO2 levels, thus marking the onset of a cooling trend over the Middle and Late Eocene that some suggest triggered the rapid expansion of Antarctic ice sheets at around the Eocene-Oligocene boundary. -
pdt at 07:22 AM on 11 May 2009Are sea levels rising?
"But if the trend is changing where do you draw the line?" You can draw any line you want, you just can't use it to extrapolate into the future. You need a climate model for that. -
Mizimi at 06:46 AM on 11 May 2009Climate sensitivity is low
Have a read: http://www.john-daly.com/forcing/review.htm which has commentaries on Hug & Barrett's presentation on climate sensitivity. You can access the original paper direst from the web page. -
BarryW at 04:07 AM on 11 May 2009Are sea levels rising?
But if the trend is changing where do you draw the line? if you take the whole period of your first chart you get 3.2, but if you just take the portion relative to JASON you get about 2.3. Is JASON or TOPEX data skewed, or are we seeing the rate drop significantly? With temperature not increasing in the 21st century (so far) the drop in sealevel change doesn't seem abnormal or just noise. -
BarryW at 03:48 AM on 11 May 2009Is the climate warming or cooling?
Yes, decadal periods are too short to determine whether there are long term trends. If you calculate trends using 30 yrs over the length of the Hadley global anomaly data you get the following: Total number of trends calculated: 1551 total positive trends 994 total negative trends 560 total trends gt .1 deg per decade 444 Which leads to the question is not if the climate is warming but how much? Here is a plot of the trends in Deg/Yr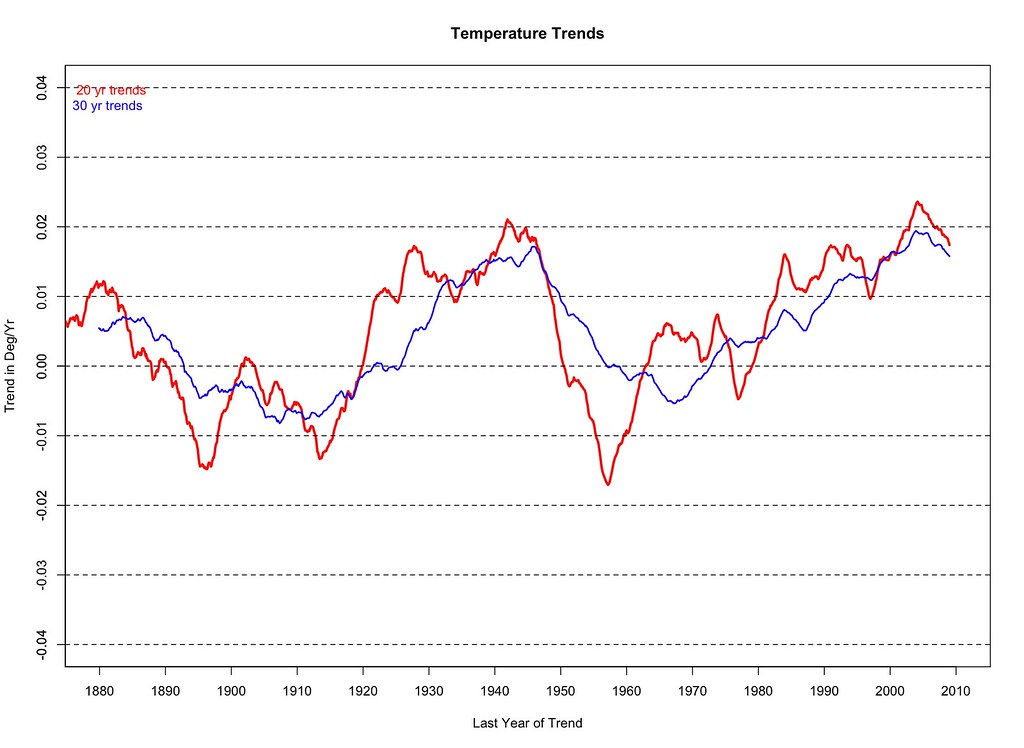 Notice the peaks at 60 yr intervals. Even if the temps are going up on the long term it appears we are due for a decrease over the next 30 years, which is not going to do much for those that are trying to promote changes based on near term measurements.
-
Philippe Chantreau at 03:04 AM on 11 May 2009How to cherry pick your way to Antarctic land ice gain
Tree, your argument is flawed on several counts. First there is the fact that the overwhelming majority of climate scientists do not dispute at all the reality of AGW. Second is the fact that the overwhelming majority of "skeptics" are not scientists. Most of the ones who are come from different areas of practice. The true dissenting climate scientist are a very small minority. Their ideas, when they have any alternative to propose, have not been ignored. You're equating a "wealth of scientific papers" with rethoric. That does not make any sense. The problem stated in the post you refer to is exactly that what is contained in a wealth of scientific papers can not be so easily communicated as good rethoric, no matter how empty. WA earlier had a great example of rethoric by calling 21% of the past 2 years "much." Anyone reading that and not bothering to actually look at the data could easily interpret it as "most of the time" although it is quite far from it. By using this one little word, WA can convey the message (without actually saying so) that most of the past 2 years saw positive anomaly, although the data shows exactly the opposite. -
Ron Cram at 00:35 AM on 11 May 2009Is the climate warming or cooling?
John, you are quite correct that start and end dates can change statistical results dramatically. These are issues that need to be discussed. But they need to be discussed, in part, within the context of relevant physical theories. For example, everyone knows about the warm period from 1975 to 2007. The climate regime shift that occurred in 1975 was very strong. A similarly strong climate regime shift happened in about 1942 from a warm period to a cool period. This is discussed in the 2002 Bratcher and Giese paper http://www.agu.org/pubs/crossref/2002/2002GL015191.shtml Based on observations Bratcher and Giese made in 2002, they predicted a return to a cool climate regime "soon" based on observations they made on the oscillation in the tropical Pacific ocean. Others have written about the link between shifts in the PDO from its cool phase to warm phase in 1975. And the PDO did shift back into a cool phase in late 2007. While one can claim the planet was still warming from 1999 to 2007, it is very hard to ignore the strong drop in temperature between 2007 and 2008. It will take time to see if this is the start of a persistent trend. But to be honest, looking at surface temps is not really a good metric for monitoring climate change. James Hansen wrote about the radiative imbalance due to anthropogenic CO2 and claimed the earth's energy budget was out of balance causing the oceans to warm and this stored heat was "heat in the pipeline" that would show up in the atmosphere later. I really do not like this way of thinking about it. The oceans are an important part of the climate system. In fact, because water stores heat so much more efficiently than the atmosphere, the ocean is the best place to monitor climate change. If Jim Hansen is correct that OC2 has caused the earth's energy budget to be out of balance, the oceans should be warming year over year consistently. After all, where else can the heat go? But Josh Willis from JPL has published on this. The oceans have not warmed since 2003. This is a significant finding because the start and end dates do not play a big role. Because of the nature of the physics involved, warming should be measurable year over year consistently because the signal is significantly more than noise, this is THE most important climate metric we can study. Roger Pielke, an ISI highly cited climatologist, has blogged on this at http://climatesci.org/2009/02/09/update-on-a-comparison-of-upper-ocean-heat-content-changes-with-the-giss-model-predictions/ Ocean heat content really gets to the heart of the issue of "warming vs. cooling." It should be discussed more often. -
theTree at 18:45 PM on 10 May 2009How to cherry pick your way to Antarctic land ice gain
I'd like to comment in the first paragraph: "I would suggest that scientists are not always completely effective at communicating their science to the average person. Global warming skeptics, on the other hand, have a wide range of rhetorical techniques that are quite successful in sowing doubt." Whilst I'm still without an opinion on anthropogenic climate change (through lack of knowledge on this complex subject), this opener certainly rings alarm bells with me. Chiefly: 1. Having 'scientists' on the one hand and 'global warming skeptics' on the other. This suggests that skeptics aren't scientists and proponents are. This is no more accurate than the reverse: that most proponents are layman and skeptics are scientists. Consider the hoards of ill informed protesters... 2. The assertion that global warming skeptics are adept at rhetoric whilst proponents struggle in this area. The wealth of scientific papers supporting anthropogenic climate change, plus the unrelenting media support, contradicts this. As the authors personal views are so obvious, I immediately worry there will be a bias in the text. And, in a complex subject area where bias and misinformation is rife, its not something I as a confused layman can afford! And aside from anything else, it makes someone still considering a skeptical point of view feel alienated and patronized - hardly the point of this website. Its a good article, but the absolute need for objectivity shouldn't be forgotten, no matter what gets publicized elsewhere. -
Quietman at 03:19 AM on 10 May 2009Climate's changed before
This is why we get a warning when El Nino is beginning by volcanic eruptions in Chile. It's not the volcano that causes El Nino, it's just a symptom of the tectonic activity and it's accompanying vulcanism. And I have to stop for now since my grandson is having a tamtrum and I can't think straight with the noise. -
Quietman at 03:14 AM on 10 May 2009Climate's changed before
The temperature of the ocean floor is variable. The depths have a thinner crust in general so transfer more heat and the volcanic active areas transfer heat from the magma directly to the water. The proximate temps change rapidly simply because the the amount of cold water available to sink this heat. But just like applying heat to the bottom of a pot of water, convection currents are created in both up and down directions. Some of these are fairly constant coming from the ocean depths but some are highly variable where volcanic activity exists and this can be at any depth along the ridges. At times of eruptions or even just increased plate movement the heat released into the water increases and either creates a new current or strengthens the existing current. As explained in the volcano thread, the ENSO is a real time example of this very driver. The subduction of the pacific plate under the Andes slows and speeds up in an irregular cycle. It's irregular because of the continental crust being uneven densiity and shape and made of materials of various ores with different melting points. -
Quietman at 02:59 AM on 10 May 2009Climate's changed before
The changes in climate from changes in the Earth are not immediately obvious unless you realize that ocean currents have a much stronger effect than air currents. This is because the atmosphere is not efficient as a buffer, ie. GHGs are not as efficient as the ocean (or any body of water) at storing energy including heat. What is key to understanding how oceans drive climate is the convection currents (upwelling and downwelling currents). We know that ocean temperatures are not globally uniform. Some bodies of water are warmer or cooler than others. But what is more important is that the depths are different temperatures and the colder water sinks while the hotter water rises. Simple. Next comes the more complex part. -
Quietman at 02:45 AM on 10 May 2009It's the sun
Patrick Re: "I do not see any reason to expect changes in the geothermal heat flux itself to have a significant climateic impact on regional to global scales over most of geologic time." See the maps I posted links to on page 14 here and the additional maps in the "Climate's changed before" thread. I'll try to explain in that thread. -
Patrick 027 at 14:36 PM on 9 May 2009It's the sun
I accept tectonic drivers of climate on the millions of years time scale via geographical changes (directly forcing climate changes, also shaping some aspects of the carbon cycle) and geologic CO2 emissions. (Obviously this can all affect biological evolution and that will have climatic effects as well.) (I also accept that climate can affect geology - an example is that dry conditions have something to do with the heights achieved by the Andes, though I forget the details (lack of erosion leading to less sediment fed into the subduction zone?)) I do not see any reason to expect changes in the geothermal heat flux itself to have a significant climateic impact on regional to global scales over most of geologic time. -
Quietman at 03:38 AM on 9 May 2009It's the sun
Patrick As we discussed in the Volcano thread, Continental Drift was considered a steady gradual process until quite recently. Not we know that it is not. The recent increase alone is proof of that (I won't rehash details here). I know that you do not accept the hypothesis of a tectonic driver of climate, this is understandable as it is an opposing hypothesis, but I think with a little more study it will prove to be important to understanding climate. -
tommybar at 03:16 AM on 9 May 2009Is the climate warming or cooling?
Often I've heard how 1934 was the hottest year in US climate records. Often in response, people will say then that 1998, and closely behind 2005 are the warmest 'global' recorded years. Take a look at this: http://www.globalwarmingart.com/wiki/Image:GHCN_Temperature_Stations_png The vast majority of sites going back over 90 years are in the continental USA. So, the long term records are really only good for the USA and parts of western Europe. These areas have also become much more urbanized over these time periods, so the UHI effect is very important. Now days we have a much more 'global' temperature gathering network. So, I have to wonder--how do we know what the true global temperatures were, say in the 30's? i.e., if we had the capabilities then to record remote locations, that 'global' temperature may have been higher--or even lower. There seems to be so much in our temperature records that are suspect. The US shows a definite cooling trend, with the 'global' trend there as well--so I'd say it's cooling now after a couple of decades of warming. Going back further, I think a lot of guess work come's into play. -
Patrick 027 at 03:03 AM on 9 May 2009It's the sun
Sometimes the possibilities for unknown quantities can be bracketed by known quantities. Most of the geothermal heat escaping the Earth is through slow conduction through rock, not generally subject to rapid fluctuations (mere 1000s of years) on a regional or global scale. (Depending on how deep hydrothermal circulations penetrate, that portion of heat transport may be locally quite variable, but it depends on some more steady supply of heat from below.) From the thermal conductivity and thermal gradients, a heat flux can be estimated. The average concentrations of major heat producing radioactive isotopes has been estimated in various rock types. Understanding of geophysics, geochemistry, plus data, yields an understanding of how those isotopes are likely distributed within the Earth; generally, they are concentrated in the crust (especially continental crust) relative to the mantle, and especially relative to the core. Mantle convection rates can be estimated from continental drift; there is also seismography and physics. Core convection (at least partly driven by latent heat of inner core growth, compositional variations formed by inner core growth, and cooling from above) is linked the the magnetic field. Possible long-term global cooling rates can be bracketed by evidence of past tectonic behavior and knowledge of heat sources (including tidal deformation). Etc, Etc, etc... PS while one point in space and time has only one measurable value of each of the electric field and the magnetic field, spatial variations can be analyzed mathematically (Fourier analysis) to find linearly superimposed components that have various wave vectors. Systems that resonant at different frequencies will detect different parts of the spectrum. Photons with different energies will be absorbed or emitted by associated energy transitions.
Prev 2560 2561 2562 2563 2564 2565 2566 2567 2568 2569 2570 2571 2572 2573 2574 2575 Next


