


 Arguments


Recent Comments
Prev 2597 2598 2599 2600 2601 2602 2603 2604 2605 2606 2607 2608 2609 2610 2611 2612 Next
Comments 130201 to 130250:
-
Mizimi at 23:29 PM on 4 February 2009What does CO2 lagging temperature mean?
"Or if mankind were to succumb while a denuded life on Earth went on without out us, that would be catastrophic, wouldn't it? " Not if you were one of the surviving life-forms!! -
Patrick 027 at 17:27 PM on 4 February 2009Volcanoes emit more CO2 than humans
"that you are up on geology" Well I guess that depends on what you mean by 'up on'. I have a good basic understanding of the rock cycle, plate tectonics, mantle convection, some stuff about the core, geochemistry, how material is processed so as to concentrate some materials in some places in some forms (repeated partial melting and freezing for igneous rocks), crystal lattices, the large scale of geologic history; I could draw a rough map of Pangea; am less clear on Rodinia, I've heard of Mazatzal (spelling?); I know detrital pyrite is an indicator of lack of oxygen; ... But no, there are certainly a lot of minerals (especially the rare ones) that I couldn't identify or have never heard of, I don't know every division of time, I don't know every minor fault, I don't know precisely where the line is drawn between active, dormant, and extinct; I have some more detailed knowledge about a few things, like Baraboo quartzite (it goes back ~ 1.8 billion years, has some association with the Penokean orogeny; color an indication of presence of atmospheric oxygen at the time). -
Patrick 027 at 15:59 PM on 4 February 2009Volcanoes emit more CO2 than humans
PS 160 follows 158, not comment 159 "This is why geologists make good climatologists." What "This"? - for comment 159 is essentially all about geology. Why not then assume that because I have a grasp of climatology, I might then know more about geology than you do - that would also potentially be erroneous. Yes a fault, volcano, etc., might be thought dead/extinct and later discovered to still be active or have potential for activity in the not too distant future, etc. But that doesn't mean that all new discoveries of potentially active faults had already been identified as faults, does it? An example of what I am aware of - The New Madrid seismic zone is a leftover of a failed rift - an aulacogen (aka Mississippi Embayment ?) - from around the time of the breakup of Pangea or around that time (I'm better at the generalities than the exact dates). A much older example of a failed rift underlies Lake Superior and is ~ a billion years old or so - at least roughly in the same temporal territory as the Grenville orogeny (might they be causally linked?). -
Patrick 027 at 15:48 PM on 4 February 2009Volcanoes emit more CO2 than humans
PS don't think too hard about it. All except J are just random sequences (I used a spreadsheet to make the text strings). (Not that there aren't such things as random trends.) The first few follow power laws; the last few have each level about half as likely as the next highest. Anyway, even with some correlation between tectonics and climate, one still has to show at least either that the correlation is robust (reoccurs with statistical significance) and/or that there is some reason to expect a predictable (as opposed to butterfly effects) causal relationship. At least that is met for short term volcanic aerosol cooling, for longer term geologic influences on atmospheric CO2 concentration, and changing geography (but a local land rise of 5 inches isn't generally significant as a regional or global climate cause). -
Quietman at 15:47 PM on 4 February 2009Volcanoes emit more CO2 than humans
Patrick I have been assuming that you are up on geology since you are studying climate. Your recent comments have indicated that I made a false assumption. I am sorry if I have confused you. On the antarctic: The penninsula of west antarctica sits on a subduction zone, that is the reason that the volcanos are active and mountain building is still occurring in that region. That is the southernmost extent of what they call "the ring of fire". The New Madrid area is a juncture of a fault line and a fracture zone. In each of these areas there is only one main fault but it has fractures running perpendicular and minor faults running parallel. The appalachian chain follows the main fault. It has many inactive volcanos all along it from Texas to Maine as proof. They are "discovering" old faults that were considered "dead" but they were simply not very active, and that activity has been increasing for about 25 to 30 years now all along that main fault. Another area of subduction is the northern edhe of Greenland and Arctic Canada. Again this area has only recently increased in activity. The subduction zones along Asia and Alaska have also increased activity, the recent volcanic activity is simply indicative of the tectonic activity. This is why geologists make good climatologists. -
Patrick 027 at 07:26 AM on 4 February 2009Volcanoes emit more CO2 than humans
A. -^^__A|__^||^^|^|__||A|_^-A^^^A-A|A-_^-^-_|^---_-A-|A^^_|A_A_^^^A-AA^^^_-_A-^-_||__--A-_^-^A_||-__^_--_|A-^^_|- B. A----A-|A-^|AA^--|A___-|^-A_|_||-|-|^-_^___-_A|_-^^A_-_^AAA_A|^A_^|A_^__-AA_A-__|A|A^^A^^A-_||___^^|__-A^AA^-A- C. _|_^^^AAA^_|-__-_|^A|----A^|^_|A-^__|___|_|___A^_AA|_---_-^|--_____A|_|^A--^|_-^A_|A-|-|-__A__A-_^A-_|^-|^^-^A_ D. __^__^-|^--_AA_^__A____^-||_^||__A__^-_--_-_^_-_-____|-_-||_-A__A__|__^__A^-____||-_|_A_|_____|-___A|-__^___^__ E. __^____^A____--_|-^--|__-__|A-|^-_|A__-||_A__-A^^-__|-|___|___|_---_^^__|A-^-A__-^-_-__A-_^____|___|__^|_______ F. ___^___--__|-_-_|__|____|___-_-|____|__^-____||_-__-_-|-_-__^____|_-____|_|___--__|-__^_^|^____|___|-_-_-|-_-_| G. --|-____-___-A-^__-|---_-__-_A____-_-__--A__---_-__|-|-_|-_A-|_|_|_-_^|_A--_-^^^_-_-_^___-__^--___|___|_|_|____ H. _____A_--A|__-_^-_-A_^_-_-___--_|_|__----|__--_^A-^---_-|-A____|__---___---__|^___^___|-_____A_-|_^_-|______^|_ I. -_-__--A|__|-_^^------__|-^-_---__-|__-|__-_|-_-____-_|_^-_-___|_|-__^___A___-||A-|-A_______^__^-__-_-^___A_|_^ J. _-_A|-_-|---_|^--__---^_---|-__-_A_-_|^-_A-__^-__|-^_-__-_||_^-_-|____-____-_--^|__|_--_--^__-__-|_--|^-A^A-|^A^ -
Patrick 027 at 05:57 AM on 4 February 2009Volcanoes emit more CO2 than humans
"The "new" fault is obviously not new, it just has become active again. I knew it was there, so obviously " Are you sure the fault you knew about is the specific one they described as recently discovered? I didn't get the impression from the article that there has been any recent activity at that specific fault (where I heard about it from a different source, my impression was that the bubbling liquefied sand was not an ongoing process but something that had happenned and left a mark in the geologic record, which helped identify the fault), which is near but not the same as the New Madrid fault, which I also already knew about. "So how can it be more than usual, as there is apparently no usual." Of course it is not constant, but as with climate and weather, there will be a general state of tectonic activity within which variations and events occur on smaller time scales. There does seem to me to be more tectonic activity right now than 10 years ago (but is that a false impression created by a very small data set? - in other words, this isn't something I've followed closely). Is this level unusual for the last 100 years? The last 1000? There was an earthquake in Portugal - I think during the little ice age, actually (but I'm not sure) - and it killed something like over 70,000 people. Which is a great tragedy, of course, but what does that imply in as far as tectonic trends or short term tectonic activity - climate relationships? Not much. When you picture the level of tectonic activity over time - let's say the last 1000 years - what do you picture: (_ low, , - medium, | high, ^ higher, A highest) (graphs coming soon) -
John Gault at 16:15 PM on 3 February 2009Is Antarctic ice melting or growing?
The earth's climate is a complicated enviornment. I find it hard to believe that one single issue, that of mankind off gassing co2 is the cause for all global warming, or now at least more widely known as climate change. Mankind cannot predict tomorrow' weather but mankind can predict climate change and it is all due to one minor atmospheric element like man-made CO2. That issue alone, is very hard to believe. Arguement #1 - The loss of the earth's magnetic field and the South Atlantic Anomoly - Per the National Geopgraphic Channel, the earth has lost over 5% of its magnetic power over the last 30 years. The loss in power also has with it magnetic anomolies. One area in particluar, is the South Atlantic Ocean. Here the magentic anomoly is so weak that cosmic rays aer channeled into the earth, heating the South Atlantic Ocean seveal degree. The earth's oceans are a big maker and cleaner of CO2. How much heat is being created here in the South Atlantic and is that causing higher CO2 off-gasing and higher temperature near the Antartic ice cap? Where are other magnetic anomolies onthe earth and what are then coucing with the air and water temperature as well a CO2 off-gassing? Aurguement #2 - Techtonic Plate Movement and the Earth's Climate - Per the Science Channel, a group of scientist are looking into the collision of the Indian Plate with the Asian Plate. During the last Ice Age some 10,000 years ago, this Ice Age was not a Global Ice Age, but only occured in North America. Why? Some scientists believe that the collision of the Indian and Asian Plates pushed up the Himilayin Mountians causing a shift in the jet stream that brought cold weather down on to the Northern Hemisphere. Is this going on now again? Look at the weather in the UK and Europe. Arguement #3 - Technoic Plate Movement - Again, per the National Geographics Channel, the entire Andes Mountian Rnage is growingin height some 6" every 100 years, I believe. This mountian range growth stops almost all weather from going over the Andes. Prior to 1200 AD there were no galciers in the Andes, Now we have them but they are also melting. Is the loss of the earths magnetic power related to Tectinoic Plate movement? Auguremetn #4 - Tecitnoic Plates cause fissures in the ocean,, which causes a rise in under water volcanos, water temperature and off-gassing. As North America moves away from Europe, more under water volcannos can be expected to be formed in the ocean and thus provie the world with higher water temperatures plus higher contents of co2 in the earth as ocean emperature around the islands rise due to volcanic vents under the main island. New under water volvanos have been recnetly found in Antartica and these have been flet to b a mjor cause of any antartic ice melt. I can go one, but I am very tired this night. John Gault -
Quietman at 15:08 PM on 3 February 2009Christmas cartoon on melting North Pole
chris RE: What lends you to come to that conclusion? The statements of AGW alarmists. -
Quietman at 10:52 AM on 3 February 2009Volcanoes emit more CO2 than humans
ps The "new" fault is obviously not new, it just has become active again. I knew it was there, so obviously they should know at LEAST what I was able to learn. It's a very sad state of affairs for the educational system in the U.S. -
Quietman at 10:49 AM on 3 February 2009Volcanoes emit more CO2 than humans
Patrick I am referring back to the articles posted above in this thread. Yes the activity increased in the late 1970s and has continued. That is exactly what all of the above links indicate. And what is usual? The realization that tectonic activity is not a constant is a recent realization (the article on this concerns mountain building in fits and spurts). So how can it be more than usual, as there is apparently no usual. -
Patrick 027 at 06:11 AM on 3 February 2009Volcanoes emit more CO2 than humans
"ps We are also looking at overall trends, over millions of years in addition to the current phase. It certainly does pertain. " To the subject of climate in general, but not so much to AGW specifically in as far as the causes of recent changes (last 100 years, especially last few decades) must be, outside of natural variability contributions, things which have recently changed and in so doing reached states unseen for some longer time. "What matters is current phase which is an active phase. This was noted in an article this past year " Which article? "Yes, those volcanos are active. And those are only the ones that are under the ice, not the ones on the ocean floor. It's a subduction zone. " But are they unusually active? The numbers just don't add up to explain much of recent climate changes, if even to suggest some significant multidecadal trend in tectonic activity. -
Lee Grable at 06:07 AM on 3 February 2009It hasn't warmed since 1998
Two out the three graphs show defenite tempurature rises. That always seems to be ignored by the deniers. -
Quietman at 04:45 AM on 3 February 2009Volcanoes emit more CO2 than humans
Patrick Here is a couple more new items of increased tectonic activity: New Fault Raises Threat of Eastern Earthquakes Yellowstone Earthquake Swarm Puzzles Scientists -
Quietman at 04:37 AM on 3 February 2009Volcanoes emit more CO2 than humans
ps We are also looking at overall trends, over millions of years in addition to the current phase. It certainly does pertain. -
Quietman at 04:34 AM on 3 February 2009Volcanoes emit more CO2 than humans
Patrick It has been determined that the earth does not work slowly but just like evolution, in fits and spurts, ie. it does not matter if it's a million years or a hundred years. What matters is current phase which is an active phase. This was noted in an article this past year (more new information not taken into account by the IPCC). Yes, those volcanos are active. And those are only the ones that are under the ice, not the ones on the ocean floor. It's a subduction zone. -
black2deep at 14:43 PM on 1 February 2009It's the sun
piszkace at 06:20 AM on 25 January, 2009 Back to the beggining please.- the article and first posts... Could someone explain, why is it so important to see a trend in the suns radiation? Isn't it enough to say that it stabely radiates more than it did a few centuries ago? You don't have to warm more and more to boil the water. It's enough to set your oven to a stable temrature.==========Answer. The graph would suggest that solar radation was stable. But if you have read the post I made which came right from the news media. Solar activity in the last ten years has risen. The reoport suggest a stable sun cycle. When all the evedence is to the contrary. The next question that would come to mine, is why would a false report be published that countered the suggested cause of global warming as solar related. I am open to all arguments but in the face of such evidence you can understand why I would become skeptical. Tom R. -
Mizimi at 02:12 AM on 1 February 2009It's aerosols
Which aerosols are you referring to? Man-made presumably? Aerosols are also produced by the biosphere and the atmospheric concentrations vary considerably. For example, many plant species produce aromatic oils (terpenes) which generally persist for a few minutes to a couple of days. Species include pines,eucalypts, beech,citrus, as well as the 'herbs'... rosemary, thyme, sage etc. These oils degrade in the atmosphere and form aerosols. A recent study indicates that plant aerosols can affect cloud cover : "The team found the terpenes react in the air to form tiny particles called aerosols. The particles help turn water vapour in the atmosphere into clouds. Spracklen said the team's computer models showed that the pine particles doubled the thickness of clouds some 1,000m above the forests, and would reflect an extra 5% sunlight back into space. He said: "It might not sound a lot, but that is quite a strong cooling effect. The climate is such a finely balanced system that we think this effect is large enough to reduce temperatures over quite large areas. It gives us another reason to preserve forests." The research, which will be published in a special edition of the Royal Society journal Philosophical Transactions A, is the first to quantify the cooling effect of the released chemicals. The scientists say the findings "must be included in climate models in order to make realistic predictions". Because trees release more terpenes in warmer weather, the discovery suggests that forests could act as a negative feedback on climate, to dampen future temperature rise. The team looked at forests of mainly pine and spruce trees, but Spracklen said other trees also produce terpenes so the cooling effect should be found in other regions, including tropical rainforests." http://www.guardian.co.uk/environment/2008/oct/31/forests-climatechange -
Mizimi at 01:46 AM on 1 February 2009Water vapor is the most powerful greenhouse gas
According to http://wattsupwiththat.com/2008/06/21/a-window-on-water-vapor-and-planetary-temperature-part-2/ and http://landshape.org/enm/greenhouse-thermodynamics-and-water-vapor/ atmospheric WV appears to be decreasing at the height where GCM's predict it should increase. -
Patrick 027 at 17:53 PM on 31 January 2009Arctic sea ice melt - natural or man-made?
More on Rossby Waves coming soon... -
Patrick 027 at 12:07 PM on 30 January 2009Volcanoes emit more CO2 than humans
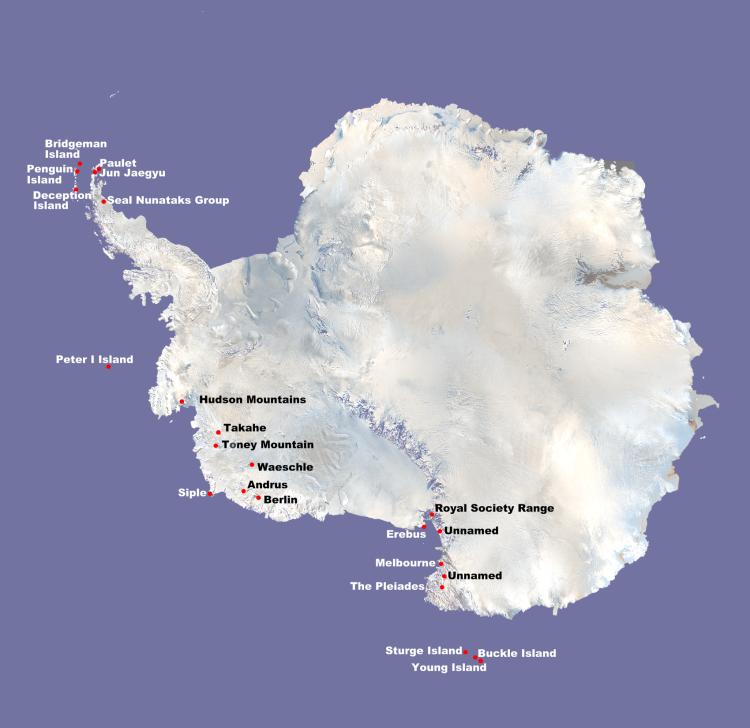
http://icecap.us/images/uploads/AntarcticVolcanoes2.jpg Nice map. Are these all active right now? When was the last time they were active? Is the activity unusual for the last 1000+ years? "Geophysicists Show That Crust Temperature Variation Explains Half Of Elevation Differences In North America" Yes, that's interesting. If we were discussing changes over millions of years, it could potentially pertain. -
thewags at 05:41 AM on 30 January 2009It hasn't warmed since 1998
A few points: 1. I am intrigued by the slant, depending on the POV. Ie, if the temp is trending up, it is the result of manmade causes. However, a cold year (2008) is the result of natural causes (La Nina). Hmmm... 2. I'd be interested to see the variation in measuring points over the years, to confirm or reject the notion that some of the warming is due to the removal of Siberian monitoring stations after the USSR disintegration. 3. Looking at the charts for the last 10 or so years, it seems the warming is mostly concentrated in the far northern hemisphere. Would be interesting to see how that is explained. -
Quietman at 15:34 PM on 29 January 2009Volcanoes emit more CO2 than humans
This is where the volcanos are active in Antarctica Funny coincidence? -
Quietman at 15:31 PM on 29 January 2009Is Antarctic ice melting or growing?
Phillipe Yes, about that. -
Quietman at 15:27 PM on 29 January 2009Volcanoes emit more CO2 than humans
Patrick Re: 147 Fairbridge and his idea of Jupiter and other planets affecting the Barycenter, effecting solar activity, affecting climate. ps Remeber we discussed water levels before? I found this article (don't know how I missed it). World On Water "Geophysicists Show That Crust Temperature Variation Explains Half Of Elevation Differences In North America" February 1, 2008 — Geophysicists determined that tectonic mountain-building processes are not the only factor that determines elevation in North America. The temperature of the crust affects its density, and lower density crust will rise higher than colder, higher density crust. The heat in question comes from the Earthýs interior and also radioactive decay of various elements in the crust. Broadly, the Rocky Mountain region of the United States has the hottest crust, as well as the highest general elevation. Interesting no? -
Patrick 027 at 11:52 AM on 29 January 2009Volcanoes emit more CO2 than humans
"You see "planetary gravitational attractions" are an addition, referring to what I am talking about and not part of the Milankovitch cycle theory. " Those gravitational attractions are responsible for the Milanovitch cycles - precession of tilt and perihelion advance, changes in tilt, changes in eccentricity of orbit; also, changes in the plane of the ecliptic, though whether that has any significance climatologically is ... ? - but that's still a 70,000 year cycle. None of these cycles is shorter than ~ 20,000 years. If shorter-term astronomical cycles were meant to be implied to 1. exist (of course some do - but are there more than either of us is familiar with? The Chandler wobble (~over 400 days, no significant climatological consequence), cycles in the moon's orbit (perigee advance? (~between 8 and 9 years), precession of nodes (precession of tilt of the orbital plane relative to Earth's orbital plane) ~ between 18 and 19 years, some other shorter cycle(s) - these and consequent alignments with Earth-sun orbital geometry (including) perhelion/perigee alignment; solar cycles (of course they affect climate, but seem to only account for some fraction of recent warming, not-so-large a fraction especially in more recent decades) ... Of course, the Milankovitch cycles result from tidal torques on the Earth's equatorial bulge (mostly from the moon and sun) and tides acting on the Earth's orbit (the difference in the gravitational acceleration due to other planets acting on the Earth-moon system relative to the sun) - with some relativistic contributions, about which I don't know much. These are cummulative effects, I think, considering that the tidal torque on the equatorial bulge must go through semimonthly (no torque from moon when aligned with equatorial plane, which it crosses roughly twice in a full orbit) and semiannual cycles (no torque due to sun at equinoxes). There are obviously cycles in the alignments of the planets, and modulated by relative positions of perihelions and ascending nodes (the ascending node is where an object's orbit crosses a reference plane from south to north - typically the reference plane for planets is the ecliptic - approx. the plane of the Earth's orbit. One might also use the "invariable plane" of the solar system - the total angular momentum vector of the whole solar system is perpendicular to this plane). Anyway, Milankovitch cycles, I think, result over time as cummulative effects from forces that are also cycled over time over shorter periods. Are there significant cycling displacements in such things as tilt (magnitude and/or direction) and Earth-sun distance that occur in shorter time periods (that don't average to near zero over just a few years but can be set aside over thousands of years leaving the Milankovitch cycles)? If there were, I would have expected to here more about it in an article where "planetary gravitational attractions" were being highlighted. The impression I've gotten is that these short-term pulsations are small relative to the trend over 1000s of years. That is, using snow-depth as an analogy to tilt, eccentricity, etc, the impression I've gotten is that we get to ~ 1000 inches over 1000s of years by many small flurries that occur every month or so, a few bigger than the rest, but without much melt in between - as opposed to massive snowstorms followed by heatwaves. -
Quietman at 08:08 AM on 28 January 2009Volcanoes emit more CO2 than humans
Re: "Spencer also tried to explain most of recent global average surface temperature trends in terms of the PDO and ENSO," Yes, but he does not get into the cause of the PDO or ENSO as I have (granted it's only my hypothesis, it does lend support to it). -
Quietman at 08:05 AM on 28 January 2009Volcanoes emit more CO2 than humans
Patrick "Re 142: Where in the article did you see something besides Milankovitch cycles?" Here: "According to Michael E. Wysession, Ph.D., associate professor of earth and planetary sciences in Arts & Sciences at Washington University in St. Louis, parameters such as planetary gravitational attractions," You see "planetary gravitational attractions" are an addition, referring to what I am talking about and not part of the Milankovitch cycle theory. -
Quietman at 07:59 AM on 28 January 2009Al Gore got it wrong
The following is quoted from How the world was bullied into silence ************* Even those directly involved in the process have joined the shift as the extremist positions grow. Meteorologist Hajo Smit of Holland, and former member of the Dutch UN IPCC committee became a skeptic because of Al Gore.. “Gore prompted me to start delving into the science again and I quickly found myself solidly in the skeptic camp…Climate models can at best be useful for explaining climate changes after the fact.” The function of extremism is to determine limits for the majority. Gore’s extremism provided Mr.Smit with a limit. Cold weather is providing another limit. It is driving proponents of human caused global warming to increasingly extreme positions. This, in turn, is encouraging even those who should have spoken out to take positions. The bullying is over and the bullies are in a panic. ************* IMO Gore has had this effect on many of us. -
NewYorkJ at 13:14 PM on 27 January 2009There is no consensus
Correction on #125: 2.97 should be 2.94 -
NewYorkJ at 12:08 PM on 27 January 2009There is no consensus
Back on topic... Published in EOS: http://tigger.uic.edu/~pdoran/012009_Doran_final.pdf Note this isn't a dubious petition or an Inhofe propaganda press release. It's a scientific peer-reviewed study that compares the view of the public with the view of the scientific community on the issue of global warming and the significant human contribution. Details: Among the general public, views are mixed, with about a 57%-38% (Gallup poll) agreement with the significant human contribution. I've seen other surveys with less agreement (particularly among polls conducted during cold winter weather). We see that sort of vehement denial among the blogosphere and various media outlets. This gives the public the false impression that there's a raging debate among scientists on the core issue, creating further doubt. Among scientists, there's very little doubt. The study's authors breaks it down. Among non-climate scientists and non-publishers, there's a 77%-8% (nearly 10 to 1) agreement (the remaining 15% unsure). 8% is pretty small considering the political implications of the topic. This consensus increases among active published scientists to 89%-3%. Among active climate scientists, it's about 97%-1%. The greatest doubt is held by petroleum geologists (what a surprise). Thus, what follows is the key conclusion: "It seems that the debate on the authenticity of global warming and the role played by human activity is largely nonexistent among those who understand the nuances and scientific basis of long- term climate processes. The challenge, rather, appears to be how to effectively communicate this fact to policy makers and to a public that continues to mistakenly perceive debate among scientists." -
NewYorkJ at 12:03 PM on 27 January 2009There is no consensus
Re: 116 Actually, if you read the link: http://www.sciencemag.org/cgi/content/summary/297/5585/1287 You'd note the conclusion: "Today's comparatively warm climate has been the exception more than the rule during the last 500,000 years or more. If recent warm periods (or interglacials) are a guide, then we may soon slip into another glacial period. But Berger and Loutre argue in their Perspective that with or without human perturbations, the current warm climate may last another 50,000 years. The reason is a minimum in the eccentricity of Earth's orbit around the Sun. " Ice age cooling, according to this study, won't even begin for tens of thousands of years. But lets say major cooling has already begun. Note how long it takes to reach glaciation. Let's assume it will happen more quickly than recent studies suggest - say 10,000 years. We can expected roughly 6 degrees C of cooling or approximately 0.06 per century. Since global warming is expected to very conservatively warm the Earth about 3 degrees this century on a business-as-usual path (some estimates are much higher), we could count on 2.97 degrees of net warming. Re: 124 Some great minds went against the mainstream many decades ago to propose the hypothesis that human activities would warm the Earth. They were right. Of course, if you examine the quality of minds (measured by the quality of their arguments), that are currently opposing the consensus, you might note that for every theory successfully challenged, there are hundreds that have failed. Failed challenges are often the result of unobjective agendas. -
Mizimi at 22:24 PM on 26 January 2009It's the sun
#238 Since the 1970's, there has been a calculated rise in the GMT of around 0.5C most of which is attributed to the effects of man enhancing atmospheric CO2 levels by burning fossil fuels. In order to counter this argument sceptics advance other arguments such as in this thread - namely that the sun is more active and that will cause an increase in solar radiation and thus warm the earth. So it is then necessary to see if such is the case. If there is no apparent rising trend in solar radiation this would negate the sceptics argument. However, like most complicated processes, it isn't always that easy. There are other factors which influence the amount of SR we receive, such as orbital fluctuations (Milankovitch cycles), internal processes in the sun that we 'see' as sunspot activity and the hypothesis of Rhodes Fairbridge ( the Fairbridge 'Curve') etc. Taking a single effect in isolation is an approach adopted by both sides and is counter-productive to a full understanding of the process. -
Patrick 027 at 12:32 PM on 26 January 2009Volcanoes emit more CO2 than humans
Re 143: 1. In the work of Spencer we had been discussing, he was using observations over short time periods - not long term climate trends - to attempt to infer the magnitude of climate sensitivity. Some portion of that short term variation occurs in under a year. Because of asymmetries between the hemispheres and also that fall and spring are not just the averages of winter and summer, etc, there will be some annual cycles in some global averages, which result from external forcing but of course involve feedbacks. Spencer also tried to explain most of recent global average surface temperature trends in terms of the PDO and ENSO, I think (it was a strain to do so - in other words, Occam's razor selects against this explanation). There may be an irony there - what positive feedbacks are available to boost internal variability while leaving external forcing so impotent? Of course, there are different spatial-temporal structures in different feedbacks to different things, etc... 2. The 30 year limitation - what limitation, exactly? The satellite data and some other data may only go back to x, but where it agrees with other data we might gain confidence in other data sets going back further; also we have paleoclimate and paleoclimate forcing records, and physics and modeling to fill in some of the blanks. Re 142: Where in the article did you see something besides Milankovitch cycles? -
TallDave2 at 04:19 AM on 26 January 2009Satellites show no warming in the troposphere
OK, now extend the GISS/UAH comparison to 2008, and try to tell me we're recording more tropospheric warming than surface warming. http://wattsupwiththat.com/2009/01/18/giss-divergence-with-satellite-temperatures-since-the-start-of-2003/ -
TallDave2 at 03:54 AM on 26 January 2009CO2 lags temperature
Re: "The economic argument that carbon taxes will damage the US economy is bogus." This is an unknown. It could go either way depending on exactly who is taxed and how much as well as who is hired and how many. No, it's not unknown, it's definitely negative. See "broken windows fallacy." http://en.wikipedia.org/wiki/Broken_windows_fallacy At best, reducing CO2 is an external good that could have benefits 100 years from now (but won't because nothing short of nuclear will stop the growth of emissions in China, INdia, and Africa). At worst it's like paying one guy to dig a hole and another to fill it in. -
chris at 10:08 AM on 25 January 2009Christmas cartoon on melting North Pole
What a strange notion Quietman. What lends you to come to that conclusion? Any non-greenhouse contributions to climate/weather variations always apply whether or not the greenhouse effect is augmented, reduced or stays the same. -
Quietman at 06:43 AM on 25 January 2009Volcanoes emit more CO2 than humans
Re: "It also occurs to me that Spencer's analysis could be capturing some aspect of the annual cycle." Climate is the average of annual cycles over a given time period. The 30 year limitation currently used skews the results. -
Quietman at 06:40 AM on 25 January 2009Volcanoes emit more CO2 than humans
Re: "That's just the Milankovitch cycles." Not Quite. It's a better understanding of various cycles, not just Milankovitch. -
Quietman at 06:35 AM on 25 January 2009Christmas cartoon on melting North Pole
chris So you expect me to believe that there are no climate cycles, no medieval warm period, no little ice age, no 60 year PDO cycle, no ENSO, no AMO, no changes in the earths orbit or axial tilt, no changes in the suns effect or the planets effect on the sun and no volcanic or tectonic activity on this planet? -
piszkace at 06:20 AM on 25 January 2009It's the sun
Back to the beggining please.- the article and first posts... Could someone explain, why is it so important to see a trend in the suns radiation? Isn't it enough to say that it stabely radiates more than it did a few centuries ago? You don't have to warm more and more to boil the water. It's enough to set your oven to a stable temrature. -
Patriot Vet at 06:14 AM on 24 January 2009Human CO2 is a tiny % of CO2 emissions
chris, You say: "And if one considers the 10 million years before the 20th century, the atmospheric CO2 seems to have been pretty much near equilibrium." It appears that you are not up to date on the IPCC science. It has been higher in the past couple of million years. Chapter 6 Palaeoclimate http://www.ipcc.ch/pdf/assessment-report/ar4/wg1/ar4-wg1-chapter6.pdf "6.3.1 What is the Relationship Between Carbon Dioxide and Temperature in this Time Period? Pre-Quaternary climates prior to 2.6 Ma (e.g., Figure 6.1)were mostly warmer than today and associated with higher CO2 levels." http://www.ipcc.ch/graphics/graphics/ar4-wg1/jpg/fig-6-1.jpg It seems as though you have your facts wrong. -
Mizimi at 05:06 AM on 24 January 2009Latest satellite data on Greenland mass change
Maybe strike the 'temporary' #15 there is no mass loss but a change in volume as water is denser than ice. -
Mizimi at 05:02 AM on 24 January 2009Latest satellite data on Greenland mass change
Abject apologies to all....I plead a)temporary insanity b)Failing eyesight -
Patriot Vet at 04:55 AM on 24 January 2009Human CO2 is a tiny % of CO2 emissions
chris, You say: "And if one considers the 10 million years before the 20th century, the atmospheric CO2 seems to have been pretty much near equilibrium." It appears that you are not up to date on the IPCC science. It has been higher in the past couple of million years. Chapter 6 Palaeoclimate http://www.ipcc.ch/pdf/assessment-report/ar4/wg1/ar4-wg1-chapter6.pdf "6.3.1 What is the Relationship Between Carbon Dioxide and Temperature in this Time Period? Pre-Quaternary climates prior to 2.6 Ma (e.g., Figure 6.1)were mostly warmer than today and associated with higher CO2 levels." http://www.ipcc.ch/graphics/graphics/ar4-wg1/jpg/fig-6-1.jpg It seems as though you have your facts wrong. -
black2deep at 02:32 AM on 24 January 2009It's the sun
Just so you don't think I am making this up. http://www.mobilemag.com/content/100/344/C2179/ March 13, 1989 - The Quebec Blackout Storm - Astronomers were busily tracking "Active Region 5395" on the Sun when suddenly it disgorged a massive cloud of superheated gas on March 10, 1989. Three days later, and seemingly unrelated to the solar paroxicism, people around the world saw a spectacular Northern Lights display. Most newspapers that reported this event considered the spectacular aurora to be the most newsworthy aspect of the storm. Seen as far south as Florida and Cuba, the vast majority of people in the Northern Hemisphere had never seen such a spectacle in recent memory. At 2:45 AM on March 13, electrical ground currents created by the magnetic storm found their way into the power grid of the Hydro-Quebec Power Authority. Giant capacitors tried to regulate these currents but failed within a few seconds as automatic protective systems took them off-line one by one. Suddenly, the entire 9,500 megawatt output from Hydro-Quebec's La Grande Hydroelectric Complex found itself without proper regulation. Power swings tripped the supply lines from the 2000 megawatt Churchill Falls generation complex, and 18 seconds later, the entire Quebec power grid collapsed. Six million people were affected as they woke to find no electricity to see them through a cold Quebec wintry night. People were trapped in darkened office buildings and elevators, stumbling around to find their way out. Traffic lights stopped working, Engineers from the major North American power companies were worried too. Some would later conclude that this could easily have been a $6 billion catastrophe affecting most US East Coast cities. All that prevented the cascade from affecting the United States were a few dozen capacitors on the Allegheny Network. [Newspaper Archive] June 6, 1991 - Severe sun storm threatens utilities [New York Times, June 6, 1991, p. A16]. July 15, 2001 - The Bastille Day Storm - Solar flare threatens the earth with storm [New York Times, July 16, 2001 p. 21]. Minor damage reported from geomagnetic storm [New York Times, July 17, 2001 p. A17] October 29, 2003 - The Halloween Storm - This Halloween Storm spawned auroras that were seen over most of North America. Extensive satellite problems were reported, including the loss of the $450 million Midori-2 research satellite. Highly publicized in the news media. A huge solar storm has impacted the Earth, just over 19 hours after leaving the sun. This is one of the fastest solar storm in historic times, only beaten by the perfect solar storm in 1859 which spent an estimated 17 hours in transit. A few days later on November 4, 2003 one of the most powerful x-ray flares ever detected, swamped the sensors of dozens of satellites, causing satellite operations anomalies….but no aurora. Originally classified as an X28 flare, it was upgrade to X34 a month later. In all of its fury, it never became a white light flare such as the one observed by Carrington in 1859. Astronauts hid deep within the body of the International Space Station, but still reported radiation effects and ocular 'shooting stars'. http://www.foxnews.com/story/0,2933,236333,00.html The biggest solar flare in decades has put satellite operators battening down the hatches in preparation for a severe geomagnetic storm on Wednesday. The eruption is the latest event in a week of intense solar activity. The activity is highly unusual because the 11-year sunspot cycle peaked in 2000. The latest flare erupted from a large sunspot at 1154 GMT on Tuesday. It was the first in the latest bout of turbulence to launch its charged particles directly toward the Earth. "This is the strongest flare we've seen in the past 30 years," said Leon Golub, an astrophysicist at the Harvard Smithsonian Center for Astrophysics. The website spaceweather.com lists it as third highest ever recorded in X-ray flux. Late on Tuesday, the US National Oceanic and Atmospheric Administration predicted a severe geomagnetic storm would follow, with intervals of extreme intensity possible. The agency warned of possible disruptions to satellite operation, electric power systems and failures of high-frequency radio communications and satellite navigation systems. Celestial fireworks The main mass of charged particles should hit the Earth's magnetosphere about 30 hours after the flare, about 1800 GMT on Wednesday. Celestial fireworks in the form of aurora will follow as the energetic particles interact with the Earth's magnetic field. Impressive auroras are likely at latitudes much lower than normal. The fluctuations caused in the magnetic field affect electronic systems and power grids by inducing currents in conductors. The severity of the storm and its impacts on electronic equipment will depend on the orientation of the magnetic fields in the ejected particles, relative to the Earth's magnetic field. If the particles' fields oppose the Earth's, the interaction will be extremely intense. But a parallel direction will reduce the impact. Present instruments cannot measure that orientation until the particles hit. The possible effect on electric power grids is a significant concern after this year's major blackouts in the US and Italy. Geomagnetic storms can induce voltage fluctuations that destabilise vulnerable power grids. Tuesday's flare is larger than the 1989 storm that knocked out the Quebec power grid. Shut down The influx of particles can also build up potentially damaging charge levels on satellite surfaces, and disrupt operation of their navigation, orientation and sensor systems. Worried satellite operators begun shutting down instruments to protect them from overloads on Tuesday. "Geosynchronous communications satellites are likely to be affected," warned John Kohl, a solar astrophysicist at Harvard-Smithsonian, who shut down his own ultraviolet experiment on the Solar and Heliospheric Observatory (SOHO) soon after learning of the flare. Disruption of navigation and communications satellites could hamper crews fighting wildfires in southern California, where the fires have destroyed cell phone towers and smoke obstructs visual navigation. But astronauts on the International Space Station are expected to weather the storm safely, and the atmosphere will shield people on the ground from potentially harmful radiation. BUt our chart makers would have us believe that solar flair activity has actually fallen. I suppose they don't think we listen to the news or pay attention so it is easy to slip one over on us and basicly LIE! Okay they don't lie, they just bend the truth to fit thier needs. -
black2deep at 02:03 AM on 24 January 2009It's the sun
Okay I am in radio, and solar flair activity over the last 10 years has been horrible. Just two years ago the news was reporting unusually high solar flair activity. Numerous articles were published about the sun spot cycle being totally confusing and overly active. But the chart says that solar flair activity is down? So? Anyone want to tell me just who it blowing what kind of smoke and where? If you really want to find out about solar flair activity and its rise in the last ten or so years then go to the source. http://www.nso.edu/ This is the national solar observatory in Sun Spot New Mexico. They are the last word in the suns activity. I can make a chart and with a little credablity I can sell it to you. Does it make it ture? No it doesn't, but what it does do is negate the argument and cloude the facts. -
Philippe Chantreau at 15:39 PM on 23 January 2009Climate change on Mars
Olympus Mons, I did some of your work for you: http://www.uapress.arizona.edu/onlinebks/mars/chap04.htm Excerpt:"Seasons are of unequal length. Mars is closest to the Sun in southern summer/ northern winter, and furthest in southern winter/northern summer. The southern hemisphere has shorter, warmer summers and longer, colder winters. During southern summer, dust storms often circle the entire planet." Which brings us back to this article: http://www.nature.com/nature/journal/v446/n7136/abs/nature05718.html Outstanding pics on this presentation: http://cpt.phys.utk.edu/~th/Astro151/Lecture12.pdf More info here: http://www.msss.com/http/ps/seasons/seasons.html. http://www.uapress.arizona.edu/onlinebks/mars/chap04.htm http://www.sciencemag.org/cgi/content/abstract/228/4704/1160 http://www.sciencemag.org/cgi/content/abstract/228/4704/1160 http://www.sciencemag.org/cgi/content/abstract/228/4704/1160 -
Philippe Chantreau at 15:14 PM on 23 January 2009Is Antarctic ice melting or growing?
RC has a new interesting thread about Antarctica: http://www.realclimate.org/index.php/archives/2009/01/state-of-antarctica-red-or-blue/langswitch_lang/th The Nature article is here: http://www.nature.com/nature/journal/v457/n7228/full/nature07669.html -
Patrick 027 at 15:10 PM on 23 January 2009Volcanoes emit more CO2 than humans
"Earth's Orbit Creates More Than A Leap Year: Orbital Behaviors Also Drive Climate Changes, Ice Ages ScienceDaily (Feb. 18, 2008)" http://www.sciencedaily.com/releases/2008/02/080213113037.htm That's just the Milankovitch cycles. It's basic grade-school science. Nothing new here. "There is an apparent agreement with Fairbridge" Well, according to "Article" from comment 139, Fairbridge was an early supporter of the Milankovitch cycle-driven climate changes concept. But that doesn't do anything to bolster his other concepts about solar jerk and sizable sudden sea level changes in the later Holocene. Also, "Article" did imply that the Fairbridge curve had been accepted in some way, but I don't buy that in full. Of course I wouldn't be surprised if sea level changes have some irregularity or even smaller cycles in them; there's no rule about having to rise completely monotonically (never reversing) between the peak of the last ice age and the present. But that's different then accepting the Fairbridge curve.
Prev 2597 2598 2599 2600 2601 2602 2603 2604 2605 2606 2607 2608 2609 2610 2611 2612 Next


