


 Arguments


Recent Comments
Prev 289 290 291 292 293 294 295 296 297 298 299 300 301 302 303 304 Next
Comments 14801 to 14850:
-
Alchemyst at 10:23 AM on 1 April 2018Study: wind and solar can power most of the United States
"Your claims at 15 are also false. You have provided no references to support your wild claims. It is sloganeering to make unsupported claims. The moderators wil start to delete your posts if you continue to refuse to support your wild claims."
before I go on please state exacly which claims that a wrong in para 15.
It is extrememly difficult to understand what you are against,
Please elucidate, thank you
-
NorrisM at 09:47 AM on 1 April 2018Sea level rise predictions are exaggerated
Bob Loblaw, Eclectic and michael sweet,
This has been an interesting journey, exploring what I will describe as the “conflicting views” on the future sea level rise “predicted” for the remainder of the 21st century. Let me say that I appreciate that my use of the term “predict” is used in a general sense and that many of what I refer to as “predictions” are in fact “projections” because they are predictions based upon certain assumptions relating to a number of things but most importantly, the level of CO2 emissions based upon the various pathways assumed by the IPCC.
The relevance of the views of a lawyer are on such a technical subject as “sea level rise” is certainly questionable but I suspect the interest of Bob Loblaw is simply because there are a number of legal cases that will be coming before the courts of the United States over the next few years and these cases will be adjudicated by lawyers and not physicists or other scientists. Having said that, there are many lawyers who have an engineering or scientific background before entering law so there may be some hope of having a scientist hear the case. In my case, my undergraduate degree was in the “dismal science”.
In researching this topic, I have largely focused on Chapter 13 of the IPCC Fifth Assessment (Fifth Assessment) and those portions of Chapter 3 dealing with sea level rise as well as blog information contained on this website on the subject as well as blog information on one other website (which does not carry much weight from most of the commentators on this website). I have also read the US Climate Science Special Report published in late 2017 (US Climate Report) as well as the very good RealClimate article on the Fifth Assessment (suggested by Bob Loblaw).
But before I delve into my impressions from these sources, I would also like to reference the discussion of “uncertainty” both in the Fifth Assessment and the US Climate Report. In both reports, the extent of understanding (and certainty or uncertainty about that understanding) is based upon levels of confidence (dealing with the consistency of the evidence and degree of agreement within the literature) and likelihood expressed probabilistically (based upon the degree of understanding or knowledge).
What I want to focus on are the levels of “Confidence”:
“Medium Confidence” means suggestive evidence (a few sources, limited consistency), competing schools of thought.
“High Confidence” means moderate evidence (some sources, some consistency) medium consensus
“Very High Confidence” means strong evidence (established theory, multiple sources) high consensus.
All of the definitions for uncertainty are found in the US Climate Report in the “Guide to this Report” which is easily located.
I think it is very important to keep these measurements in mind when analyzing the findings of the Fifth Assessment. When they use “Medium Confidence” they do not mean “medium consensus” because that term is reserved for “High Confidence”. Unless the term “Very High Confidence” is used then there is considerable uncertainty remaining.
So to commence this research the most logical place to begin is the Fifth Assessment projections found at Section 3.7.6:
"It is very likely that the global mean rate was 1.7 [1.5 to 1.9] mm yr–1 between 1901 and 2010 for a total sea level rise of 0.19 [0.17 to 0.21] m. Between 1993 and 2010, the rate was very likely higher at 3.2 [2.8 to 3.6] mm yr–1; similarly high rates likely occurred between 1920 and 1950."
Figure 3.14 of the Fifth Assessment shows the “bump” in sea level rates in the period 1920 to 1950. Given that the accepted view is that the rapid increase in the use of GWG’s only started after 1950, it seems incumbent on scientists to explain the “bump”. The only explanation I could find in the Fifth Assessment was that this “bump” was ”likely related to multi-decadal variability”. See Section 3.7.4. However, the natural question is if “multi-decadal variability” caused the increase in rates in the 1920-1950 period then why cannot the increase in rates found since 1993 of approximately 3.2 mm/yr also be attributed to multi-decadal variability? Or should not at least a portion be attributed to this internal variability, if only a portion, then how much?
So the Fifth Assessment found that it was “very likely” (read 90-100%) that the average rate of sea level rise since 1901 was 1.7 mm/yr. But before we get into the 3.2 mm/yr rate, we now have a number of papers since the Fifth Assessment that have suggested that the Fifth Assessment’s 90-100% assured estimate is all wrong and the real rate for 1901 to 1990 is 1.1 to 1.2 mm/yr. (Hay 2015 Dangendorf 2017). When asked by others how the IPCC could have got this so wrong, the answer seems to be that everyone is entitled to be wrong, that is science. I fully agree but it does not necessarily engender confidence in other “Very Likely” predictions or projections of the IPCC in the Fifth Assessment.
Perhaps the IPCC will, in the Sixth Assessment actually maintain its 1.7 mm/yr rate which I understand was similar to the AR4. Why do I say this? Because my understanding is that these “new” lower estimates are largely based upon a reanalysis of VLM. But here is what the Fifth Assessment has to say about VLM adjustments:
"High agreement between studies with and without corrections for vertical land motion suggests that it is very unlikely that estimates of the global average rate of sea level change are significantly biased owing to vertical land motion that has been unaccounted for. {3.7.2, 3.7.3, Table 3.1, Figures 3.12, 3.13, 3.14}"
So now on to the $64,000 question as to whether the observed acceleration in sea level rise since 1993 is an increase in the long term rate or is reflective of decadal variability or only reflects “apples and oranges” measurement issues with satellite altimetry compared to tide gauges.
We have disagreements both on the rate of acceleration and the causes of the acceleration.
Firstly, we have a disagreement between the Fifth Assessment estimates of what the acceleration rate is and the recent Nerem 2018 paper. From the Fifth Assessment, the acceleration is quite small with Ray & Douglas (2011) at -.002 to .002 mm/y, Jeverejeva (2008) at .012 mm/yr and Church & White (2011) at .012 mm/yr. Then we have Nerem (2018) re-evaluating things and coming up with .084 mm/yr. I do not propose to get into the technical disagreements that I have read on the Nerem (2018) paper but even extrapolating his acceleration, his projected 2100 sea level rise is somewhere around 65 cm close to the low range of the IPCC RCP8.5 estimate. Although I am not qualified to make any judgments, I suggest that anyone who is qualified should at least read the comments made by FrankClimate on the other website under the Part IV discussion on sea level acceleration. Without question, FrankClimate is technical. His comments have now been incorporated into the Part IV discussion. Would be interested to hear from Eclectic as to whether he disagrees with FrankClimate.
Secondly, we have questions of what is the cause of this recent acceleration since 1993. I had to ask myself why 1993 and not 1990? The obvious answer is that it is in 1993 that satellite altimetry came into the equation with the launch of the TOPEX satellite. Although I think there is general agreement that there are serious questions about whether the data from TOPEX for the first six years should be used at all (or for that matter even the remaining period for that satellite), my sense from looking at the NASA website is that the satellite altimetry is pretty well matching the tide gauges. I think there are a number of people who disagree with me on this but the average rates seem to match. But it is curious that where we see this very large increase in SLR is not at the land-based tide gauges but out in the middle of the oceans. It at least led me to ask myself whether this significant difference between the tide gauge measurements and satellite altimetry measurements in the middle of the oceans would have always been there if we could have measure it with satellites much earlier. I fully appreciate that the tide gauge measurements have shown an upward trend since 1980 (Section 3.7.4) but my understanding is that the large average increase during the satellite era can be attributed to the large increases found in the middle of some of the oceans, especially the Indian Ocean.
But back to attribution. A number of authors have suggested that the way to reconcile the “bump” in 1920-1950 and the increases since 1990 is to link these climate changes to multi-decadal variability, and specifically the AMO or the PDO. Here is what the Fifth Assessment has to say about this at 3.7.4:
"Several studies have suggested these variations may be linked to climate fluctuations like the Atlantic Multi-decadal Oscillation (AMO) and/or Pacific Decadal Oscillation (PDO, Box 2.5) (Holgate, 2007; Jevrejeva et al., 2008; Chambers et al., 2012), but these results are not conclusive."
Others have said that the increase in SLR since 1990 is not “statistically relevant” when looking at the long term sea level rise. In that respect, the Fifth Assessment does make the following statement immediately following the above quotation:
"While technically correct that these multi-decadal changes represent acceleration/deceleration of sea level, they should not be interpreted as change in the longer-term rate of sea level rise, as a time series longer than the variability is required to detect those trends."
For those who say that the acceleration should be attributed to AGW, they largely point to the increased rates of melting in the glaciers and the Greenland ice sheet and potentially catastrophic impacts relating to the West Antarctic Ice Sheet (WAIS). I cannot obviously get into discussing these topics without clearly being “snipped” for too long a post. In my view, having read the Fifth Assessment, the risk of “dynamic changes” in WAIS (there is virtually no risk with the topography of Greenland bedrock) are minimal. Here is what the Fifth Assessment has to say about the MISI hypothesis relating to WAIS at 13.4.4.3:
"In summary, ice-dynamics theory, numerical simulations, and paleo records indicate that the existence of a marine-ice sheet instability associated with abrupt and irreversible ice loss from the Antarctic ice sheet is possible in response to climate forcing. However, theoretical considerations, current observations, numerical models, and paleo records currently do not allow a quantification of the timing of the onset of such an instability or of the magnitude of its multi-century contribution."
As to the evidence of a retreat of WAIS, see Chapter 13 at 13.5.4.1:
"Although the model used by Huybrechts et al. (2011) is in principle capable of capturing grounding line motion of marine ice sheets (see Box 13.2), low confidence is assigned to the model’s ability to capture the associated time scale and the perturbation required to initiate a retreat (Pattyn et al., 2013)."
What this tells me is that there is a “theoretical” danger but so far we do not have any evidence of an actual retreat or the time frame over which this could occur. We cannot base our rational responses to AGW based upon theories which have not been supported with observational evidence.
As for the Greenland ice sheet, we know that the major warming was caused by warm waters appearing around Greenland and the impact that this has had on the melting of the ice sheet in the peripheries around the ocean at least from 1990 to 2012. My understanding is that this has been attributed to a decrease in cloudiness associated with the NAO which would mean that it was the increased insolation which caused the increase in the melting. Here is the discussion in FAQ 13.2 regarding the Greenland ice sheet:
"Although the observed response of outlet glaciers is both complex and highly variable, iceberg calving from many of Greenland’s major outlet glaciers has increased substantially over the last decade and constitutes an appreciable additional mass loss. This seems to be related to the intrusion of warm water into the coastal seas around Greenland, but it is not clear whether this phenomenon is related to inter-decadal variability, such as the North Atlantic Oscillation, or a longer term trend associated with greenhouse gas–induced warming. Projecting its effect on 21st century outflow is therefore difficult, but it does highlight the apparent sensitivity of outflow to ocean warming. The effects of more surface melt water on the lubrication of the ice sheet’s bed, and the ability of warmer ice to deform more easily, may lead to greater rates of flow, but the link to recent increases in outflow is unclear."
With the above information, the question that has been posed to me is where would I place the estimate of GMSL at 2100 compared to the Fifth Assessment (RCP 8.5) projection of .59cm to .98cm?
Firstly, it seems to me that during the 20th Century we had an almost linear rise in sea level as is acknowledged by the Fifth Assessment at 13.3.6 at p. 1159:
"GMSL rise during the 20th century can be accounted for within uncertainties, including the observation that the linear trend of GMSL rise during the last 50 years is little larger than for the 20th century, despite the increasing anthropogenic forcing (Gregory et al., 2013b)."
Here is a larger quote from the same Gregory paper:
“The largest contribution to GMSLR during the twentieth century was from glaciers, and its rate was no greater in the second half than in the first half of the century, despite the climatic warming during the century. Of the contributions to our budget of GMSLR, only thermal expansion shows a tendency for increasing rate as the magnitude of anthropogenic global climate change increases, and this tendency has been weakened by natural volcanic forcing. Greenland ice sheet contribution relates more to regional climate variability than to global climate change; and the residual, attributed to the Antarctic ice sheet, has no significant time dependence. The implication of our closure of the budget is that a relationship between global climate change and the rate of GMSLR is weak or absent in the twentieth century. The lack of a strong relationship is consistent with the evidence from the tide gauge datasets, whose authors find acceleration of GMSLR during the twentieth century to be either insignificant or small.”
This is consistent with the “Munk enigma” that he saw a near linear increase in GMSL during the 20th Century notwithstanding the impact of AGW only in the second half.
The Fifth Assessment RCP 8.5 assumes that in the second half of the 21st Century we will have what at least are “quadratic increases” if not “exponential increases” in the GMSL rate. I have no understanding of how a “quadratic curve” differs from an “exponential curve” and I do not have to notwithstanding all of the debate that I read on this issue on the “other website”. What I do know is that it is much steeper than a linear increase.
From Table 13.5 the Fifth Assessment has acknowledged that in the case of RCP 8.5 that in the period 2018 to 2100 they project an average sea level rate of 11.2 mm/yr for the mid-case and for the high case of .98 m the projected average rate is 15.7 mm/yr. See Section 13.5.1 at page 1180:
"The rate of rise becomes roughly constant in RCP4.5 and RCP6.0 by the end of the century, whereas acceleration continues throughout the century in RCP8.5, reaching 11 [8 to 16] mm yr–1 in 2081–2100."
Notwithstanding this projection, the Fifth Assessment acknowledges that this would exceed the average rate of 10 mm/yr during the deglaciation after the Last Glacial Maximum when there were massive ice caps over North America and Europe and Asia to supply the melt water (Chp13 pg. 1205):
"For the RCP8.5 scenario, the projected rate of GMSL rise by the end of the 21st century will approach average rates experienced during the deglaciation of the Earth after the Last Glacial Maximum."
The IPCC clearly understood this but did not explain how this could be achieved given the lack of such volumes of ice now (Chp 13 pg. 1185):
"The third approach uses paleo records of sea level change that show that rapid GMSL rise has occurred during glacial terminations, at rates that averaged about 10 mm yr–1 over centuries, with at least one instance (Meltwater Pulse 1A) that exceeded 40 mm yr–1 (Section 5.6.3), but this rise was primarily from much larger ice-sheet sources that no longer exist."
Grammatically, the phrase “but this rise ….” modifies the reference to 10 mm/yr and not 40 mm/yr.
The IPCC projection of sea level rise attributes the largest rise to thermal expansion, secondly to glaciers, and thirdly to the Greenland ice sheet mass balance loss and with a negative contribution by the Antarctic ice sheet.
As to the IPCC’s ability to adequately model dynamic changes to the Greenland and Antarctic ice sheets here is what the Fifth Assessment says at 13.5.4.1 pg 1187:
"As discussed in Sections 13.4.3.2 and 13.4.4.2, there is medium confidence in the ability of coupled ice sheet–climate models to project sea level contributions from dynamic ice-sheet changes in Greenland and Antarctica for the 21st century. In Greenland, dynamic mass loss is limited by topographically defined outlets regions."
Note the use of the term "Medium Confidence".
With all of the above research, given that I could not accept some of the projections of the IPCC for RCP8.5 (leaving alone the fact that RCP 8.5 is probably unrealistic given the changes we see in a move to renewable energy sources at least in the developed world) the question came down to what would I guesstimate the GMSL for 2100 if for some reason I was asked my opinion (which I was by Bob Loblaw).
For me, I would go back to the observations and look at where the sea level has moved since 1900 and assume that it will follow along the same largely linear path that it has pretty well followed since we have kept records in tide gauges. Taking Figure 13.27 of the Fifth Assessment and applying a ruler to the line, it projects out to about .4m by 2100. In other words, whatever impact CO2 emissions have had they are “baked in the cake”. What we see is what we will get.
Using the most recent date online at NASA, as of December 2017, we have had an 87.5 mm rise since 1993 representing an average rate of 3.2 mm/yr according to the NASA website. If we multiply this figure of 3.2 mm times 82 years, we arrive at around 26.24 cm of further rise if the rise continues to be linear. If you add this 26.24 to the .19 cm for the period 1900 to 1990 it totals 45.24 cm.
So my guess is that we probably will have a further 21 to 26 cm from now until 2100 representing somewhere around 8 to 10 inches of sea level rise. Unfortunately, I will not be around to see if I am right!
-
nigelj at 08:20 AM on 1 April 20182018 SkS Weekly Climate Change & Global Warming News Roundup #13
"From what I can tell, Chevron’s lawyer intimated that the oil companies’ defense will be that the science of anthropogenic causes was not clear until a few years ago and now that it is clear, the industry isn’t denying it......"
The science was clear enough at least 20 years ago, so thats quite a few years. Apparently the oil companies own internal ducuments were telling them there was a problem back then.
Covering up problems, or denying them, undermining science, or being equivocal can be a case for claims of negligence. Just look at the history of tobacco litigation, and the millions awarded in damages.
At least the oil companies have accepted the basics of the science. The oil companies are now in conflict with the extreme denialist groups like Christopher Moncton who deny basically everything. With some luck they will all start fighting each other, like the different groups of Orcs in Lord Of the Rings!
-
One Planet Only Forever at 07:40 AM on 1 April 2018In court, Big Oil rejected climate denial
Glenn Tamblyn@7,
There is additional understanding related to the devious actions of the delayers of climate action through the past 30 years.
I shared a version of following on the "Climate scientists debate a flaw in the Paris climate agreement" in response to John Hartz's comment pointing to an article about the IPCC reports already being an outdated understanding when they are published.
Several years ago I heard a CBC Radio interview of one of Canada's scientist representatives working on writing an IPCC Report (unable to find an archive of that interview on the CBC website). His main point was that he, and every other scientist, had a political-minder reviewing what was being written and potentially pushing for a political interest. The only limit on the political push was that the final wording had to be scientifically supportable (scientifically representing the available evidence).
Political interests that wish to diminish or delay corrective climate action can (and almost certainly did) abuse that process to push for the least disastrous presentation that can be supported by the available information. They pushed as hard as possible toward the 'feel good news' side of how bad things will be.
As more information is obtained, as more climate science is performed, it gets harder to push that low. Each subsequent report is highly likely to ratchet up 'how bad things could be', even without a significant development of new learning indicating more negative future results, just an increase of information supporting the previous report's median, rather than best case, scientific understanding of how bad things could be.
So, the 'legal argument' made by the likes of Chevron that the earlier IPCC reports were not as adamant about how bad things were, how unacceptable what had developed was, are constructed by abusing the fact that each IPCC Report is subject to political manipulation by the 'powerful likes of Chevron/Exxon/Koch Industries and the elected representatives they can influence' towards down-playing how bad things have developed to be and how much worse they will become.
Increasing awareness that 'legal' does not mean 'ethical or helpful or acceptable' is an important part of the required increased awareness and better understanding that will make a beneficial difference for the future of humanity. And increasing awareness that popularity and profitability have proven to be lousy measures of acceptability, and detrimental to ethics and helpfulness, is also important.
But the most important increase of understanding is that the systems that develop unsustainable activities that are harmful to others also develop resistance to being corrected. And they need to be corrected to become systems that promote the development of sustainable improvements for all of humanity (systems that push to achieve, and improve, all of the Sustainable Development Goals). And the portion of the population that resists correction are understandably 'the problem'.
Efforts to increase awareness and improve understanding are always helpful, compared to the alternative of resistance to correction growing stronger, more damaging, and ultimately unsustainable but doing tremendous harm before it is ended. Not sure what the best answer is, but one good result would be a correction of the systems to apply the highest expectation and requirement for helpfulness to the richest and most influential/powerful. That could be the basis for all legal actions, leading to penalties and other corrective actions being applied to someone who chooses not to behave more helpfully/correctly, even if what they did was not clearly contravening 'currently written laws of the day'. And the highest expectation of proper understanding of how to be helpful would be applied to the richest and most powerful.
It will be interesting to see just how rapidly the corrections of the incorrectly developed systems occur. The continued unjustified claim-making by the passionate deniers of climate science, exposing what has to change to limit the harm done to future generations, will hopefully fuel a more aggressive development of public support for the need for correction, to the detriment of those who tried to delay such corrections.
-
michael sweet at 21:22 PM on 31 March 2018Study: wind and solar can power most of the United States
Alchemyst,
"Flexible energy producers" is not baseload. Learn your terminology. At 26 your quote describes the system proposed for a 100% renewable energy system that requires no baseload power. Use quotation marks and indent to show that you are quoting your source. The OP discusses how much storage is needed in the USA. Your citations do not support your arguments
You need to acknowledge that Glen Tamblyn has explained how frequency regulation works and that renewable energy does not have a problem with frequency regulation.
-
Alchemyst at 20:31 PM on 31 March 2018Study: wind and solar can power most of the United States
Even the premier manufacurer of electricty storage devices states that a baseload is needed.
https://www.siemens.com/innovation/en/home/pictures-of-the-future/energy-and-efficiency/smart-grids-and-energy-storage-energy-storage.html
But the higher the proportion of the energy mix represented by renewable energy sources such as solar and wind power, the greater the fluctuations in electricity generation – varying by the minute, hour, day and season, depending on energy source and region. To offset these fluctuations, the power network needs flexible electricity producers, such as decentralized energy storage systems and gas turbine power plants. These would accumulate electricity when generation exceeds demand, and would release it when renewable sources fail to supply enough.
-
Glenn Tamblyn at 20:13 PM on 31 March 2018Study: wind and solar can power most of the United States
Alchemyst
And there are periods where they generate more power than they need and it is exported, some to Germany, some gets sent to Norway where it is stored in Pumped-hydro in the mountains.
And it's not goodwill, it is an energy system spanning multiple countries.
None of which is relavent to the point that highlevels of wind don't endanger frequency management just because it is wind. -
Alchemyst at 20:08 PM on 31 March 2018Study: wind and solar can power most of the United States
Glen at 1606
The Danes have 40% wind powr generation and rely on other nations goodwill for when the wind doe not blow.
-
Glenn Tamblyn at 17:18 PM on 31 March 2018In court, Big Oil rejected climate denial
Interesting point from the Vox article.
"But as Boutrous (for Chevron) detailed the history of how climate scientists like Svante Arrhenius and John Tyndall developed their theories, he also noted that previous IPCC reports weren’t always so certain. The 1990 report said that “the observed increase could be largely due to natural variability.” The 1995 report said that signals were emerging that there is human influence on the climate. The 2001 report said that warming was “very unlikely” due to natural causes alone.The point he was making was that the consensus took time to build, and as the science got better, Chevron moved with it. Past rhetoric from oil companies reflected this uncertainty in the science, and Chevron now has a comprehensive strategy for managing climate risks, including cutting greenhouse gas emissions."
Thats what a smart fossil fuel company (Chevron), with a bright Board and good lawyers does. Agrees, says we can't be blamed for the past because, well, because, and we are being 'really really good now'.
Exactly which of the other FF majors thought sending in the clowns instead was a better strategy?
This will be the next strategy, "its real, we accept that, and we are being really good". I expect funding from the mainstream, publicly listed FF companies to the denier institutes to start to dry up. It will only be the Koch's etc who keep funding them.
And the next battle in the inside business wars around climate change? What happens when the FF majors adopt this strategy realise and the the Kochistas are undermining their next step? We may not be able to do much to the Koch's, but what happens to them when Exxon, Chevron & Total come after them with all legal guns blazing - and insider information about how the denial machine works?
This would be a perfectly reasonble PR tactic. "We accept climate change and we are really, really doing .... something ... about it - see we built a wind farm. But these evil climate deniers and these evil billionaires, they are just so bad. It's unAmerican! Don't worry, we won't stand for this, the people of America can depend on us to protect them from evil money". -
Glenn Tamblyn at 16:07 PM on 31 March 2018Study: wind and solar can power most of the United States
Just some points to nore about Amethyst's links. The first is a paper dated 2013, so 5 years ago, and an eternity in the fast developing world of wind power, And it deals with managing power output from individual turbine and management of individual wind farms. No mention of frequency whatsoever.
The second link, a PhD thesis, is from 2014, still some time ago. It discusses voltage stability and response to transient events, but does not discuss basic frequency management at all. As the thesis notes many older turbines were designed for fixed rotor speeds but that has largely been superseded now - new designs manage rotor speed, blade angle of attack etc to maximise energy extraction from the wind. This has been an important part of the cost reductions in wind recently, turbines that are more efficient,
On the subject of frequency, everything on a grid has to synch frequency very accurately. If each machine's frequency deviates by even fractions of a percent, the overall supply becomes totally chaotic in seconds. But this frequency isn't exactly constant. As loading on the grid varies there ia a natural small variation of frequency - most grids are designed to stay within +/- 0.5 hz of their nominal frequency. Under higher loads for example frequency typically dips a fraction of a hz. But importantly, everything on the grid stays sufficiently synched together, even as they all fluctuate. If the frequency deviates too far too fast generators are often required by the operating rules of the grid to disconnect to protect themselves and the grid.
And wind power systems participate in this successfully. Look at places with high wind penetration. South Australia has around 50% wind, and at times wind is supplying around 1/2 the states power. And there are no problems with wind not synching with everything else. If there were, with that level of wind, the grid would collapse in seconds.
There are some issues with higher levels of wind (and solar) reducing the supply of synthetic inertia to the grid that the fossil fuel (and hydro) generators need to stay in synch.
Essentially Coal, Gas & Hydro plants need the grid to help them stay synched, providing inertia for the spinning machines to work against to help stabilise their speeds and thus output frequency. And some participants on the grid actually supply frequency control services, rapidly adding or removing demand on second timescales to vary the loads that the FF & Hydro generators work against to prevent them varying in speed to much as demand varies. This allows the control systems in the FF & Hydro plants enough time to change the flow rate of the steam for example to adjust the power output of the generator. Essentially the FF generators can't maintain grid frequency stability on their own, their response times are too slow. So instead of them stabilising the grid, they are actually stabilised by it, by other systems.
Wind hasn't detracted from basic frequency management but at high penetrations levels it has reduced the level of synthetic inertia available on the grid. It hasn't directly destabilised the grid, but it has made it harder for the actual stabilisers to stabilise the FF plants. This issue is well recognised, and there are technologies to address this, adding extra components to increase synthetic inertia.
Alchemysts's point about 'baseload' stabilising wind isn't true. Baseload (meaning things like coal) actually need to be stabilised by other systems.
Modern wind turbines have completely decoupled the rotational speed of the turbine from the frequency of the power they put out onto the grid. Two methods used are:- Doubly Fed Induction Generators. Essentially using an AC-DC-AC converter to manipulator the energisation of the windings so the power output from the turbine has the right frequency, independent of the speed of the blades.
- Direct AC-DC-AC conversion. Instead of messing with the windings, the complete AC power output from the turbine, at whatever voltage and frequency, is fed into a converter. First the conversion to DC removes any consideration of the rotor speed. Then the second DC-AC stage creates the desired voltage and frequency, 60 hz say. And the control system for these can then vary this output frequency to follow the variations in the frequency on the grid. Solar power from PV's, being DC, is fed onto the grid in a similar manner, with a DC-AC conversion that handles managing output voltage and frequency. Similar technologies are used in High Voltage DC Transmission lines to convert AC to DC, transmit DC, then convert from DC back to AC at the other end.
If these approaches didn't work, then places like South Australia or Denmark with high penetrations of wind would have totally collapsed grids. They don't!
-
scaddenp at 14:29 PM on 31 March 2018Explainer: The polar vortex, climate change and the ‘Beast from the East’
Alchemyst, given your earlier comments expressing doubts about modelling, I am surprized at you pushing a modelling paper. I am a little curious as to how you found it but yet missed any the 2014 reviews of arctic influence. No matter – the paper in question (Ineson et al, 2011) was written showing some modelling support for hypothesis of low solar activity contributing to the then recent cold winters. The corollary of this view is that anomalous jet stream behaviour (present in those events) should have eased when the sun returned to active mode. It did not – anomalies continued right up to this year. Furthermore, if the solar is the dominant influence, (as opposed to a contributing factor), then the 2018 tree ring study of jet stream behaviour should be also revealing the link – it does not.
Overland et al 2015 has a discussion of arctic – jet stream linkages which I found very helpful. It notes solar (citing Ineson et al) among other possible influences (ENSO, QBO, AMO etc). However, the evidence is increasing pointing towards the loss of ice in the arctic basins as the dominant cause of recent anomalous jet stream variability. The tree ring study by itself put any "Its just a natural cycle" explanation in doubt.
Interestingly, the model effect from solar changes in Ineson et al affecting the jet stream variability is the decrease in equator-polar temperate gradient.
"This temperature change is directly attributable to the decrease
in ozone heating associated with ultraviolet irradiance, which
is important at these levels11. This signal peaks in the tropics
and corresponds to a relative decrease in the pole-to-equator
temperature gradient. This response is reproduced in our model
(Supplementary Fig. S1) with significant cooling of about 2 K near
the tropical stratopause. Geostrophic balance requires that the
diminished polewards temperature gradient is matched by a weak
easterly wind anomaly in the subtropical zonal mean circulation
in the upper stratosphere"Sea-ice loss does exactly the same thing.
As this article clearly states, the science is still young but it certainly cannot be dismissed.
-
Philippe Chantreau at 13:22 PM on 31 March 2018Study: wind and solar can power most of the United States
As Nigel has noted, the thesis linked by Alchemyst does not point to any fundamental problem. In fact, the introduction of the thesis states that it is of interest because of increased contribution from a specific type of wind generator into the grid and an even greater anticipated future contribution.
Alchemyst, I suggest that you read more carefully the materials you link. Also, you need to argue on topic. The topic of this thread is 100% wind/solar generation and the geographical are and overgeneration capacity to achieve that goal. The paper in the OP discusses that topic, that's what you need to argue about here on this thread. Your comment at 18 indicates that you did not carefully read the OP paper.
The instability caused by increased contribution of intermittent sources in a grid prinarily fed by conventional sources is a different enough topic to warrant looking for a more appropriate thread.
-
nigelj at 12:24 PM on 31 March 2018Study: wind and solar can power most of the United States
Alchemyst @17
Your claims don't appear to be sustained. These appear to be problems about wind power maintaining an even voltage and frequency.
The abstract of the thesis in your link is about the problems of fixed speed generators in terms of stable voltages, and notes these are common in existing wind farms. However it notes that direct drive variable speed generators are feasible, although more expensive. However it did not say prohibitively more expensive, and its not clear why they would be given the nature of generators.
I couldn't see any obvious reference to frequencies or problems with this.
I really don't see that the thesis found some fundamental unsolvable problem with anything.
If you meant problems with functionality of storage technology, I'm not sure where you get that from. Have a look at the huge Tesla battery instillation working in southern australia.
Clearly batteries are still expensive, but numerous options are under investigation in prototype that use relatively cheap materials including alluminium, carbon, sodium sulphur etc. And note my post above on how much lithium batteries have dropped in price in just a few years.
-
nigelj at 11:51 AM on 31 March 2018Study: wind and solar can power most of the United States
Alchemyst @15
"You are correct at the moment we can only use wind power to supplement other generating systems. "
I only said that in the sense that wind and solar can provide 80 - 90% of power with the remainder as biofuels, nuclear or hydro. (or gas as a last resort). This system provides a stable baseload according to the article, and is also economically viable right now.
Storage options are however dropping fast in price and could replace the need for biofuels, nuclear etc. This would be preferable to me.
Your science daily link didn't say anything about baseload power requirements.
-
DPiepgrass at 11:44 AM on 31 March 2018How could global warming accelerate if CO2 is 'logarithmic'?
William, tipping points do exist and imply that the long-term warming curve isn't quite logarithmic. I believe that the usual estimate of ECS of 3°C (when CO2 doubles) does include some tipping points having been reached.
You mentioned clathrates—it is considered "very unlikely" that clathrates will release methane in a "catastrophic" manner during this century; in fact it appears the threat is many centuries away (see this video or this SkS article); I think it's safe to say we can stop worrying about clathrates unless new evidence comes in showing the threat has been underestimated.
I believe the most notable tipping point is ice sheet melting. According to one estimate, "the tipping point for eventual total melting of the Greenland ice sheet could be a global temperature of around 1.6°C above preindustrial"—or even lower due to uncertainty (this corresponds to more than 1.6°C of warming in northern Greenland, since the arctic has warmed much faster than the global average. In southern Greenland, maybe not, due to the cold blob.)
Uncertainty—contrary to what the dismissives say—is one of the scariest things about global warming. Due to uncertainty, the ECS could be as low as 2°C or as high as 4.5°C. The latter would be catastrophic for human civilization, especially as it corresponds to more than 4.5°C of warming on land. (Based on Sutton et al 2007's low-lattitude warming ratio of 1.51, that would be 5.9°C/11°F hotter on land and 3.9°C at sea. If you've ever lived in a tropical climate, you know the last thing we need is more heat!)
-
Philippe Chantreau at 11:40 AM on 31 March 2018Study: wind and solar can power most of the United States
Storage technology has been proven.
-
Alchemyst at 11:37 AM on 31 March 2018Study: wind and solar can power most of the United States
Sweet for point 15
To reliably meet 100% of total annual electricity demand, seasonal cycles and unpredictable weather events require several weeks’ worth of energy storage and/or the installation of much more capacity of solar and wind power than is routinely necessary.
I think you are going to need a back up
your report missed
-
Alchemyst at 11:28 AM on 31 March 2018Study: wind and solar can power most of the United States
My claims are sustansiated.
http://shodhganga.inflibnet.ac.in/bitstream/10603/79069/1/jeeva%20jothi%20thesis%20final.pdf
Moderator Response:[GT] Link corrected. Please use the linking tool in the toolbox
-
michael sweet at 10:32 AM on 31 March 2018Study: wind and solar can power most of the United States
Alchymst,
Philippe Chantreau has noted that your reference does not support your false claims. Please link a reference that supports your claims. It is not my responsibility to search for support for your false claims.
Your claims at 15 are also false. You have provided no references to support your wild claims. It is sloganeering to make unsupported claims. The moderators wil start to delete your posts if you continue to refuse to support your wild claims.
-
Alchemyst at 09:26 AM on 31 March 2018Study: wind and solar can power most of the United States
nigelj at 6:02 an 28 march.
You are correct at the moment we can only use wind power to supplement other generating systems. the problems are in transmission and stability (not just power but synchronising every windmill in the grid and making sure that they don't operate ot 60.01 Hz instead of 60Hz which the author has not touched on). This brings us to storage which strongly aids stabilty. This technolgy is not currently proven and in itself with its own set problems and costs. With current resources and technology a conventional baseload is essential
-
Philippe Chantreau at 08:58 AM on 31 March 2018Study: wind and solar can power most of the United States
This is from Alchemyst's link and contains the gist of the story:
"In a paper published in the American Institute of Physics' Journal of Renewable and Sustainable Energy, researchers propose a new strategy to optimize power-generation efficiency and so better control wind farms."
More detail: "The new strategy is based on continuous predictions of how fluctuating winds affect each turbine's maximum generation capacity. It also incorporates factors missing in other wind-farm control strategies, including differing power generation between turbines, actual fluctuations in power generation capacity, errors in prediction, communication disruptions preventing active control, and even turbines without the capacity for continuous active control."
So, as Alchemyst shows us, there are ways to optimize generation that have not yet been implemented at large scales.
It goes on to say :"To demonstrate the feasibility of the new strategy, the researchers compared their predictions to raw data from a single wind turbine. The team then further refined their calculations and simulated a control operation with data from a wind farm of 33 turbines.The results suggest that wind-farm managers can improve their power-generation efficiency with the new strategy." Rather encouraging I'd say. And it took only a few seconds to find that reference. There is a wealth of knowledge about renewables out there.
-
John Hartz at 08:54 AM on 31 March 2018Web of Power: Cambridge Analytica and the Climate Science Denial Network Lobbying for Brexit and Trump
A follow-up article by Mat Hope of DeSmog UK...
Mapped: Cambridge Analytica’s Ties to the Fossil Fuel Industry by Mat Hope, DeSmog UK, Mar 29, 2018
-
Philippe Chantreau at 08:45 AM on 31 March 2018Study: wind and solar can power most of the United States
Alchemyst, from what can be reached through the link you provided, your referenc does not treat of the use of baseload power. It explores ways to optimize the use of wind by doing short term, high accuracy projections of demand vs production capability. There was nothing I saw in it about baseload. The intermittency of the renewables considered in the article referenced in the OP is well known and has been well known for a long time. The intermittency is the very reason for the study. The entire point of the study is to determine the region size and relative capacity necessary to afford not only 100 % renewable but 100% from wind and solar. You seem to not have read the OP and followed the links. Your own reference is from 2013 and, if anything, makes the 2018 study by Kaldeira and others more relevant, as the methods described in your study could in fact reduce the region size and overcapacity necessary for the goal of 100% wind/solar.
-
Alchemyst at 07:52 AM on 31 March 2018Study: wind and solar can power most of the United States
Sweet
it is this simple 10 seconds to find a reference. Please stop being abusive
Windmill produced electricity is not stable it needs a baseload or stabilisers.
currently using a baseload is the only proven method of stabaising the current parameters.
https://www.sciencedaily.com/releases/2013/03/130325101529.htm
Moderator Response:[GT] Link established. Please use the linking tool in the toolbox.
-
nigelj at 05:40 AM on 31 March 2018Study: wind and solar can power most of the United States
Michael Sweet @9, new article you and others may be interested in:
"Stunning drops in solar, wind costs mean economic case for coal, gas is ‘crumbling"
-
william5331 at 05:33 AM on 31 March 2018Climate scientists debate a flaw in the Paris climate agreement
Sorry to say but the campaign against climate change and all the other campaigns we are involved in are bound to fail or at best result in very poor partial solutions. Any bright high school student could tell the politicians what is necessary. The technology is not the problem. If we want to make traction we must all unite behind solving the core problem.
http://mtkass.blogspot.co.nz/2018/01/wasted-effort.html
-
John Wise at 04:20 AM on 31 March 2018Climate scientists debate a flaw in the Paris climate agreement
"The latest IPCC report considered 116 potential scenarios for staying below 2°C, and 101 of those scenarios (87%) included negative emissions in the form of carbon capture and storage." And that seems to be the elephant in the room. While it is (barely) conceivable that we could get down close to zero emissions in the coming decades, it seems unlikely, barring some breakthrough, that we could sequester enough CO2 to match those IPCC assumptions. I recall Kevin Anderson of the Tyndall Centre saying we would have to capture and store something in the order of 30 billion tonnes a year.
-
Eclectic at 23:53 PM on 30 March 2018Was Greenland really green in the past?
In the Greenland section of Jared Diamond's book "Collapse", he describes the Norse settlements in Greenland as failing owing to cultural factors rather than climate.
The rise & spread of Muslim power (in Africa and the Middle East) blocked or impeded the European import of elephant ivory. Consequently the Norse Greenlanders initially became quite wealthy by harvesting and exporting walrus ivory to Western Europe. But that trade later altered as "geopolitics" changed.
Some aspects of Norse farming methodology were not well suited to Greenland conditions, and there was necessarily a swing to more reliance on wildlife hunting and especially the harvesting of seals.
The Norse despised the aboriginal Inuit as heathen & uncivilized. Intermarriage with Inuit and prudent diplomatic relations with Inuit did not happen. The reverse — there were increasing hostilities with the Inuit, skirmishes and even some pitched battles (casualty numbers small but of course higly significant for such a small population of Norse. *IIRC*, Diamond equated the Norse warriors lost in the worst battle, as representing the U.S. Army losing 3 million men in a single battle).
In short, the Norse failed to live with their Inuit neighbours and failed to make full use of the "technology" which had sustained the Inuit in Greenland over thousands of years. A lesson for us all.
Even today, the 60,000 Greenlander population is 90% Inuit — though the economy is supported by fishing using modern technology. And, as in northern Canada, there is a high level of demoralization, suicide & alcoholism — a result of the social climate, not the physical climate.
-
Daniel Bailey at 20:53 PM on 30 March 2018Was Greenland really green in the past?
The climate was already cold in Greenland at that time. In fact, the climate was so inhospitable that the few survivors of the Viking settlements left rather than die there.
The Vikings did farm, but they farmed in two settlements in limited coastal fringes, and it was worse-than-subsistence farming (because the farming and building eroded the fragile top-soil). The same sort of farming seems to have been possible for much of the intervening time, therefore the farming cannot be taken as direct evidence of warmer conditions. The Vikings did so well at farming that they died doing it while the local Inuits still thrive today.
The Viking settlements did not get buried under glaciers (Google Hvalsey Church). One got buried under wind-blown sand. Thus the failure of the settlements cannot be taken as direct evidence of cooler conditions. The portions of Greenland not immediately adjacent to the ocean have been continuously covered in ice sheets for tens of thousands to hundreds of thousands to millions of years.
If you want further proof and readings about what the Viking settlements failed, read Jared Diamond's "Collapse". Diamond refers to several book-length accounts, but a shorter older account is Magnus Magnusson's "Vikings" (1980).
And then there's this:
"the Greenland Norse were "not a civilization stuck in their ways." To NABO archaeologist George Hambrecht of the University of Maryland in College Park, "The new story is that they adapted but they failed anyway.""
And
"Despite the signs of crisis at a few Western Settlement sites, those in the Eastern Settlement show no sign of a violent end. Instead, after farmhouses collapsed, remaining settlers scavenged the wood from them, suggesting a slow dwindling of population. The challenge for the average Greenlander to survive drove "a constant emigration" back to Iceland and Europe, Fitzhugh hypothesizes, "which could bring the Eastern [Settlement] to a close peacefully, without starvation or death by Inuit.""
As for this question of yours:
"is it true that Greenland now is greener than in the past"
It is likely true that Greenland is now greener than it has been for some 4,000 years. Because the warming of the past 100 years (driven by human activities) has erased a natural cooling of some 4,000+ years:


Larger image here.
-
DPiepgrass at 16:33 PM on 30 March 2018How could global warming accelerate if CO2 is 'logarithmic'?
jef, it was necessary to leave out some issues to keep the post short (I was actually told I shouldn't post some of my previous material directly on SkS because it was too long). The TCR and ECS estimates come from scientists who have already included all feedbacks including water vapor. (see here for TCR and ECS estimates from various studies.) I don't see how "plotting CO2 and announcing future warming is [...] dishonest".
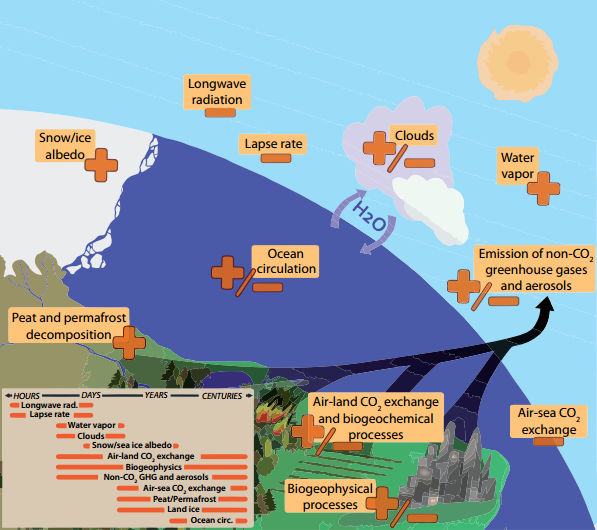
I didn't mention water vapor because it is a short-term feedback, as you can see on this illustration from AR5 SYR:
Although it is a short-term feedback, it acts indirectly as a long-term feedback because future committed warming (caused by long-term feedbacks) will be amplified by the water vapor feedback. But I didn't think it was necessary to lengthen the post by explaining this fact.
-
DPiepgrass at 15:57 PM on 30 March 2018How could global warming accelerate if CO2 is 'logarithmic'?
Tminus, that's interesting. I suppose it makes intuitive sense that heat added at the ocean surface would take a long time to leave, because the heat can migrate downward and stay deep for a long time before radiating from the surface eventually. On the other hand, 70-75% of sea level rise is due to ice melting so that's a larger concern. Here too, methane will help ice melt earlier. Clearly methane is a problem, but in this context it's a question of how big the problem is relative to CO2. Since CO2 causes ocean acidification and methane doesn't, on the whole I'm still inclined to think CO2 is much worse. But I'm not opposed to removing the word "much" in "much less serious".
-
DPiepgrass at 14:47 PM on 30 March 2018Was Greenland really green in the past?
randman, your comment doesn't make sense to me. The map comes from a peer-reviewed scientific paper by a team of 9 scientists. Are you accusing the scientists of fraud...? The paper says it used a "diverse multiproxy network" documented in Dataset S1 of the Materials and Methods supplement associated with the paper. That'll be the observations, or in other words, evidence, upon which the map is based.
-
michael sweet at 12:13 PM on 30 March 2018Study: wind and solar can power most of the United States
Alchemyst,
All those considerations are included in the study. Large areas average out the wind. The article discusses storage. Base load is not needed to stabilize the grid.
Please provide a citation for your false claims or withdraw your argument.
If you do not know what you are talking about you should remain silent.
-
Alchemyst at 10:59 AM on 30 March 2018Study: wind and solar can power most of the United States
the power from a windmill is not stable enough to be used solely on the grid, due to flucuations and needs some means of stabalsing the electric parameters and needs a base load which needs to be provided by fossil or nuclrear or say some storage scheme. this report does not address ths matter
-
Alchemyst at 10:38 AM on 30 March 2018How could global warming accelerate if CO2 is 'logarithmic'?
nijel j
its the beer lambert law basiclly
-
One Planet Only Forever at 08:14 AM on 30 March 2018Climate scientists debate a flaw in the Paris climate agreement
John Hartz,
Thanks for another good pointer to more recent better understanding.
I remember hearing about another reason the IPCC Reports are 'behind the times', especially the Summaries for Policymakers. In addition to the delays in getting to a consensus statement, the process requires all parties to agree to the wording. The only restriction is that the final wording has to be scientifically supportable (scientifically representing the available evidence).
Governments that wish to diminish or delay corrective climate action can abuse that process to push for the least disastrous presentation that can be supported by the available information. They can push as hard as possible to the 'feel good news' side of how bad things will be.
As more information is obtained it gets harder to push that low. Therefore, each subsequent report is highly likely to ratchet up 'how bad things could be', even without a significant development of new learning indicating more negative future results, just an increase of information supporting the previous report's median, rather than best case, scientific understanding of how bad things could be.
The discussion of how to measure the 2 C limit of the Paris Agreement really is a side-show. The main event is getting all the wealthiest, not just the portion caring to be helpful, to lead the way to rapidly reduce all of the negative impacts from the unsustainable bad habit of trying to benefit from the burning of fossil fuels (not just the excess CO2).
-
SirCharles at 07:11 AM on 30 March 2018Students from KMIDS college in Bangkok posting comments
One of the best ways to learn English (I'm talking from experience).
-
John Hartz at 06:54 AM on 30 March 2018In court, Big Oil rejected climate denial
More supplemental reding:
How Do Big Oil Companies Talk about Climate Science? Four Takeaways from a Day in Court by Kristina Dahl, Union of Concerned Scientists, Mar 22, 2018
The Climate Is Changing For Climate Skeptics by Amy Westervelt, Environment, Huffpost, Mar 23, 2018
Chevron just agreed in court that humans cause climate change, setting a new legal precedent by Umair Irfan, Energy & Environment, Vox, Mar 28, 2018
-
John Hartz at 06:28 AM on 30 March 2018Climate scientists debate a flaw in the Paris climate agreement
Suggested supplemental reading:
Climate science’s official text is outdated. Here’s what it’s missing. by Eric Holthaus, Grist, Mar 22, 2018
-
Anne-Marie Blackburn at 06:25 AM on 30 March 2018Arctic was warmer in 1940
Hello Napin, welcome to Skeptical Science! Your question is an interesting and important one because what we choose to do as a society depends on our understanding of the problem we’re facing. If we don’t understand the problem properly we might make decisions that fail to address it. So how can we make sure the information we’re given is correct?
One of the first steps we can take is to check the source of the information. In the case of the claim that Arctic temperatures were warmer in the 1940s, the author is Christopher Monckton and his article was published on the Science and Public Policy Institute (SPPI) website. Christopher Monckton is not a climate scientist and the SPPI is not a scientific publication. This doesn’t necessarily mean that the information is incorrect but it does mean we have to evaluate his claims carefully. If we look at his graphs on Arctic warming we notice a few things. First, there is no reference given for the graphs so it’s not possible to check whether they’re reliable. Without access to the data so that we can produce our own graph, we can’t say that this graph is accurate.
In the case of the second graph, it seems that Monckton is only looking a small selection of weather stations. It’s hard to tell because he hasn’t provided a reference to the data in question. As Robert writes in his article, Monckton doesn’t seem to an analysis that covers the whole of the Arctic. In other words, Monckton has cherry-picked a few weather stations that support his argument rather than looking at all the evidence. In the case of the third graph Monckton once again fails to provide a reference so we face the same problem as with the two other graphs. Also the graph ends just after the year 2000 so it misses out a lot of the recent warming.
So I think we have good grounds to question Monckton’s claims at this point, especially as no scientific institution agrees with him. But more broadly there are things we can do to protect ourselves against misinformation. This is important because it can help us assess the validity of all claims made about a scientific topic. Skeptical Science has produced an online course which highlights the ways in which misleading arguments are constructed. Once we understand what to look for it becomes easier to spot misinformation. For instance, Monckton implies that since Arctic temperatures have changed naturally in the past, then current warming must also be natural and we don’t need to worry about CO2 emissions. This is not a scientific position. Climate has changed in past because of a number of factors - variations in solar activity, the Earth’s orbit around the sun, volcanic activity, changes in atmospheric composition, including CO2 levels, etc. We can only understand current and future climate change by looking at what’s happening now. Past climate change can help us make predictions about what will happen in the future, but it tells us nothing about the causes of current change.
If you’d like to learn more about the various ways misleading information is used, you might be interested in our online course, which can be found here. Week 1 and Week 6 are particularly useful. Also John Cook and some fellow scientists have published a recent handbook in which you might find useful information. I hope I have answered your question and if there's anything else I can help you with, please let me know.
-
bruceparker at 05:26 AM on 30 March 2018Skeptical Science now an Android app
What happened to the app on Google Play?
-
nigelj at 05:14 AM on 30 March 2018How could global warming accelerate if CO2 is 'logarithmic'?
Well written comprehensive post quoting many sources, but didn't seem to have one on background information on why CO2 has logarithmic growth.
-
Alchemyst at 04:35 AM on 30 March 2018Explainer: The polar vortex, climate change and the ‘Beast from the East’
Daniel Baily at 11 54 16 march
It appears that there is an explanation for the cold winters in western europe and it appars to be linked to sunspots, or their abscence
https://phys.org/news/2011-10-link-solar-winter-weather-revealed.html
Scientists have demonstrated a clear link between the 11-year sun cycle and winter weather over the northern hemisphere for the first time.
They found that low solar activity can contribute to cold winters in the UK, northern Europe and parts of America. But high activity from the sun has the opposite effect.
The study helps explain why the UK has been gripped by such cold winters over the last few years: the sun is just emerging from a so-called solar minimum, when solar activity is at its lowest.
'Our research establishes the link between the solar cycle and winter climate as more than just coincidence,' says Dr Adam Scaife from the UK's Met Office, one of the study's authors.
The findings, published in Nature Geoscience also raise the tantalising possibility that the regularity of the solar cycle might help weathermen predict cold winter weather over the northern hemisphere.
'We've been able to reproduce a consistent climate pattern, confirm how it works, and quantify it using a computer model. This isn't the sole driver of winter climate over our region, but it is a significant factor and understanding it is important for seasonal to decadal forecasting,' says Scaife.
Up until now, researchers have only managed to see a weak link between solar activity and winter weather: when the sun is less active, we're more likely to see weak westerly winds during the winter in the northern hemisphere. This pattern suggests that easterly winds could bring cold weather from the continent to the UK.
But scientists have struggled to incorporate these ultraviolet (UV) signals into climate models.
Now, new satellite measurements from NASA's Solar Radiation and Climate Experiment (SORCE) have revealed that differences in UV light reaching the Earth during the 11-year solar cycle are larger than previously thought. The satellite, launched in 2003, is the first ever to measure solar radiation across the entire UV spectrum.Read more at: https://phys.org/news/2011-10-link-solar-winter-weather-revealed.html#jCp
-
william5331 at 04:32 AM on 30 March 2018How could global warming accelerate if CO2 is 'logarithmic'?
Factor 5 is tipping points. As stated, carbon sinks are expected to take up less Carbon dioxide as they saturate so this will push up atmospheric CO2. Add to this, for instance, the possibility of huge burps of Methane from the various sources of Carbon dioxide clathrate. Despite the short life of Methane in the atmosphere, it could shoot up global warming to a point that the existing sinks loose more of their power to absorb the gas while at the same time pushing us over other tipping points such as a sudden complete melt of Arctic floating ice for a much longer part of the year. We are taking a giant step in to the unknown with our eyes closed.
-
One Planet Only Forever at 04:09 AM on 30 March 2018Stop blaming ‘both sides’ for America’s climate failures
People can better appreciate how unhelpful Pinker's "Enlightenment Now" actually is by reading books like Naomi Klein's "No is Not Enough". It has been recommended by many people including Noam Chomsky (a far more relevant judge of what helps raise awareness and better understanding than Bill Gates) whose simply stated evaluation is "Urgent, timely, and necessary".
In "No is Not Enough", the section of Chapter 4 (The Climate Clock Strikes Midnight), titled "What Conservatives Understand about Global Warming - and Liberals don't", includes the following: "... when hard-core conservatives deny climate change, they are not just protecting the trillions in wealth that are threatened by climate action. They are also defending something even more precious to them: an entire ideological project - neoliberalism - which holds that the market is always right, regulation is always wrong, private is good and public is bad, and taxes that support public services are the worst of all."
Pinker may not be a fanatical promoter of neoliberalism. But I do not see him bluntly criticizing the current day threat that its promotion by people calling themselves Conservative is. And he certainly does not appear to tell Conservatives that they need to act aggressively against neoliberals rather than uniting with them (and the less tolerant among us) in the hopes of Winning.
Pinker's presentation of criticisms by Klein and the Kochs of the Washington State Carbon Tax proposal does not distinguish the different motivations of Klein and the Kochs. It is either poorly informed or deliberately misleading.
-
One Planet Only Forever at 03:13 AM on 30 March 2018Stop blaming ‘both sides’ for America’s climate failures
I find “Enlightenment Now” to be heavy on sales pitches defending people who have Private Interests that are contrary to more rapidly achieving the Sustainable Development Goals, people inclined to want to believe that 'future generations will figure out amazing solutions to whatever problems current day people create' or 'deny that the systems that have developed create unsustainable and harmful results and need to be corrected'.
The end of chapters that relate to the SDGs consistently make claims that what has developed so far is Good that can be expected to get Better (Feel Good Claims), with implications that the Good and Better are natural expected outcomes of the systems that have developed. The reality is that any Good has actually been 'corrections of identified harmful unsustainable developed activity that occur because of raised public awareness and better understanding of the incorrect popular and profitable developments in the developed socioeconomic-political systems'.
Within those chapters Pinker often criticizes people who try to raise public awareness and better understanding of the harmful unsustainable things that have developed because such 'efforts to better educating of the public' likely upsets people who consider themselves to be Conservative. Making people with Private Interests contrary to achieving the SDGs learn to change their minds is a challenge. Helping enough Other people become more aware and better understanding is a solution.
To be helpful, Pinker could have focused on his linguistics and cognitive specialization to develop and present an evaluation of why misleading marketing in support of Private Interests that are understandably contrary to the achievement of the SGDs are so successful and what can be done about that undeniable developed problem.
-
Onpimon at 01:40 AM on 30 March 2018Increasing CO2 has little to no effect
I agree with the statement that CO2 is one of the main driven of climate changes. But it’s not the only one. There are some other things or other gases that can cause climate changes. Actually it’s no matter what can cause climate change more or less we have to prevent it. However, we have to concern on what can cause climate change the most. So, we can find a way to prevent it.
Moderator Response:[TD] You are correct that there are other drivers of climate change, but human-caused increase of CO2 is the most important cause of the current warming. Please read the post "CO2 Is the Main Driver of Climate Change."
-
Onpimon at 01:37 AM on 30 March 2018Was Greenland really green in the past?
Thank you for posting.
I agree with the topic, Greenland used to be green. When Greenland has discovered and named by Erik the Red about 1,000 years ago, it will be different from now. If there is no any evidence that show Greenland was green, he would not name this place as Greenland. The DNA is proof that sometime between 450,000 and 800,000 years ago, much of Greenland was especially green and covered in a boreal forest that was home to alder, spruce and pine trees, as well as insects such as butterflies and beetles (From: https://www.livescience.com/7331-ancient-greenland-green.html). And from the map, like Google map or map in Wikipedia we can see that the edge around Greenland is still green. Greenland ice sheets is between 400,000 and 800,000 years old. So, Greenland today will maybe different from the past. Because of the global warming. Global warming not just changing Greenland, but it affects all over the world. One of the main driven of global warming is from human activities. We have to cooperate together, help each other to reduce global warming before it too late. And I also have some questions. As you can see in the map that at the edge of Greenland is green, I want to know why it’s not cover of ice? And is it true that Greenland now is greener than in the past?
-
Onpimon at 01:35 AM on 30 March 2018Antarctica is too cold to lose ice
I agree with this article.I also had read an article from Boston globe, it’s an article about severe melting of ice sheet that is found in Antarctica. It’s said that a team of European scientists has found some ice sheet melting in East Antarctica during the summer months, in an area that is supposed to be too cold for perceptible ice loss. The ice sheets is weak throughout its structure. The glaciers is a large mass of ice, so it’s very hard to melt or it will take a long time to melt. But now it not take long time as in the past to melt. The glaciers are melting because of warming ocean water. Warming ocean water is caused by global warming. We have to solve this problem straightforward. In this article it’s said, we should all now at least remotely understand that mass balance changes in Antarctica aren’t reliant on surface melting but rather depend on dynamic responses such as the 2ndmechanism. I also have a question. Is it possible for melted ice to form its original ice form again?
-
jef12506 at 00:13 AM on 30 March 2018How could global warming accelerate if CO2 is 'logarithmic'?
Very carefully considered post but you left out as much or more than you include.
There are dozens of feedback mechanisms that are kicking in and really need to be included in the warming graphs. What about water vapor for one, the biggest one at that? Just plotting CO2 and announcing future warming is less than useless it is dishonest.
Also there is plenty of documented cases of natural sinks absorbing less and even starting to become emission sources such as forests.
The over all message of this post is that it is bad but not that bad and we have time so don't worr too much. I understand not wanting to upset people too much or cause panic but I believe that mentality is more harmful that good.
We need to state how bad it really is and that chanses are it is happening faster than expected using the same clear, considered, scientific evidence and let the public have the knowledge they need to make the right decisions.
Science does not get to decide how much truth we get to have.
Prev 289 290 291 292 293 294 295 296 297 298 299 300 301 302 303 304 Next


