


 Arguments


Recent Comments
Prev 313 314 315 316 317 318 319 320 321 322 323 324 325 326 327 328 Next
Comments 16001 to 16050:
-
nigelj at 13:23 PM on 28 December 2017How blogs convey and distort scientific information about polar bears and Arctic sea ice
TPohlman
"Her (Susan Crockfords) thesis is that sea ice conditions expected in those papers by 2050 has already occurred, but expected population declines have not."
She doesn't have enough information to reach that conclusion. The following are the estimates of population trends in the sub populations according to the polar bear experts here:
3 Are Declining
6 Are Stable
1is Increasing
9 Are Data DeficientSo overall numbers do appear to actually be declining slightly, but despite this with so many data deficient areas, I don't think we can be sure of overall trends in numbers with any degree of real certainty, so its not possible right now to draw conclusions, or say any predictions have been proven wrong.
You also need to understand there has been a reduction in hunting polar bears due to changes in the law, and this could have had more effect than realised on numbers further confusing the picture.
I'm no expert in polar bears or biology, but it only takes a minute to find the critical information underpinning this issue. You should be able to do this yourself, and apply some healthy scepticism to Crockfords views.
It should literally be self evident a decline in ice affects their basic habitat, so at some stage will pose problems. Habitat loss has been a prime factor in the decline of many species. Polar bears are not as resourceful and adaptable as humans, and the trouble is we tend to see things through our own eyes.
I'm always open to alternative opinions, but Crockford is unconvincing.
-
johnthepainter at 11:24 AM on 28 December 2017Some curious things about Svensmark et al. reference list
#6. Haze, A research paper that fails to recognize recent research related its subject of investigation, rather than challenging it, building on it, or at least indicating that it raises no difficulty with the paper's conclusions, strongly suggests that it should not be published in a reputable, peer-reviewed journal. That it also includes a sentence inaccurately referenced only increases the belief that, at the minimum, it should have been returned to correct these shortcomings.
-
MA Rodger at 10:30 AM on 28 December 2017CO2 limits won't cool the planet
Aaron Davis @18,
Not only are you seriously in error throughout you grand analysis, you are too stupid to understand when these errors are pointed out to you.
Perhaps we should consider the most egregious error you make. This is the inability to understand that an anomaly will take away any sign of temperature variation if such a variation resulted from an annual dip in CO2 over tha arctic. Consider this. The graph below is the RSS TLT data for arctic & antarctic, the graph you cite up-thread. It plots anomalies. Note the maximum variation is just +/-a handful of degrees centigrade from zero.
So what happened to the annual variation in polar temperature? This would give an annual cycle of 30ºC peak-to-peak but it has been disappeared. This disappearance is achieved "...by subtracting the a mean monthly value determined by averaging 1979 through 1998 data ... for each month." So the stonking big annual 30ºC cycle is entirely disappeared and any other annual cycle (like for instance a possible teeny weeny drop in temperature due to CO2 levels dropping by a few ppm every year for a handful of months) will also be disappeared with it. Was this teeny weeny cycle there during the period 1979-98 which provided the data for the anomaly base?
It appears it was! So it too would be disappeared from the anomaly.
Arron Davis, if you cannot comprehend this basic property of anomalies, you don't really have a place comment about anomalies on this thread.
Moderator Response:[TD] Snipped insult.
-
Eclectic at 10:30 AM on 28 December 2017How blogs convey and distort scientific information about polar bears and Arctic sea ice
Richardtol @13 , would you (without going to extremes of effort) please give some detail of your objection.
Do you feel that the Verheggen basic data are worse (the selection of the 45 + 45 blogs; or perhaps the selection of the blog contents/articles)?
Or do you object to the content analysis in terms of the six categories of the sea-ice/polar-bear nexus? Or some more general aspects of analysis?
Presumably you do not object to the qualitative or statistical division of the 90 blogs, with respect to their being science-based or "science-denier". Here seems to be one of those fortunate situations where the division is so black-or-white, as to need no actual mathematical analysis.
-
villabolo at 07:11 AM on 28 December 2017Fake news is a threat to humanity, but scientists may have a solution
The authors propose a number of ideas to help bring an end the post-truth era. One key idea involves the establishment of an international non-governmental organization that would create a rating system for disinformation.
Unfortunately this won't make an impact on the confirmatory bias that grips most Conservative's minds.
Also, what happens when the objective non-governmental agency gets replaced by someone who's not objective?
-
Ciência e Clima at 07:05 AM on 28 December 2017Fake news is a threat to humanity, but scientists may have a solution
cienciaeclima.com.br - social science still has much to contribute with climate science (and with science in general). But not in the way portraited in the article - as a technique to separate the truth from the lie. That is naive.
-
Haze at 06:51 AM on 28 December 2017Some curious things about Svensmark et al. reference list
My apologies "This puts in the top 1.7%" should read "This puts it in the top 1.7%"
-
Haze at 06:47 AM on 28 December 2017Some curious things about Svensmark et al. reference list
I guess it doesn't really matter what you do or don't think as Nature Communications, first published in 2010, is a peer-reviewed open access journal with an impact factor of 12.2 . This puts in the top 1.7% of the 12,016 journals tracked by Journal Citaton Reports. In view of its pedigree it is a reasonable assumption that Nature Communications publishes only those papers that meet fairly stringent criteria. That this paper by Hensmark has been published in a high quality journal indicates the reviewers had a different opinion from you regarding the validity of the findings and conclusions drawn and the relevance of the papers cited.
Moderator Response:[JH] "Hensmark"?
-
Some curious things about Svensmark et al. reference list
#3 Funkypants:
You are not the first to notice that!
This is a citation from this article by George Monbiot (second § from bottom):"Newsrooms tend to be largely peopled by humanities graduates. Over the years, I have found myself explaining to other journalists how to calculate percentages, that two orders of magnitude greater does not mean double, that animals and mammals are not synonyms, and that CO2 stands for carbon dioxide. There is a lack of contact not only with most of the population, but also with the material world and its physical parameters."
-
Some curious things about Svensmark et al. reference list
Richard Alley pretty much killed the cosmic rays hypothesis here.
At 42:00 he mentioned the Laschamp event about 40,000 years ago, when the Earth's magnetic field was weakened by 75-95% and the flux of cosmic rays into the atmosphere greatly increased. According to Svensmarks idea this should have had a huge impact on the global climate, but it didn't.In Alley's own words:
"We had a big cosmic ray signal, and the climate ignores it. And it is just about that simple! These cosmic rays didn’t do enough that you can see it, so it’s a fine-tuning knob at best." -
nigelj at 05:53 AM on 28 December 2017Fake news is a threat to humanity, but scientists may have a solution
Excellent article, with constructive suggestions.
Alternative facts are a most unfortunate modern phenomenon. One can only despair at this unusual and corrosive development, coming mostly from The White House in a continuous affront to our sanity.
The Age of Enlightemment in the 17th century was based on society sharing objective facts and especially scientific facts, and has led to huge scientific and economic progress. We are in real danger of reversing all this progress.
'Alternative facts' and fake news are a response to a changing world seen as a threat, and IMO are also driven by putting beliefs and instincts above hard objective evidence. It all leads to yet more partisan divisions.
Notice how despite Donald Trumps many hopeless policies and and his poor standard of personal conduct, how he still has a solid loyal base of supporters. An article I read in the NZ Herald (can't find the thing now) observed he maintains some level of support by falsely blaming 'scapegoats' for all the problems in society, including blaming the media, immigrants, or liberal elites. This inflames the public and their prejudices, and distracts attention from what Trump is actually doing so he gets away with it.
All Trump's failings are labeled 'fake news' and blamed on the scapegoats. The Republican Party as a whole does much the same thing at times especially their media supporters like Fox. However more and more people are seeing that "the emperor has no clothes".
The parisian divide in America is driven by complex social and political forces. One thing needs resolution fast: The debate on free trade versus protectionism. Better public understanding of this issue would go a long way to diffuse tension, and partisan divisions. Economic evidence favours free trade, and this needs to be highlighted. Of course it has to have rules, and countries have to abide by those rules. But my point is get the public agreed on a few simple economic basics and this will help unite people.
-
nigelj at 05:05 AM on 28 December 2017US government climate report looks at how the oceans are buffering climate change
Just amplifying my comment. Swayseeker's ideas are interesting and feasible in theory, but look incredibly expensive for what would be achieved. It would cost huge sums obviously just to extract even 1% of ocean heat content given the volumes of heat involved. I would need to see some calculations to be convinced it made sense.
Of course, if some private sector company wants to try such things and sees benefits related to growing crops, then that is their business I suppose.
However it would not be appropriate for governments to spend public money on such schemes. We have three basic options for use of tax payers money1) spend money to reduce emissions and 2) spend money to suck heat out of the system 3) a combination of both
IMO we have to spend all public money money right now on limiting emissions. This is the priority given dangerous climate change scenario. This is economics 101 the best use of scarce resources. I'm talking here particularly about public money and government schemes etc.
If we are successful with limiting dangerous climate change, we can then worry about sucking heat out of the system, if such things are practically plausible.
-
nigelj at 04:44 AM on 28 December 2017US government climate report looks at how the oceans are buffering climate change
Swayseeker wants to spend billions of dollars to extract maybe 1% of ocean heat content.
Just cut fossil fuel emissions. It's too late to do much about heat already in the system.
-
richardtol at 04:14 AM on 28 December 2017How blogs convey and distort scientific information about polar bears and Arctic sea ice
I most certaintly did not "underscor[e] the validity of [y]our conclusion." Quite the opposite, in fact. I argue that your analysis is poor and your data is worse. Your conclusion is therefore invalid.
-
Aaron Davis at 04:10 AM on 28 December 2017CO2 limits won't cool the planet
The serious errors in your grand analysis are::- MAYBE NOT SO SERIOUS but thanks anyway.
(1) You fail to consider the potential magnitude of such a CO2 effect. Are you asking the impossible of your method - trying to use a microscope to measure the distance to the moon or a twelve inch ruler to measure the width of a human hair? If there were a signal to detect, it would perhaps be a fraction of the global response to a 15ppm decrease in CO2 over the preceeding three month period, something less than 0.001ºC perhaps?
a. The potential magnitude of such a CO2 effect can be discerned from the Equilibrium Climate Sensitivity. Here a 100% increase in CO2 concentrations should result in a mean change in temperature between 2oC and 7oC. A decline of 3.5% (-14/400 ppm) should be between -0.07 and -0.245oC. While the 39 year slope is -0.1oC per cycle, the initial 10 year average of 0.24oC is way out of bounds. The standard deviation is 0.79oC, rather than 0.175oC - or 4.5x the expected range. https://en.wikipedia.org/wiki/Climate_sensitivity
(2) The climate of the arctic & Antarctic are greatly different so their annual temperature ranges are going to be vastly dissimilar.
a. I feel this is an excellent comparison since the slant path sun angle, which are predominant effects are normalized. Proximity in time (6 months) removes the year to year variation. Geophysics is a science of removing confounding effects. While the test fails at 15 ppm, I’m careful not to conclude CO2 significance fails at longer time frames of centuries, but at these longer timeframes any hope of affecting an effective Active Thermal Control by moderating CO2 is not feasible.
(3) You appear to be using not temperatures by temperature anomalies over a period in which the 15ppm cycle has operated throughout and thus the effect will be entirely absent within any anomaly.
a. The term anomaly refers to removing a reference temperature to both sequences and has no effect on the results.
(4) You fail to mention the 1ppm sinusoidal Antarctic CO2 cycle which would reduce your raw 15ppm by 1ppm.
a. I agree, for calculations I will refer to a 14 ppm variation in baseline CO2 concentrations (see response 1a).
(5) The results are expressed incoherently. As described the result I obtain does show a non-statistically-significant downward trend but beyond that nothing that could be interpreted as "an average decrease of temperature (negative 0.10oC)" or "the Standard Deviation of the 39 year series is 0.79oC".
a. Yes, I agree the conclusion could be expressed better, but I think you have the main points okay. The negative slope may be in response to an increase in seasonal CO2 variations in later years beyond the 14 ppm swing.
b. I would appreciate it if someone could give me instructions on posting an image. I believe that if Ptolemy had seen what Galileo saw he would have come to the same conclusions.
(6) The "raw dataset" referred to is not the data used in analysis but a broader dataset for the full year. The "clear jump" etc are not evident within the data analysed.
a. The chart I refer to appears ¼ of the way down on the website http://www.climate4you.com/Polar%20temperatures.htm#Recent . Temperature changes in the two Polar Regions shows the jump in Arctic Temperature relative to Antarctic Temperature starting around year 1994. The caption on the figure starts with “Global monthly average lower troposphere temperature since 1979 for the northern (60-82.5N) and southern (60-70S) polar regions, according to Remote Sensing Systems (RSS).”
b. A serious engineer would place more emphasis on the 1.25oC rise in Arctic temperatures from 1994-2017 over what appears to be a modest effect of CO2 over this 23 year time frame.
Best regards.
Moderator Response:[TD] Your use of equilibrium climate sensitivity is completely inappropriate. ECS is estimated only for the entire planet, and is defined to be after equilibration of the entire planetary climate system with the new, now stable, level of CO2. Equilibration takes hundreds to thousands of years. For just some background, see GFDL's post on equilibrium and transient climate sensitivity.
-
PluviAL at 02:13 AM on 28 December 2017US government climate report looks at how the oceans are buffering climate change
Swayseeker: Sorry your comment was axed. No, the scale of civilization, except for CO2 and other carbon related pollution, is relatively small. To act on the scale of the problem requires world wide cooperation at the root of the problem, CO2 emissions.
It is possible to act at the planetary scale, but that requires use of planetary scale tools, such as building tools using the atmosphere itself, which is possible, although we have yet to develop such tools. Solar updraft tower technology begins to work at such a scale, but it is still too small to address the huge scale of ocean heat storage.
However, the atmosphere can engage the oceans' heat as your comment suggests. I like to think in terms of solutions, because if you think only in terms of the problem, as this article shows, is truly awesome, and thus emotionally disabling.
-
Swayseeker at 23:50 PM on 27 December 2017US government climate report looks at how the oceans are buffering climate change
If every city on the coast used heat pumps to extract heat from the ocean and pump it into greenhouses to grow food in (in the deserts and in Arctic regions and so on) it could help a little. Typically one might use 1 unit of energy to move 4 units of heat. Water could be evaporated in greenhouses to humidify air to enhance rainfall. Water could be evaporated in greenhouses to desaleanate it and so on. All this could help move the heat out to space or to grow plants and take carbon dioxide out of the air. Rain moves heat upwards (evaporation at the low side and condensation at the cloud side).
Moderator Response:[JH] Sloganeering snipped. Upon further review, initial decision reversed.
-
Michael Schroeder at 23:34 PM on 27 December 2017How blogs convey and distort scientific information about polar bears and Arctic sea ice
Michael Sweet, thank you for your concise, clear & understated response, which confirms my own evaluation of these sources.
-
MA Rodger at 21:52 PM on 27 December 2017CO2 limits won't cool the planet
Aaron Davis @16,
Always happy to bring delight.
You attempt to calculate the effect of a polar GHG effect resulting from a seasonal 15ppm decrease in atmospheric CO2 concentrations over the arctic in summer. You attempt this by comparing the variation of arctic temperature summer and winter with the same variation in antarctic temperatures. The serious errors in your grand analysis are::-
(1) You fail to consider the potential magnitude of such a CO2 effect. Are you asking the impossible of your method - trying to use a microscope to measure the distance to the moon or a twelve inch ruler to measure the width of a human hair? If there were a signal to detect, it would perhaps be a fraction of the global response to a 15ppm decrease in CO2 over the preceeding three month period, something less than 0.001ºC perhaps?
(2) The climate of the arctic & antarctic are greatly different so their annual temperature ranges are going to be vastly dissimilar.
(3) You appear to be using not temperatures by temperature anomalies over a period in which the 15ppm cycle has operated throughout and thus the effect will be entirely absent within any anomaly.
(4) You fail to mention the 1ppm sinusoidal antarctic CO2 cycle which would reduce your raw 15ppm by 1ppm.
(5) The results are expressed incoherently. As described the result I obtain does show a non-statistically-significant downward trend but beyond that nothing that could be interpreted as "an average decrease of temperature (negative 0.10oC)" or "the Standard Deviation of the 39 year series is 0.79oC".
(6 The "raw dataset" referred to is not the data used in analysis but a broader dataset for the full year. The "clear jump" etc are not evident within the data analysed.
-
Funkypants at 16:45 PM on 27 December 2017Some curious things about Svensmark et al. reference list
Nigelj - I have worked on radio as a news writter & news reader. I have found that most journalist have a profound lack of knowledge of even the basics of science. I got accused of being sexist when I mentioned that only female mosquitoes bite.
-
nigelj at 15:19 PM on 27 December 2017How blogs convey and distort scientific information about polar bears and Arctic sea ice
Alchemyst @9, you ask for "arguments" about why Susan Crockford is wrong. Ok, one of the main things she claims is polar bears will simply adapt to less sea ice. The following two articles explain why this is unlikely, with reference to comments and research by polar bear experts.
www.desmog.ca/2017/11/30/polar-bears-chosen-bizarre-symbol-deny-climate-change-scientists-say
They cover only the main points, but straight away it's possible to see how weak Susan Crockfords views are. If you want the detail use google to find relevant research papers.
As stated by MS above, numbers have increased due to hunting, not climate issues. If Crockford was open and transparent she would have acknowledged this.
However according to the experts, numbers are only increasing in some places, and where they have decreased it appears to be lack of seals due to lack of sea ice as discussed below:
To me this is a good indication of what is most probable long term as sea ice declines.
Clearly the increase in numbers in some sub populations from some moratorium on hunting is essentially a "one off" event that has hidden the effects of climate change, so far.
This polar bear issue is difficult currently in terms of exact numbers, because of measuring difficulties, and many factors influencing their populations, and I think its of more use to ask what is most probable looking ahead. On this issue Susan Crockfords conclusions are implausible.
-
michael sweet at 13:14 PM on 27 December 2017How blogs convey and distort scientific information about polar bears and Arctic sea ice
Michael Schroeder,
The IUCN/SCC Polar Bear Specialist Group is a group of polar bear experts.
Susan Crockford has never studied polar bears in the wild. She has published on dog genetics and some polar archaeology.
Regarding polar bears over the last 50 years, around 1970 the USA, Canada and several European countries passed laws restricting the hunting of polar bears. Before that they were overhunted and the numbers were low. Unsurprisingly, when overhunting stopped the population of polar bears increased. This is urelated to global warming. Not everything is related to AGW.
Crockford and Wrightstone pick 50 years to get the full increase in population from the stoppage of hunting. Somehow they have left off the eplaination of the increase.
Experts are concerned about the future of polar bears.
-
Alchemyst at 13:13 PM on 27 December 2017How blogs convey and distort scientific information about polar bears and Arctic sea ice
Dear moerator
not once have I supported Susan C's views only her right to express them. I have asked you or arguments to bring it down. The only one that I hear is that she is not an expert. please could you please be specific as to why I am censored.
I believe that personalities should be left out of the arguments because I think it is counter productive
Moderator Response:[JH] Moderation complaint snipped.
Please note that posting comments here at SkS is a privilege, not a right. This privilege can and will be rescinded if the posting individual continues to treat adherence to the Comments Policy as optional, rather than the mandatory condition of participating in this online forum.
Moderating this site is a tiresome chore, particularly when commentators repeatedly submit offensive or off-topic posts. We really appreciate people's cooperation in abiding by the Comments Policy, which is largely responsible for the quality of this site.
Finally, please understand that moderation policies are not open for discussion. If you find yourself incapable of abiding by these common set of rules that everyone else observes, then a change of venues is in the offing.Please take the time to review the policy and ensure future comments are in full compliance with it. Thanks for your understanding and compliance in this matter.
-
Aaron Davis at 10:49 AM on 27 December 2017CO2 limits won't cool the planet
Yes, thank you and I’m sorry you seem to take my skepticism personally. And you are correct that I should try to improve the quality of the posts. I would however suggest that, as moderator you could be a bit more charitable. There is a principle in rational discussions that we should try to put counter arguments in the best possible light. With that in mind please consider this preliminary result.
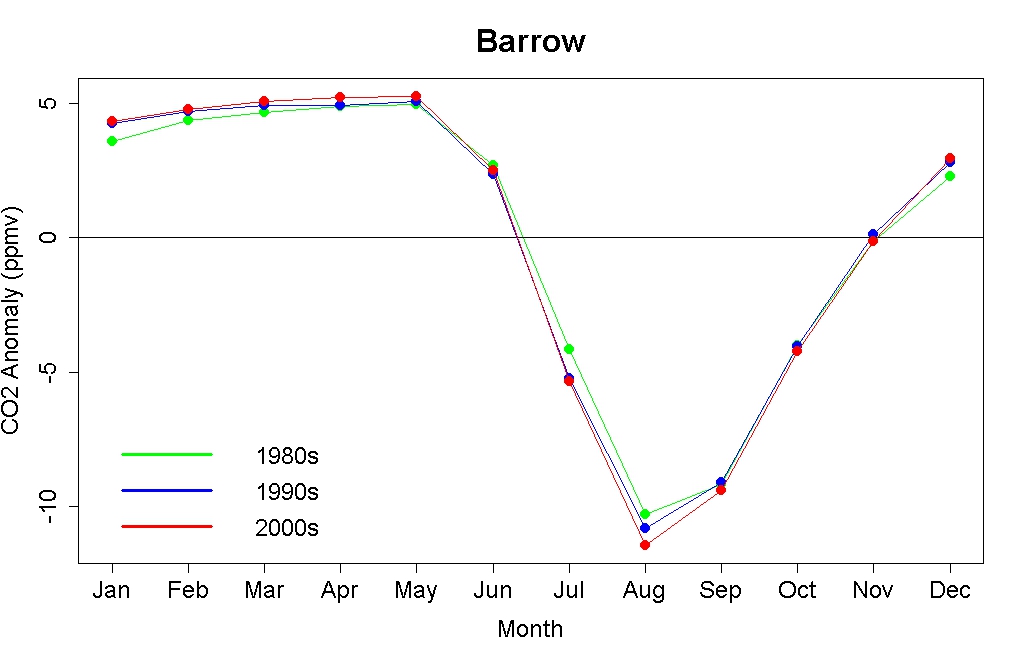
Would you agree that the “fact that CO2 is the primary control knob of temperature” needs a little qualification? It’s obvious that over a 12 hour period, the primary control knob for global warming is certainly not CO2 concentration. However, over a season there are credible reports of significant variations of about 15 ppm in the high Northern latitudes while similar environments in the southern latitudes do not show this level of seasonal variation. See https://www.esrl.noaa.gov/gmd/ccgg/mbl/mbl.html. Another quote from Boston University confirms the statement.
2.2.C. Recent Anomalies in the Global Carbon Cycle
The CO2 record exhibits a seasonal cycle, with small peak-to-trough amplitude (about 1 ppmv) in the Southern Hemisphere, but increasing northward to about 15 ppmv in the boreal forest zone (55-65 degrees North). This cycle is caused by the seasonal uptake of atmospheric CO2 by terrestrial ecosystems. http://cybele.bu.edu/courses/gg312fall01/chap02/chap02.html#oneUsing another reference, let’s see if we can detect the effect of this 15 ppm seasonal variation in Arctic Temperature records caused by the decrease in CO2 levels begining every year in May https://scripps.ucsd.edu/programs/keelingcurve/2013/05/07/why-are-seasonal-co2-fluctuations-strongest-in-northern-latitudes/
For the data I refer you please see “RSS MSU global monthly lower troposphere temperatures since January 1979” http://data.remss.com/msu/monthly_time_series/RSS_Monthly_MSU_AMSU_Channel_TLT_Anomalies_Land_and_Ocean_v04_0.txt
To quantify the effect of CO2 we can examine the differences in temperature between the warm Arctic August/September when plants have removed 15 ppm CO2 concentrations and the same seasonally warm months in the Antarctica (February/ March). The effect we are looking for is a consistent reduction in relative temperature in response to a 15 ppm reduction in CO2 relative to the Antarctic however there may be other effects. To get a handle on these effect we take another difference. Specifically, the difference between stable CO2 concentrations in the cold Antarctic season (August/September) and the cold Arctic seasons (February/March) before the reduction of CO2 concentrations in the Northern latitudes. This 2nd difference provides a baseline.
• T_ant_FM – T_arc_AS = other effects + 15 ppm less CO2
• T_ant_AS - T_arc_FM = other effects
• 15 ppm less CO2 =
• (T_ant_FM – T_arc_AS)_lowCO2inArc –
• (T_ant_AS - T_arc_FM)_highCO2inArc
Where:
• T_ant_FM is Average Temperature in the Antarctic over February and March.
• T_ant_AS is Average Temperature in the Antarctic over August and September.
• T_arc_FM is Average Temperature in the Arctic over February and March.
• T_arc_AS is Average Temperature in the Arctic over August and September.
As expected the effect of 15 ppm less CO2 in the Arctic in calculated over the 39 year data set shows an average decrease of temperature (negative 0.10oC). However the Standard Deviation of the 39 year series is 0.79oC. On a decade or century scale the effect of CO2 may well be more significant but the average over first 10 years of this sequence (1979-1988) is positive 0.29oC, which alone could denying the significance of 15 ppm seasonal decrease in CO2 during the 1979-1989.
In this reference the raw dataset is plotted about 1/4th down the page. www.climate4you.com/Polar%20temperatures.htm . A clear jump and continuous rise in Arctic Temperature Anomaly starting in 1994 is not seen in the Antarctic. What could have happened starting in 1994? https://commons.wikimedia.org/wiki/File:Bp_world_energy_consumption_2016.gifFor one thing Coal took off like crazy, mostly in China producing haze all over the Northern hemisphere including the Arctic. An increase in temperature over the affected area confirms my hypothesis that barriers to both nighttime and daytime radiant cooling is counterproductive.
I would be delighted to read serious challenges to this analysis. Sorry for not referencing other skeptical science articles. My search showed no articles or arguments using “15 ppm”. This argument "CO2 limits won't cool the planet" still seems most appropriate.
Best regards.Moderator Response:[TD] Read Does CO2 Always Correlate With Temperature?--the Basic tabbed pane, then watch the video. Then read the Intermediate tabbed pane.
Then read How CO2 Warming Is Driving Climate.
Then read CO2 Is the Main Driver of Climate Change--the Basic tabbed pane, then watch the video. Then read the Intermediate tabbed pane.
Then read How Do We Know CO2 Is Causing Warming?--first the Basic tabbed pane, then watch the video there. Then read the Intermediate tabbed pane, then the Advanced one.
Then watch climatologist Richard Alley's lecture The Biggest Control Knob.
-
Eclectic at 07:55 AM on 27 December 2017Analysis: How could the Agung volcano in Bali affect global temperatures?
DwainS , I fear I expressed myself poorly. As you are doubtless aware, the nett global warming effect [currently two-point-something watts per squ.m, worldwide ] can only produce a slow rise rate in surface temperature, owing to the "braking effect" caused by the large thermal inertia of the ocean. ( If we had only an ultra-shallow ocean, then the rise rate would be quite steep. )
Two or three years after a major volcanic eruption, the planetary surface temperature "rebounds" to that slow rise rate [graph line], and appears to have returned to the original/pristine line of rise. You are right, in that the planet system has not received that two watts of input during the year (or three) — and so it must contain less heat energy than it would have had, without the eruption's interference. And the graph line must actually be running a notch lower than the pre-eruption line. But the large ocean mass means that the difference between the extrapolated graph line and the actual observed/measured line, is a difference which is too small to see.
Yet the brief/transient change in the "low-mass" shallow surface region, gives a spectacular but brief temperature dip during that year or so. Until pre-existing oceanic heat redistributes itself, and the shallow surface region (where we live) appears to have returned to its previous slowly-rising state . . . with obvious-to-everyone global warming & melting ice.
-
Michael Schroeder at 07:40 AM on 27 December 2017How blogs convey and distort scientific information about polar bears and Arctic sea ice
Interesting discussion of Susan J. Crockford's work on polar bears. I wonder if you could offer your professional assessment of her "Polar Bear Science" website, in particular her claim that polar bear populations have been stable or increasing since the 1970s. I ask because I'm reviewing the climate change denialist Gregory Wrightstone's book, "Inconvenient Facts," and on pp. 98-99 he identifies what he calls "Inconvenient Fact 52 ("The population of polar bears is growing") and "Inconvenient Fact 53 ("There are more polar bears now than we've had for 50 years."). The chart in the book showing increasing polar bear populations cites SJ Crockford (2015), "Polar Bear Population Estimates, 1970-2017). wp.me/p2CaNn-gP2" (the URL takes you to her Polar Bear Science website).
A related question: is the "IUCN/SCC Polar Bear Specialist Group" website reliable and authoritative, in your view? It certainly seems to be. Or, a better question: What are the most reliable sources on polar bears & anthropogenic climate change, in your view? Thanks in advance for any help you might offer.
-
michael sweet at 07:34 AM on 27 December 2017Scientists debate experimenting with climate hacking to prevent catastrophe
Aaron Davis,
On this current thread people are discussing how volcanoes cool the Earth. Volcanoes cool the Earth by releasing large amounts of SO2 into the stratosphere. The experiment has been done and SO2 cools the Earth.
Your claim that SO2 does not cool the Earth is uninformed ranting. Look at the data that thread if you have any questions.
-
Tom Dayton at 05:53 AM on 27 December 2017Analysis: How could the Agung volcano in Bali affect global temperatures?
Dwain: CO2 increases persist for a really, really, really long time. So an increase of CO2 during a short period of decreased insolation (due to reflective volcanic aerosols) still is trapping an increased amount of energy during and long after those aerosols have fallen out. In contrast, a pause in the increase of CO2 would have the sort of effect you were thinking should happen.
-
MA Rodger at 04:10 AM on 27 December 2017CO2 limits won't cool the planet
Aaron Davis @3,
Whilst being off topic, it is probably appropriate to address here the deficiencies in your "facts" analysis.
The level of CO2 in the terrestrial atmosphere is today about 620 ppm by weight or 0.062%. Martian CO2 levels are perhaps 98% by weight. These are the figures that should be used if you wish to calculate kg of CO2, rather than your ppm-by-volume values. With the Martian atmosphere 0.6% the pressure of the terrestrial atmosphere and gravity 38%, the number of CO2 molecules a photon has to negotiate within the Martian atmosphere, relative to the terrestrian one, is thus about 25 times, or there abouts.However, the direct comparison of Martial temperatures with terrestrial ones is dependent on more than just the presence of GHGs. As a first approximation, Mars is 151% further from the sun than Earth but has 82% of the albedo, so Earth absorbs 1.51^2 x 0.82 = 187% (1/53%) more warming. If we accept the widely quoted average terrestrial temperture of 288 K and GHG effect of 33 K, the non-GHG temperatures would be 255 K for Earth and 218 K for Mars.
The comparison of noon-day equatorial temperatures on Earth & Mars is a poor measure of global temperature given the terrestrial diurnal range is perhaps 10 K (or less at Manta )while the Martial equivalent diurnal range has been measured at 125 K. Even in the middle of the Sahara Desert, far from the moderating effect of oceans and with H20 and cloud greatly reduced, the terrestrial dirurnal range is shown as 15 K, a level of magnitude smaller than for Mars.
A fuller account is perhaps required. The actual average Martian temperature is still not accurately measured. Results from modelling variously quote values roughly 218 K suggesting a minimal Martian GHG effect, and even the surface temperature lower than the effective radiative temperature (Covey et al 2012), although only when simplistically calculated (Haberle 2012). The 25 times Martian CO2 levels should not be seen as providing a large GHG effect.
A simplisitc calculation for the direct CO2 impact on terrestrial climate CO2 levels increased 25 times today's would suggest (from 4.5 doublings) a direct temperature increase of 4.5 K to which should be added the CO2 contribution from today's CO2 levels. Today's full GHG effect is widely quoted as 33K and CO2 has been calculated would provide 26% of this in the absence of other GHGs (as the situation on Mars). Thus the 25x CO2 effect would total 4.5 + 8.6 = 13.1 K from a total of 58Wm^-2 forcing.
At first glance, this 13.1 K/58Wm^-2 GHG effect for the terrestrial atmosphere on Mars appears entirely absent. (The 218 K Martian temperature as a black body would roughly radiate equal to the Martian solar warming of 53% terrestrial as set out above.) However there are three adjustments required for such a finding.
Firstly, the effect occurs in a cooler climate with less radiation flying about. This reduces the warming to 12 K with 31Wm^-2 forcing when the total radiative spectrum is considered pro rata. There is further reduction as the radiation in the region impacted by CO2 is less significant overall at such temperatures. Thus the full less-radiation-about adjustemnt results in roughly 10 K with 26Wm^-2 forcing.
Secondly, the effectiveness of the GHG effect on Mars will not be equally efficient as on Earth. Indeed more serious calculations (eg Clive Best) suggest the thin and cold Martian atmosphere would be warmed by perhaps just 12 Wm^-2 of foring which calculates as just 4 k additional to a 218 K planet. (I assume the 2 K value set out by Clive Best is a a mistake.)
Thirdly, with no oceans and only a thin whispy atmosphere, a warming Mars has naff-all to heat up except the rocks (just like on the moon). So not only is there very little thermal mass in the atmosphere (1% of the terrestrial atmospheric thermal mass), Mars also lacks having two-thirds of the planet kept at a constant temperature throughout the diurnal cycle due to 4km-deep oceans. As a result, Martian day-time temperatures skyrocket and leak significant energy away as a result. And come night-time, temperatures plummet. The full night-time atmospheric temperature drop experienced in Earth over 12-hour is equalled in just 8 minutes on Mars. This is thus large diurnal range and is significant for the global average temperature as maintaining a constant temperature is radiatively more efficient than having big diurnal temperture ranges. The moon's diurnal range, for instance (although an extreme example with zero GHGs & month-long days) has an average temperature 50 K lower than the temperature that could be maintained as a black body with the same radiative losses (this calculated using the data presented in Williams et al (2017) Fig 9a ). On Mars, such 'radiative inefficiency' is much less but still bigger than the GHG effect of 4 K (seemingly) calculated by Clive Best.
Subject to any mistakes of my own, this accounts fully for the lack of GHG effect warming Mars apparent from simplistic analysis.
Moderator Response:[TD] Other moderators: Perhaps this comment could be part of the yet-unpublished counter to the argument that Mars should be warmer?
-
Aaron Davis at 03:42 AM on 27 December 2017Scientists debate experimenting with climate hacking to prevent catastrophe
Suggesting earth can be cooled by emitting surfur dioxide into the atmosphere and by brighting clouds neglects evidence that the thick layer of sulfur dioxide in the upper regions of Venus, making Venus the most reflective (and hottest overall) object in the solar system is at least partially responsible for heating the surface of Venus to 462oC.
While the sun produces much more radiation over a wider spectrum than the surface, it is limited to a cosine pattern from 6am to 6pm earth day relative time, with a net positive heating effect occuring between 9am and 3pm in general. It is further reduced by latitude and tilt of the sphere as well as slant path through the atmosphere. To maintain a stable temperature earth radiates to space over the remaining 15 hours. Space at close to a 0 absolute temperature (-270oC) is just as powerful in rejecting since it is a constant rate independent of latitude, tilt, and slant path length even though over a narrower infrared band. Adding sulfur dioxide to the atmosphere will stop that nighttime rdiative cooling effect and cause the planet to warm abruptly. If SRM can be limited to daylight hours, reducing the peak daily temperature, it may be benificial. However, the highest, driest deserts can experience a 27oF swing in temperature (Kufra, Libya) since the nighttime cooling rate is faster in dry thin atmpsheres than in moist, low altitude environments where temperature change from day to night is less than 10oF (New Orleans, La). My hypothesis is that if Sulfur Dioxide were added to the atmosphere above Kufra, Libya both during the day and night temperatures would rise abruptly. While less peak energy would be available to heat the surface, the deminished nighttime cooling effect would last all night. Radiative heat is a driving force, but unlike linear pressure changes, pressure radiation flux goes up as the 4th power of temperature [Stephan Boltzman's Law], so higher midday surface temperatures drop faster at night, than cooler solar shaded daytime surfaces.
- Space is an equally effective cooling mechanism over the entire nighttime interval in stable climates.
- Space cooling is not subject to seasons or latitude.
- Space cooling drops faster from higher temperatures than lower temperatures giving more time to reject heat.
- A reduction of nighttime radiative cooling has a larger impact that a reduction of daytime radiative heating.
Therefore, SRM, if allowed to affect nighttime radiant cooling is a particularly contraproductive approach to achieving stable climates.
A better approach would be to 1) reduce water vapor and cloud cover at night using 100,000 per day commercial air flights to affect weather modification and tto 2) remove high latitude polar winter sea ice using year-round Arctic Shipping. This approach is feasible as it could improve the cooling effect by 50 W m-2 over 4% of the earth and completely offset the 12.5 ZJ per year global warming to achieve active thermal control.
-
michael sweet at 02:32 AM on 27 December 2017CO2 limits won't cool the planet
Aaron Davis,
This is a scientific blog. Posters are expected to support their posts with links to the peer reviewed literature. Since you never link any supportive data and you make many basic mathmatical errors in your calculations, your arguments hold no weight. Since you have not supported your arguments, and they show no knowledge of physics, they can be dismissed as "wildly incorrect" by an informed reader.
When you have to ask to have a previous post removed due to gross errors you have no standing to slander the moderator who is trying to help you learn the basics. You cannot claim you are an expert when you have to ask to have a post removed in the same breath. Your claims demonstrate a basic lack of understanding of physics and also reek of the Dunning-Kruger effect.
Please try to raise your game. You must cite the peer reviewed literature if you want to be taken seriously. If you contradict the literature without any support (for example stating the CO2 is not the primary temperature control) you are not convincing.
Pick the issue that you want to learn about. I suggest the fact that CO2 is the primary control knob of temperature. Focus on that until you understand why you are currently wrong. Until you understand the basics you will never understand more complex issues. Hint: if scientists agree on a point and you disagree it is not the scientists who are wrong.
-
Aaron Davis at 01:59 AM on 27 December 2017CO2 limits won't cool the planet
Thank you again for your patience and quick response, and your suggestion that I comment on other articles you suggest is good.
If you could, please help me correct my post on the "secondary waste heat" article since I appear to have flipped the division at the end. Heat loading from inefficiency of human consumption of heat energy (50% at best per Carnot's Law) is only 4% of the earth's reported heat accumulation not 20x. Please delete that post, I will repost to the linked discussion.
Also please send me the link to instructions on posting images. The graph of power flux vs temperature and humidity I posted to IMGUR, and linked here apparently was not effective.
I sincerely appreciate your "sloganeering" policy. But, what is the term for stating flatly a concept "wildly incorrect", and subsequently miss-quoting a contributor?
Using your perfectly acceptable car analogy, would have people believe that it is the glass that generates heat (analogous to CO2) rather than the cars inside surfaces. As I've tried to explain, a better analogy is that GHGs act as a valve, not a heat source like the solar radiation, or surface temperature or waste heat from a heat engine. To me, push the concept that CO2 is a forcing factor is more "sloganering" than accepting that GHG has a better analogy as a valve in a Rate Process illustration.
Also, I believe you miss-quoted me "CO2 blocks as much energy coming from the Sun as it blocks leaving the Earth". What I said was that emissivity is a multiplying factor for black body radiaton. Downward solar and upward earth radiation have different spectras, but in both cases humidity and clouds (a reflective component) are principle effects felt on the day to day cycle, while CO2, methane are minor compnents felt on decade/century scales. On a seasonal basis, even a 15 ppm seasonal variation of CO2, caused by the gowth/decay cycle of the Boreal Forest is not a perceptible contributor to Arctic temperatures relative to the Antarctic at similar latitudes, but without the levels of CO2 variation on a seasonal time frame. If this is not the main point of this argument [CO2 limits won't {this century} cool the planet] please excuse me.
Mr. [TD], it may not be your fault that you cannot accept my claims. You may not have the background to do much more that than point to articles that may or may not support your position. That's okay. I've been told that without dozens of peer reviewed Journal articles, even well trained scientists will back off of their stongly held beliefs. It seems the smarter one is, the better they are capable of rebutting serious challenges, even if they're wrong.
Moderator Response:[DB] Inflammatory snipped.
Please note that posting comments here at SkS is a privilege, not a right. This privilege can be rescinded if the posting individual treats adherence to the Comments Policy as optional, rather than the mandatory condition of participating in this online forum.
Please take the time to review the policy and ensure future comments are in full compliance with it. Thanks for your understanding and compliance in this matter.
Also please note that the burden-of-proof is on you to support your claims with citations (preferably in the form of linked citations) to credible sources. Just saying "nuh-uh" is not sufficient to overcome being disproved by another commentator or another moderator.[TD] See if the SkS Analogy 3 helps you understand. Then read SkS Analogy 9. Then SkS Analogy 6. Then SkS Analogy 10.
-
DwainSchroeder at 01:55 AM on 27 December 2017Analysis: How could the Agung volcano in Bali affect global temperatures?
Tom-4, I have thought about it some more, and since CO2 would always drive tempertures back to an equilibrium state, perhaps that is the most straight forward explanation. Ocean thermal inertia would also be part of it in the big picture. I'll keep thinking...
-
DwainSchroeder at 01:30 AM on 27 December 2017Analysis: How could the Agung volcano in Bali affect global temperatures?
Thanks for yor explantions.
Rob-3, I agree that we should expect a future eruption to create the same effects as past ones, so I should have clarifed in my question why any eruption would not have reset the trend line. But your answer and logic is spot on.
Tom-4, I agree that the CO2 forcing would continue to accumulate during the eruption event, but I don't see how by itself it would necessarily generate a catch-up action that would put temperatures back on the same trajectory as before. I'll have to think about that some more.
Eclectic -5, I agree that the oceans would have a strong smoothing effect. I just didn't think it would be that profound, but in giving it more thought that has to be it. I suppose that idea supports the arguement that global air tempertures would continue to rise for some period even if all positive forcings were to stop.
Thanks again for your answers.
-
Eclectic at 22:14 PM on 26 December 2017Analysis: How could the Agung volcano in Bali affect global temperatures?
DwainS @2 , possibly the explanation you seek is involving the bigger picture of global warming. With 90+% of planetary heat gain going into the ocean (including deeper levels), then the thermal mass/inertia of the ocean provides a "smoothing effect" on the temperature fluctuations of the thin surface layer (the boundary layer of the atmosphere, plus a half-metre of soil/rock, plus a few metres of ocean surface).
In other words, the planetary surface temperature that you see recorded over the past half-century, is the result of the aggregating effect of ocean thermal mass — which includes the brief "negative heating" periods of Pinatubo, El Chichon, and other major eruptions. And so you would expect the graph line [representing planetary surface temperature] to appear to bounce back onto the original upward trend line.
If we were without 99.9% of the ocean's depth, then logically you would be right — and we would observe (after each major eruption) a sawtooth ratchet-like rising graph line, with the surface temperature re-setting to a lower point each time (before climbing rather steeply . . . until the next big eruption knocks things down a peg, once again).
In reality, all we are seeing is the smoothing interaction between the greater mass of the ocean, and the fast-responding thin surface layer (the thin layer we experience and record as planetary surface temperature — and which shows the visually-impressive "dips" with each eruption).
-
NorrisM at 16:36 PM on 26 December 2017Scientists have beaten down the best climate denial argument
nigelj @ 1
I agree with you that modelling our climate system seems to be very challenging. There is a fascinating exchange going on between Patrick Brown and Nic Lewis on the Climate Etc website relating to the Brown and Caldiera paper. It is a very respectful discussion between these two. There are a number of bloggers who have thanked Brown for venturing onto that blog to defend his paper. For the climate scientists on this website I highly recommend it to them.
Attempting to understand this dialogue between Brown and Lewis just confirms my view that I have to leave the relevance of global climate models to the experts. It is hopeless for someone without a lot of science behind them to even begin to understand these issues. I have to admit that trying to debate this issue on a Red Team Blue Team exercise televised to the American public would put everyone to sleep because they would have no idea what they are talking about. Not that a Red Team Blue Team seems to be in the works in any event.
The underlying "niggle" I have in seeing the success of the models predict actual observations (or within 10-15%) is the "tuning" that has gone into the models before they have been submitted to the IPCC for acceptance into the group of models "averaged" to come up with their predictions (or is it projections?). If this "tuning" was only to insert actual values for volcanoes and El Ninos then that is fine but the IPCC has acknowledged that they do not investigate what considerations have been taken into account as part of the tuning. If someone requests an citation for my last comment, I can provide it.
-
Tom Dayton at 15:24 PM on 26 December 2017Analysis: How could the Agung volcano in Bali affect global temperatures?
Good question, Dwain. During the temporary reduction in solar forcing due to its offset by reflective aerosols, greenhouse gases continue to accumulate. So those GHG forcings are on their original trajectories.
-
Rob Painting at 15:11 PM on 26 December 2017Analysis: How could the Agung volcano in Bali affect global temperatures?
Dwain - Note the observed global temperature response to the large volcanic eruptions of the late 20th century provided in the first image. Why would you expect a future eruption to behave any differently?
-
DwainSchroeder at 14:43 PM on 26 December 2017Analysis: How could the Agung volcano in Bali affect global temperatures?
The first graph from Berkeley Earth seems illogical. The trend line has a relatively constant positive slope when there is no volcanic action, which is reasonable, all other forcings staying constant. When volcanic action does occur the slope changes (swings negative) which is also reasonable. But why does the trend line completely recover after the volcanic action is over, as if the volcanic action never occurred? Would not have the lower energy input into the earth's air, water, and land during the volcanic action caused a permananet "reset" in the trend line, still perhaps continuing on about the same positive slope, but at a lower starting point? I realize I am analyzing in a very basic and simplistic manner, but what am I missing?
-
nigelj at 12:27 PM on 26 December 2017How blogs convey and distort scientific information about polar bears and Arctic sea ice
Alchemyst @6, I will clarify:
1) The denialist community presents Susan Crockford as an expert in polar bear science, when she clearly isn't. So this is a missrepresentation. (If anyone is using the "argument from authority" the climate denialist community is.)
2)Of course she has a science degree and is entitled to present her theories and they should be judged on their merits. She is not automatically wrong because she lacks expertise. However as a non expert she requires some extra scrutiny of some aspects of her work. This is commonsense.
And when she voices little more than an opinion, without much of anything in the way of supporting data or a specific mechanism, then the specialist expert has more credibility. And some of what Crockford says is little more than opinion.
3) There are many voices screaming for attention and only so much time. We should always firstly consider the views of the real experts. They must always at least take priority.
4) When we do look at susan Crockfords views and conclusions, they just fail to be convincing for a whole range of reasons all based in evidence. The well established facts you talk about do not support Susan Crockfords conclusions.
Right now in regard to personalities and mud slinging, Michael Mann for example has had death threats, been called every name imaginable, to pick just one example. Most of the mud slinging is coming from the climate denialists from what I have seen, and its serious mud slinging.
-
Alchemyst at 10:39 AM on 26 December 2017How blogs convey and distort scientific information about polar bears and Arctic sea ice
Thanks, nigel, Eclectic and Philippe.
You are still going back to authority. It should not be used to support an argument.
With regards to niels Bohr, he came to Cambridge to study with Thomson the discoverer of the electron. Now Bohr had gained his PhD in Copenhagen on the theoretical studies of the electron in metals. He had done little practical experimentation. The university did not have a physics lab! From the accounts he was not regarded highly by Thomson and his ideas on the electon were not taken up. As a consequence he dropped out of Cambridge and his work to the scietific community was lost for a decade. Yet the ideas of electrons in metals that were worked out by Bohr in his PhD thesis are our current understanding. Yet it was decade later that they were being begining to be accepted in physics. Bohr dropped out Cambridge and went to the then poorly regarded University of Manchester where again his genius was allowed to flourish. Thomson the then great authority (he even had a nobel prize in the topic) on the electron had got Bohr, a man who had to a great extent taught himself physics and spoke poor English, wrong.
I am a profesional scientist and I hear all the arguments about global warming and they all hold less weight than that the winter snow cover on the mountans that I remember as a child is nowerdays much less.
There is too much on personalites and projections used as fait accomplis and not enough on well etablished facts.
Moderator Response:[JH] Off-topic and sloganeering snipped.
Please note that posting comments here at SkS is a privilege, not a right. This privilege can be rescinded if the posting individual treats adherence to the Comments Policy as optional, rather than the mandatory condition of participating in this online forum.
Please take the time to review the policy and ensure future comments are in full compliance with it. Thanks for your understanding and compliance in this matter.
-
michael sweet at 09:40 AM on 26 December 2017Waste heat vs greenhouse warming
Aaron Davis:
In post 30 you say: "Assuming a 50% efficiency". The internal combustion engine in your car is about 25% efficient at its most efficient RPM. When you apply the brakes you covert any usable work into waste heat. Ultimately, all the potential energy in the fuel is converted into waste heat. Most processes in society ultimately yield no usable work, all the input energy is converted into waste heat. Your calculation would be much more accurate if you used a 100% connversion for energy into waste heat.
Your choice of 50% demonstrates that you have no basic knowledge of thermodynamics and no idea how to do your calculation. Combined with your attitude that you seem to think you know it all, why should I engage with you?
If you actually read the links the moderator gave you, you will be able to make better arguments. It is generally better to work on one issue at a time. Choose the problem you are most interested in and focus on that.
-
nigelj at 06:51 AM on 26 December 20172017 SkS Weekly Climate Change & Global Warming News Roundup #50
In all this discussion we are forgetting a difficult issue. More beef and dairy cattle equals more methane production.
-
ubrew12 at 05:40 AM on 26 December 2017Some curious things about Svensmark et al. reference list
Q. How do cosmic rays cool the stratosphere?
A. It's cosmic. You wouldn't understand.
-
nigelj at 05:19 AM on 26 December 2017Some curious things about Svensmark et al. reference list
It's not just Svensmarks research paper that has an apparently unbalanced or unusual list of source material. The telegraph in the UK has similar issues, and so do other similar media. It ran an article on this latest Svensmark 'research' as below.
www.telegraph.co.uk/science/2017/12/19/exploding-stars-influencing-weather-scientists-find/
Notice how the article presents the research in a way that says 'scientists' have made a strong connection between comsmic rays and global temperatures. This leaves the impression this is breakthrough proven research, when this is just not the case.
At no point in the article do the journalists say Svensamarks ideas have already been refuted by most climate scientists. At no point do they give an alternative view to Svensmark, or quote other research papers. They may eventually do an article critical of Svensmarks research, but my experience is it doesn't happen often or is so much later nobody reads both or connects them.
This is partly how climate denialism spreads. People read this material and gain a clear impression cosmic rays are absolutely proven to be a huge factor in climate, when they aren't. The general media create these unbalanced impressions repeatedly. IMO It's just pure journalistc incompetence, bias, laziness, and attention seeking hubris.
In addition, cosmic rays have been at record levels over approximately the last decade, and so should have been causing a cooling effect. Instead warming has been especially strong, so if cosmic rays have an effect it looks very weak. Again nothing on this from the media.
-
Aaron Davis at 01:53 AM on 26 December 2017CO2 limits won't cool the planet
Yes, and water vapor and cloud cover are controlable on an hourly time frame using airborne weather modification methods, as demonstrated during the Beijing Olympic Games. http://www.businessinsider.com/china-sets-aside-millions-to-control-the-rain-2016-7
Let's step back and consider global warming as just another rate process and use a water tank as an analogy. Rate is proportional to the driving force - pressure in the tank, and temperature in heat flow. It also is proportional to the cross section of the conduit - valve in the tank and emissivity in radiant heat flow. Rate is inversely proportional to the path - tube length in the tank and slant path through the atmosphere for global warming. The tank fills on a cosine profile during the day through a valve controlled principly by cloud cover, and water vapor valves. In comparison the CO2 and ozone are tiny valve, but useful on a decade or century scale, while the main players effect is felt immediatly causing changes in temperature - water level - in 10s of degrees, as much as 50 W m-2, while CO2, which changes every season in the Arctic by 15 ppm, hardly registers when compared to the same Antarctic latitudes where CO2 concentration changes from summer to winter is much less.
The output of the tank is also controlled principly by the moisture and cloud cover factors as well. Human energy consumption from non-renewable nuclear and fossil fuels acts like a burner under the tank. Moving heavy industry to thin, dry desert environment can provide them their own wider output valve. Moving sea ice off the Polar Winter sea increases the driving force - temperature difference - increasing the rate.
What we're shooting for is a Global Active Thermal Control System. I'm not saying the Passive Thermal Control (CO2) - analogous to the shell of the spacecraft is not important, just that it's insufficient to maintain a stable climate.
Moderator Response:[TD] It appears you are not reading any of the material I've pointed you to, not even attempting to understand it, because you are not even arguing specifically against any of that material. Instead you are merely repeating your wildly incorrect claims. That is called "sloganeering" and is prohibited on this site. If you'd like to engage in commenting on this site, address the specific topics on the specific threads addressing them. You might start with your incorrect belief that CO2 blocks as much energy coming from the Sun as it blocks leaving the Earth; discuss that on the "Nutshell" post I gave you. Then address your incorrect understanding of the 2nd Law of Thermodynamics, on that thread. Then actually read the publication linked in the Waste Heat thread (preferably the one I linked for you, not the secondary one you commented on). Then make your claim about the ability to control global humidity on the water vapor thread I pointed you to; for that one you must demonstrate that the dependence of humidity on temperature can be overcome on a global scale. Finally, if you want to make claims specifically about geoengineering, find an appropriate thread for that, such as Scientists Debate Geoengineering.
-
chriskoz at 20:11 PM on 25 December 2017From the eMail Bag: Carbon Isotopes, Part 1: The Basics
bozzza@16,
Indeed, @15, I should have said that bozzza@14 post is "of topic" and not "troll". I appologize for using the wrong term and the implied offensive language.
-
bozzza at 16:25 PM on 25 December 2017From the eMail Bag: Carbon Isotopes, Part 1: The Basics
ChrisK: are you sure you know what a troll is?
How many times have you caught me promoting fossil fuels buddy??
You don't own the internet.. or are you such a huge troll that you actually do?
-
NorrisM at 16:16 PM on 25 December 2017Analysis: How developing nations are driving record growth in solar power
Dugga12 @ 12
Hang in there and provide comments. Sometimes you will get somewhat negative reactions from some posters but I think it is valuable to this website to have some commenters who accept the fact of AGW but are not completely sold on wind and solar as solutions given their intermittency.
I similarly have thought that nuclear power was being neglected as a non-polluting alternative source of energy. I have to admit that reading the two Abbott papers (a professor in Australia) certainly has "cooled me" (excuse the pun) on the potential of nuclear power to supplant fossil fuels. I think it was michael sweet who first directed me to the Abbott papers. The real issue raised in my mind by the Abbott papers is the question of whether we really have enough uranium left in the world to supplant fossil fuels (leaving aside thorium and reprocessing). But another point made by Abbott relates to the actual number of nuclear plants that would have to be built in the US. I cannot remember the number but it was fairly staggering.
If you would like some up to date information on the "history" of why the US turned away from nuclear power in the 1970's, you may want to look at the Climate Etc website which has a recent posting on this. It also delves into why the costs of nuclear power rose so dramatically as a result of the increased regulation. There is another article on various alternative energy choices for Texas which makes for interesting reading.
I have to admit that Abbott convinced me of the logic of focussing on thermal solar power rather than PV solar power but this Sks website is not dedicated to considering alternatives to fossil fuels but only convincing people that AGW is a serious problem. I still think that we need natural gas electrical generation as the "back up" to any wind or solar solution because of the additional costs of storage (today the only proven one is pumped hydro from what I can see).
-
Aaron Davis at 14:33 PM on 25 December 2017CO2 limits won't cool the planet
Is it true that GHG delays energy flow from sun to earth proportional to solar intensity during the day, and delays energy flow from earth to space at night? If so, I don't understand your claim "no special leverage from reducing insulation at night rather than in day." In fact this leverage is exquistly controlable and substantially more effective than reducing GHG both at night and day.
Moderator Response:[TD] The wavelengths of radiation that greenhouse gases absorb are only a small portion of the radiation from the Sun, but a large portion of the radiation emitted by the Earth. Please read Global Warming in a Nutshell.
Prev 313 314 315 316 317 318 319 320 321 322 323 324 325 326 327 328 Next


