


 Arguments


Recent Comments
Prev 391 392 393 394 395 396 397 398 399 400 401 402 403 404 405 406 Next
Comments 19901 to 19950:
-
Tom Curtis at 10:04 AM on 18 April 2017Humans on the verge of causing Earth’s fastest climate change in 50m years
chriskoz @1, while the IEA only estimated 728 Gt (=728 Pg) of coal reserves in 2010, they estimated 17,204 Gt of coal resources. The difference is that while reserves for reserves, they are recoverable given current mining technology, they are also economic to recover at current prices. Resources in excess of reserves are also recoverable given current technology, but are not economic to recover at current prices. The transition from resource to reserve can be quite rapid given changes in technology and/or increased demand. It follows that the Twink12K (ie, 12,000 GtC) is well within the limits of fossil fuel resources, and what is within the limit of fossil fuel reserves is a matter to be proven by future technological and economic developments.
That leaves aside emissions from LUC and cement manufacture.
It is unlikely that we would be able to burn that much fossil fuels before the effects of climate change made further burning of fossil fuels politically infeasible (if not necessarilly destroying the infrastructure, which is no more vulnerable than any other part of our civilizations infrastructure). In a world where Trump is President of the US, however, there are no guaranttees.
-
chriskoz at 09:08 AM on 18 April 2017Humans on the verge of causing Earth’s fastest climate change in 50m years
The " Wink12K scenario" is based on this article, speculating the realease of 10Pg anthropogenic C, is the first such scenario I've seen. Apart from being unrealistic (only 5PgC of recoverable FF reserves have been estimated), I think homo sapiens would be technically unable to burn it before the transit climate change effects wiped off or seriously crippled the whole FF burning infrastructure. Then, it comes the increasing awareness that will put more pressure to curb the burning in the future, with possibly other/renewable energy sources replacing it. So, we can safely cross that Wink12K scenario as impossible.
-
Tom Dayton at 05:14 AM on 18 April 2017Human CO2 is a tiny % of CO2 emissions
Pattio: The airborne fraction of CO2 has been fairly constant, despite the growth in the rate of anthropogenic CO2 emissions. Therefore the natural sinks are not static. That determination has been made by scientists who, therefore, do not in reality believe the sinks are static.
-
Cedders at 04:46 AM on 18 April 2017CO2 effect is saturated
Hope this is the right place to point out that Figs 1 & 2 have disappeared from the 'Advanced' article, apparently after Altervista suspended their hosting. They're still available in the PDF and via the Wayback Machine.
Moderator Response:[DB] Updated. Thanks for the heads-up!
-
Jagadees at 03:41 AM on 18 April 20172017 SkS Weekly Climate Change & Global Warming News Roundup #15
Please dont misunderstand what india is doing. we have a religion based fascist government in power. they are painting the color of religion everywhere, so all who get affected by that propaganda reacting with religious theme. Making just one river is sacred is a game for divide and rule and killing innocent people.
-
Bob Loblaw at 02:34 AM on 18 April 2017Human CO2 is a tiny % of CO2 emissions
Pattio: as Michael says, please do provide a reference to support your claim that others hold the position that sinks are static.
The sources that I am familar with (e.g., the IPCC) pretty clearly recognize that about half of what is emitted to the atmosphere (by burning fossil fuels) is abosrbed by the oceans and biosphere (the "sinks"), which directly contradicts two of the claims you made in your opening paragraph:
- ...that others claim the sinks are static (unsupported because others feel that sinks have increased to absorb half of what is emitted)
- ...that your argument counters the claim that the sinks cannot process the increase in emissions (they can't, as evidenced by the fact that they can only process half, with the other half still residing in the atmosphere).
-
MA Rodger at 02:26 AM on 18 April 2017Science of Climate Change online class starting next week on Coursera
curiousd @32.
I have tracked down this Schwarzchild Equation and, rather than the ones that explains the wobbles of the planet Mercury, it is a rather mundane equation that I didn't appreciate had a name and which is explained here. Frankly, I do not see how it could be used with the UoC MODTRAN model in a way that would lead to a misapprehension that emissivity=0.92. As Tom Curtis points out @37, the emissivity value is set out clearly in the output file which would be required reading for any "serious user."
Concerning the effect of using a single MODTRAN calculation as a global average, further rough calculations suggest to me that the impact of latitude and the annual & diurnal cycles do appear to provide enough additional flux above that single average figure to add 1% to 3% to the total. While these rough weighted calculations remain very sensitive to the assumed weightings, the outcome appears quite clear. Tom Curtis @35 adds weight to this finding. Add in the truncated frequency used in the UoC model analysis and the flux values are become very close to the Chen et al (2013) values.
Of course this does not mean there is no room for other approximations with significant effect on the result within the UoC model, or even errors. But if you wish to establish the potential of your "Correction Number Two" and your "Correction Number Three" you will need to present due reason. So far, that has not been done. And failing to explain your ideas, for instance the derevation of the "One km IR Radiance" values in the graph you presented up-thread (ie this graph), is not winning you any favours.
-
John Hartz at 01:40 AM on 18 April 20172017 SkS Weekly Climate Change & Global Warming Digest #15
Joe; I posted the Abstract to the paper you had linked to in hopes that you would acturally read it. If you had, you would see that the researched forcused on a specific location — Bunaken Island (North Sulawesi), Indonesia — with unique sea level rise conditions and for a specific type of coral. For you to suggest that the results of this single study can be extrapolated worldwide is absurd.
The first of the two articles that I linked is not an advocacy article. You actually might learn something by carefully reading it.
-
michael sweet at 01:34 AM on 18 April 2017Human CO2 is a tiny % of CO2 emissions
Pattio,
Can you provide a reference for your claim that someone says sinks are static? I am underthe impression that most of the sinks and sources of carbon respond to changes in the environment around them.
While you article is interesting, it is clear from the measured increase in CO2 in the atmosphere that natural sinks have not been able to absorb all the CO2 humans release. That may change in the future although it is not clear if the sinks will increase or decrease.
-
JWRebel at 01:17 AM on 18 April 20172017 SkS Weekly Climate Change & Global Warming News Roundup #15
@Joe: I should have been more circumspect with my terminology, and avoided "personhood" which has been a more contentious term. Notwithstanding, corporations and other legal entities are considered "legal persons" by the law and are the subject of legal agency, and it is on the basis of this legal agency and the First Amendment rights that inhere in it, that the Supreme Court granted them the right to political contributions and action.
Common sense would dictate that a legal persoon has "personhood", but this is clearly not the case, as everybody recognizes that a "legal person" is no more than a legal artifice. Although universally recognized and employed, the concept of legal "persons" has been criticized in recent decades because it often enables the persons behind such social organizations "to get away with murder."
-
Pattio at 00:47 AM on 18 April 2017Human CO2 is a tiny % of CO2 emissions
The following study published in Nature, April 5th 2017, shows a 31% ± 5% plant growth since the beginning of the industrial revolution. This would counter the claim that "sinks" are static and cannot process the comparatively tiny increase in carbon emissions due to human activity.
Large historical growth in global terrestrial gross primary production http://dx.doi.org/10.1038/nature22030
Large historical growth in global terrestrial gross primary production: "Growth in terrestrial gross primary production (GPP)—the amount of carbon dioxide that is ‘fixed’ into organic material through the photosynthesis of land plants—may provide a negative feedback for climate change1, 2. It remains uncertain, however, to what extent biogeochemical processes can suppress global GPP growth3. As a consequence, modelling estimates of terrestrial carbon storage, and of feedbacks between the carbon cycle and climate, remain poorly constrained4. Here we present a global, measurement-based estimate of GPP growth during the twentieth century that is based on long-term atmospheric carbonyl sulfide (COS) records, derived from ice-core, firn and ambient air samples5. We interpret these records using a model that simulates changes in COS concentration according to changes in its sources and sinks—including a large sink that is related to GPP. We find that the observation-based COS record is most consistent with simulations of climate and the carbon cycle that assume large GPP growth during the twentieth century (31% ± 5% growth; mean ± 95% confidence interval). Although this COS analysis does not directly constrain models of future GPP growth, it does provide a global-scale benchmark for historical carbon-cycle simulations."
Moderator Response:[DB] As others have noted, you will need to furnish a source citation for this claim:
"This would counter the claim that "sinks" are static"
Hotlinked DOI. An openly accessible copy is here.
-
Tom Curtis at 00:28 AM on 18 April 2017Science of Climate Change online class starting next week on Coursera
curiousd @36:
"But as is, ModtranChicago gives in its output no information, either for the assumed emissivity or about the restricted underlying wave number range of 100 wn to 1500 wn.
That user will deduce an emissivity of 0.92, which I now know, but did not always know, is entirely too low."
Anybody using the UChicago version of Modtran will see in the user inteface a button labelled "Show raw model output". If they press that button, a new tab will open showing that output. Scrolling through it, they will see first the details about the atmospheric profile, absorber amounts etc, and will then come to a section labeled "RADIANCE(WATTS/CM2-STER-XXX)", which is then shown for wave numbers from 100 to 1500 cm^-1. At the bottom, the output shows the "INTEGRATED ABSORPTION FROM 100 TO 1500 CM-1". A little below that it informs us that "BOUNDARY EMISSIVITY = 0.980". In short, all the information you claim is not available, for which according to you, there is "no information" in its output, is all available just by pressing a button of mysterious function with the mystical label "raw model output" /sarc.
Beyond the false claim about what was not available in the Modtran output, there is nothing in your comment not dealt with by my comment to which you were responding.
-
curiousd at 23:30 PM on 17 April 2017Science of Climate Change online class starting next week on Coursera
Hi Tom Curtis,
ModtranChicago is designed primarily for aid in teaching basic environmental science, and is an excellent tool for doing so as is.
It is, as far as I know, also the only source available to everyone for free of plots of outgoing OLR values as a function of altitude and GHG composition. Therefore, for someone such as I, who wishes to learn about at least the one dimensional version of atmospheric science on his own with no available guidance, the temptation will be to use the ModtranChicago output; there is no other choice.
But as is, ModtranChicago gives in its output no information, either for the assumed emissivity or about the restricted underlying wave number range of 100 wn to 1500 wn.
That user will deduce an emissivity of 0.92, which I now know, but did not always know, is entirely too low. See the post 31 above.
That user may then be applying the Schwarzchild Equation correctly and still will find very poor agreement with his "Standard" which is the output of ModtranChicago, for the region near 1 km. The user will then go back to the drawing board repeatedly to find his mistake.
-
ubrew12 at 22:37 PM on 17 April 20172017 SkS Weekly Climate Change & Global Warming Digest #15
The NY Times is reporting that this year may bring another El Nino, which would be pretty devastating for the GBR.
-
Tom Curtis at 20:24 PM on 17 April 2017Science of Climate Change online class starting next week on Coursera
curiousd @various, it was established in 1997 by Myhre and Stordal that using a single atmospheric profile in LBL and broadband radiative models will introduce inaccuracies to the calculation. That result was confirmed by Freckelton et al (1998). Myhre and Stordal state:
"The averaging in time and space reduce the radiative forcing in the clear sky case by up to 2%. This is due to the fact that blackbody emissions are proportional to T4 and that averaging reduce or remove spatial or temporal variations."
It follows that if you really want to test Modtran for bias, you would need to use (ideally) 2.5o x 2.5o cells based on weekly averages, and take the means. Failing to do so will introduce a bias, which based in Myhre and Stordal, is approximately equal to 50% of the bias you claim to have detected.
The University of Chicago version of Modtran does not permit that, restricting choices of atmospheric profiles to a Tropical zone, two Mid Latitude zones (summer and winter) and two Subarctic zones (summer and winter). Using default values for a clear sky, and with no GHG I found the difference between the OLWR at 70 km for each case, and for a areal and temporally weighted zonal means, and for the US standard atmosphere at default temperatures, and at a temperature adjusted to match OLWR to the average incoming radiation to have a mean bias of 5.35 +/- 3.69%. Tellingly, the least bias (2.33%) was found with the weighted means. The US standard atmosphere with surface temperature set to 254.5 K showed a bias of 4.19%. Given this, the case for any significant bias in the calculation of OLWR over the range of wave numbers covered by the model is unproven. Given the wide range of biases in different scenarios, it is not clear a single correction factor would work in any case.
Further, the idea that Modtran should be adjusted to determine a single OLWR value seems wrongheaded. Modtran is intended to predict observed IR spectrums given a knowledge of surface conditions, and trace gas and temperature profiles. Here is an example of such a prediction (strictly a retrodiction):

Clearly the University of Chicago version of Modtran is capable of reasonable but imperfect predictions of such observed spectrums. Given the limited ability to reproduce actual conditions (ie, site specific surface emissivity, specific temperature profiles, density profiles, etc) we do not expect anything else, in what is simply a teaching tool. Nor is any explicit bias obvious from the example above, with OLWR at specific wave numbers sometimes being over estimated and sometimes under estimated by the model. If you trully wanted to test Modtran 6 for bias (or for error margin), you would need to compare by wavenumber across a large, but representative range of such site specific profiles.
I have not been following the technical discussion above at any depth, but it seems to me that before you get to that discussion, you need to allow for the known constraints on any radiative transfer model, regadless of its accuracy line by line. Further, you would be better directing the technica discussion to the actual use of radiative transfer models rather than their use (and potential misuse) in testing zero dimensional first approximations of the greenhouse effect.
-
curiousd at 17:59 PM on 17 April 2017Science of Climate Change online class starting next week on Coursera
Regarding:
"What you demonstrate here is that yor correction for emissivity ("Correction Number Three") is duplicating your correction resulting from the limited spectrum under analysis ("Correction Number One"). When you say "(a) You know nothing about the limited wavelengh range" you correct by adjusting the emissivity value ("Correction Number Three"). But we do know about the "the limited wavelengh range" and when we correct for it ("Correction Number One") the flux calculations match blackbody conditions for emissivity=0.98 as the UoC model says it uses."
The 0.92 emissivity result is a problem whether or not one obtains better values for the OLR at 250 K by correction one, or an improved clear sky OLR from correction two. It results in a result for the solution to the Schwarzchild Equation (S E) ,assuming no scattering (two stream approximation), that has entirely the wrong OLR for the 1km distance from ground if the emissivity is 0.98. To the point that instead of a 1 km OLR that is slightly less than the surface ORL, as is the case for 0.98 emissivity, at 0.92 the OLR is slightly greater at 1 km than the surface emissivity.
So consider the "serious user" of MILA who:
1. Assumes that 0.92 is the emissivity instead of 0.98 by doing the simple calculation above comparing the MILS emission from the ground and comparing to the Stefan - Boltzmann law.
2. Correctly numerically applies the SE expression for the outgoing stream in the two stream SE, perhaps applying the SE to only the difference between the 800 ppm and 400 ppm cases for CO2 to get the climate sensitivity. He /She is (unknowingly) using a drastically too low surface emissivity.
3. Since the upstream solution is I^(0) t* plus atmospheric contribution , if I^(0) is (0.92/0.98) factor too small relative to what one gets from MILA, since the atmospheric contribution term is independant of the surface, both the 400 ppm and 800 ppm contributions will be too small relative to what one obtains by just running MILA for 400 ppm and then 800 ppm and subtracting, where the dicrepancy is not much at,say, 20 km but really serious at 1 km.
4. The user will therefore conclude that his/her application of SE is incorrect even though it is not. The user is just (unknowingly) using the wrong emissivity.
Grant Petty states, on his page 215 that the I^(0) term is the "....only term whose value cannot be directly computed from knowledge of (symbol for wave length specific linear absorpion coefficient as function of z ) and (symbol for transmittance as function of z) alone (for given wavelength and viewing direction mu). " He then states:
"The expression we supply for I^(0) depends on what we assume about the nature of the surface. But regardless of those assumptions, there are two contributions that must be considered: (1) Emission by the surface itself, and (2) upward reflection of atmospheric radiation incident on the surface."
I am certain that MILA does not take reflection at the surface into account which is fine for an illustration for students, but then the value of the emissivity of the surface strongly influences both the OLR and the value of intensity 400 minus intensity 800 as function of altitude z.
So back to the serious user of MILA...He/She will think the emissivity is 0.92 instead of 0.98 and therefore get something that disagrees strongly with MILA at 1 km even though that serious user has been applying the SE correctly but whilst (unknowingly) using the wrong emissivity.
-
MA Rodger at 16:52 PM on 17 April 2017Science of Climate Change online class starting next week on Coursera
Curiousd @29.
The 255k-239.7W/sqm is a standard blackbody calculation for emissivity=1 with the outward IR flux matching the absorbed solar radiation, thus the albedo remains from cloud & surface while GHG=0 because it is a blackbody. In terms of accurate measurement/assessment of the flux, today there is an energy imbalance due to AGW.
The UoC model gives 226.363W/sqm for 255K (and altitude =0) because emissivity=0.98 and the model only considers part of the spectrum, the value 226.363W/sqm being not greatly different from the 266.52W/sqm value calculated for the part-spectrum using SpectralCalc.com. (The difference is insignificant and could result from many understandable approximations.) Note the implications of this @31.
Putting #31 to one side and assuming your “corrections to Modtran for 0.98 emissivity” are not what is meant, but rather the +8W/sqm you argue for @7. (I miscalculated this as 9W/sqm @28) I set out @18 why I consider this +8W/sqm to be too high and that a +4W/sqm would be more appropriate. You present no reason for the +4W/sqm being incorrect.The impact of altitude on the flux magnitude has been considered up-thread but as my misinterprettion of your “Correction Number Two”. (Note that I did not indicate the sign +/- @14. In truth I had in mind a positive correction but it would actually be a negative correction.) The UoC model set with GHG inputs as zero does demonstrate a change in flux with altitude but it alters by less than the variation of area with altitude (the square of the effective radius). Thus with all GHGs reduced to zero in the UoC model, we should see a 2.2% reduction from surface to 70km. The actual reduction (varies with surface temperature) is roughly 0.5%. This is probably explained by the continued presence of minor GHGs in the UoC model which are not zeroed but remain unchanged with user input. If this is not the case & if there is no alternative explanation, if it does require correction, this would comprise a reduction of some 4W/sqm for 255K surface and a measured IR flux at 70km.
curiousd @31.
What you demonstrate here is that yor correction for emissivity ("Correction Number Three") is duplicating your correction resulting from the limited spectrum under analysis ("Correction Number One"). When you say "(a) You know nothing about the limited wavelengh range" you correct by adjusting the emissivity value ("Correction Number Three"). But we do know about the "the limited wavelengh range" and when we correct for it ("Correction Number One") the flux calculations match blackbody conditions for emissivity=0.98 as the UoC model says it uses.
curiousd @32.
I am pretty hazy about Schwarzschild but I would not expect there to be a significant gravitational effect (?! I am pretty hazy!) when calculating the radiation flux through a planet's atmosphere.
-
Eclectic at 16:27 PM on 17 April 2017New study shows worrisome signs for Greenland ice
Haze @7
I am surprised that you feel "discussions at Skeptical Science are becoming increasingly constrained, and thus decreasingly informative, due to the current relative paucity of comments on most topics" (unquote)
My own impression (admittedly personal anecdotal) over the past 4 years of frequent observation of SkS, is that there is a good flow of informative discussion in the comments columns. If anything, I feel there is an even higher amount of such discussions than 3 or 4 years ago. On top of that, I must say (from reading many comments columns back to the previous decade) that I noticed fluctuations in activity in most of the lengthier columns — but that is only something to be expected, as new developments and new data come along from time to time. Perhaps, Haze, you are interested in a narrow range of climate topics : and that may have caused you to have a certain bias in your observations.
Possibly the most important factor in discussions is the absolute need (if any!) for any discussions in the comments column! A good many of the articles posted are so straightforward, that little discussion is required — save for the rebuttal of erroneous or peevish disputations that may appear in the comments column.Moderator Response:[DB] Thank you for your fine response, but as the comment you were responding to was moderated, it became necessary to also moderate your comment's response to the off-topic material.
-
michael sweet at 11:41 AM on 17 April 2017Tuvalu sea level isn't rising
The link Rob P posted to the Tuvalu post explains a lot about local sea level rise.
A comment on the OP here: I visited Funafuti in December 1988. Only a very small portion of the atoll is 3 meters above sea level as mentioned in the OP. Most of the island is much lower. According to this Wikipedia article, the average height of Funafuti is less than 2 meters (no date given). This climate report shows knee deep water in the center of town. The island is so small that water from rain runs off immediately, the water would be at sea level. Even in 1988 there were large areas in the village that regularly flooded at high tide. A rise of even a few centimeters would have been immediately noticable. Since they are dependent on ground water for many uses flooding would ruin their water supply.
When you combine that with the fact that the El Nino cycle can raise sea level 20-30 cm (as described in the OP), and consider similar storm surge increases in sea level, it is no wonder that the people of Tuvalu are concerned.
-
michael sweet at 10:18 AM on 17 April 20172017 SkS Weekly Climate Change & Global Warming Digest #15
Joe,
The sea level fall in Indonesia is unrelated to Global Warming. It is caused by the El Nino cycle. When El Nino appears the trade winds lessen. The water piles up on the Eastern Pacific near Peru. Sea levels in Indonesia fall. During La Nina the trade winds blow harder and sea levels in Indonesia rise (and fall in Peru). This animation clearly shows that sea level in 2016 fell in INdonesia while it rose in Peru.
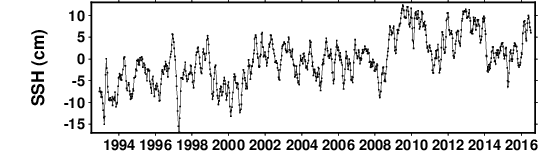
According to AGW theory, the sea level for the entire globe will rise. Local effects are not relevant. In fact, global sea level did rise in 2015-2016 as this graph shows:

Deniers often confuse local sea level effects with global effects. Local effects are not contradictions to predicted global effects. I note that the article you cite claims that sea levels were at a 12 year low. It was not lower than that because sea level rise caused the base to get higher.
-
Haze at 10:18 AM on 17 April 2017New study shows worrisome signs for Greenland ice
I agree that my comment does not relate directly to Greenland and as such is, strictly speaking, off topic. However I am not trying to create a haze but to generate discussion and perhaps through that gain a greater understanding of why Greenland and the Antarctic Penisular react differently to global warming. If this discussion is not relevant then no doubt the moderator will heed the exhortation of PluvIAL at 5 to remove my comment. I would note however that the dscussions at Skeptical Science are becoming increasingly constrained, and thus decreasingly informative, due to the current relative paucity of comments on most topics
Moderator Response:[DB] Continued off-topic snipped.
-
chriskoz at 09:36 AM on 17 April 2017From the eMail Bag: A Deep Dive Into Polar Ice Cores
David@3,
Thanks for your pointers to the rellevant articles. Icidentally (or maybe not) Buizert 2015 is precisely about WDC (WAIS ice core), that I used as an example in my question, so I found it useful. Looks as they estimate Δ-age just on what you've said in the OP: firn densification modeling and ice-flow modeling. The age of ice is synchronized to the
layer-counted Greenland Ice Core Chronology (I did not know that counting of some ice core layers like this one in Greenland was possible like in dendrology). Another variable they used was a data set of δ15N-N2, which is a proxy for past firn column thickness. -
chriskoz at 09:10 AM on 17 April 2017Debunking Climate Myths from Politicians
broadbarrel,
Looks like readers and mods are ignoring your series of requests and I think rightly so.
Because you advocate to engage with current POTUS and his staff about climate science at the level this site represents. Such engagement is simply impossible. To engage with current POTUS about anything (not just climate science) is like descending to a mudpool to resttle with a pig. No one wants to engage in such a dirty fight. Certainly you want to raise the alarm in media when pig's ravagings are becoming dangerous/destructive (and that's how recent political articles on SkS do comment on some POTUS actions) but a sane person must just stop there. It would be more productive to engage in a clean, positive way. Following my analogy, even a pig can do noble things, e.g. help to plough a field in search for truffles. The equivalent of truffles for current POTUS would be money and fame and unlimitted dating of young girls. Again, that's the only level you could engage on, and this site should not be interested in such engagement.
If this post is frowned upon by mods because it goes way too derogatory on my POTUS (I'm US citizen voting in WA state). Even though First Amendment allows me to freely express my opinion hereabove, I still would be liable for defamation if I tried to e.g. say publicly similar thing about an MP in my country. I can't help it, because saying anything non derogatory on my POTUS would be hypocritical for me.
Moderator Response:[DB] Manpower is the sole limiting factor in keeping lists such as the Politicians List updated.
-
curiousd at 08:34 AM on 17 April 2017Science of Climate Change online class starting next week on Coursera
Here is a general description of my knowledge of Atmospheric Physics and how I got where I am with such projects as trying to make sure I have applications of the Schwarzchild Equation correct. I was a condensed matter experimentalist with perhaps 75 publications in refereed journals. I also taugnt Freshman Physics of the Environment for many years. Upon retiring I decided to try and learn how to really calculate quantities such as the CO2 no feedback climate sensitiviy and therefore:
I bought large numbers of Atmospheric Physics books and tried to teach myself; my home institution has no one working there who knows the first thing about Atmospheric Physics, so this project has been attempted without human input or correction. Many hours a day were spent on this project and now three years have elapsed. My Rosetta Stone has been the text by Grant Hill, and I think now I have a decent general idea for a one dimensional version of these things.
But it is my opinion that even though Atmospheric Science is certainly correct, it is explained rather poorly to scientists not in the field and for one reason above all: There is a dearth of numerically worked examples for the most important things. Symbolic explanations alone are insufficient.
How could there be, for example, no worked numerical example for the solution to the Schwarzchild Equation for an atmosphere with 400 ppm CO2 to give the upward flux as a function of altitude? Regular Physics is not like this. The students start out learning F=Ma and then M = F/A. In a more advanced class the solutions to the one dimensional Schroedinger Eq. is worked out for any number of potential well problems. E&M is replete with boundary problems involving Gauss' Law.
I think that not having a worked example for the solution to Schwarzchild Equation, given the transmittance values one now has worked out for the user by SpectralCal, is like having no worked examples of the work energy theorem or momentum conservation.
My mistaken derivation of an emissivity of 0.92 for MILA was one of many stumbles that I have had to deal with. If there were merely a statement on the user output page of MILA that (1) an emissivity of 0.98 is assumed that would be agood thing. And if the statement were made that (2) the wavenumber band the computer uses is limited 100 wn to 1500 wn which can introduce errors so the user should be cautious would also be a good thing.
-
curiousd at 07:53 AM on 17 April 2017Science of Climate Change online class starting next week on Coursera
Regarding "It is also unclear why this would indicate an Emissivity of 0.92."
Here is how you get the emissivity of 0.92.
(a) You know nothing about the limited wavelengh range.
(b) You wish to compare the OLR output of MILA with your efforts as someone who is trying to learn how to use the Schwarzchild Equation.
(c) You therefore determine what the MILA emissivity is (with no knowlege of the cut offs or of the actual 0.98 emissivity)
(d) You therefore go to the U.S. Standard atmosphere and learn that the upward OLR from Modtran looking down from zero altitude, is 360.472 W/m sqd.
(e) You use the Stefan Boltzmann law with emissivity one and T = 288.2 degrees K. You get 391.164 K.
(f) You divide 360.472 by 391.164. Your answer is 0.92
-
nigelj at 06:43 AM on 17 April 20172017 SkS Weekly Climate Change & Global Warming Digest #15
Joe @5, you have a few reefs in Indonesia bleaching, due to a local fall in sea level. Most reefs globally, including the GBR, are bleaching due to global warming. You are not fully reading the articles you list, and you are missing the big picture. You did the same thing on the legal persons issue.
-
joe - at 05:39 AM on 17 April 20172017 SkS Weekly Climate Change & Global Warming Digest #15
John A) As the article explains, and which you acknowlege, the bleaching and mortaility of the reefs is due to the falling sea level, an event unrelated to and contrary to AGW theory with rising sea levels
B) the Second two articles you cite/link are advocacy / opinion pieces.
-
John Hartz at 04:30 AM on 17 April 20172017 SkS Weekly Climate Change & Global Warming Digest #15
Joe: Also see:
The big lie propagated by government and big business is that it is possible to turn things around for the reef without tackling global warming
Australia's politicians have betrayed the Great Barrier Reef and only the people can save it, Opinion by David Ritter, Guardian, Apr 9, 2017
-
John Hartz at 04:23 AM on 17 April 20172017 SkS Weekly Climate Change & Global Warming Digest #15
Joe: The answer to your question can be found in:
Why dead coral reefs could mark the beginning of ‘dangerous’ climate change by Chelsea Harvey, Energy & Environment, Washington Post, Apr 12, 2016
-
John Hartz at 03:55 AM on 17 April 20172017 SkS Weekly Climate Change & Global Warming News Roundup #15
Joe: On the other hand, Citizens United opened the floodgates for corporations to influence elections and the public policy decisions through the expenditure of unlimited amounts of money. The federal government of the US has effectively become a government of big business, by big business, and for big business.
-
John Hartz at 03:47 AM on 17 April 20172017 SkS Weekly Climate Change & Global Warming Digest #15
Joe: Here's the Abstract of the paper you have provided a link to:
Abstract. The 2015–2016 El-Niño and related ocean warming has generated significant coral bleaching and mortality worldwide. In Indonesia, the first signs of bleaching were reported in April 2016. However, this El Niño has impacted Indonesian coral reefs since 2015 through a different process than temperature-induced bleaching. In September 2015, altimetry data show that sea level was at its lowest in the past 12 years, affecting corals living in the bathymetric range exposed to unusual emersion. In March 2016, Bunaken Island (North Sulawesi) displayed up to 85 % mortality on reef flats dominated by Porites, Heliopora and Goniastrea corals with differential mortality rates by coral genus. Almost all reef flats showed evidence of mortality, representing 30 % of Bunaken reefs. For reef flat communities which were living at a depth close to the pre-El Niño mean low sea level, the fall induced substantial mortality likely by higher daily aerial exposure, at least during low tide periods. Altimetry data were used to map sea level fall throughout Indonesia, suggesting that similar mortality could be widespread for shallow reef flat communities, which accounts for a vast percent of the total extent of coral reefs in Indonesia. The altimetry historical records also suggest that such an event was not unique in the past two decades, therefore rapid sea level fall could be more important in the dynamics and resilience of Indonesian reef flat communities than previously thought. The clear link between mortality and sea level fall also calls for a refinement of the hierarchy of El Niño impacts and their consequences on coral reefs.
-
Tom Curtis at 03:22 AM on 17 April 2017New study shows worrisome signs for Greenland ice
PluviAL @5, still futher off topic, but the relocation of water from ice sheets near the poles to oceanic water near the equator will also change the duration of the Earth's day. The change in angular momentum involved will not be uniformly transferred to the interior, providing another trigger for earthquakes, and potentially vulcanism. Whether that mechanism, or the two you mention will raise either earthquake or volcanic frequency appreciably above background rates, however, is SFAIK, unknown.
-
PluviAL at 02:50 AM on 17 April 2017New study shows worrisome signs for Greenland ice
Tom at 3: Thanks for that excellent summary of Antarctica dynamics, I enjoyed it and learned a lot. However, Haze is off topic and, frankly, seems to just be trying to create haze, not to provide a valid comment on Greenland's potential catastrophe. His comment should simply be removed, in my opinion.
I am of the, admittedly badly informed, opinion that Greenlanders will be fine, and benefit once they adapt. The rest of us would not be so lucky.
I fear the isostatic adjustment is much more serious than we realize; volcanism throughout the world may be its dichotomous side-effect, especially if at the same time East Antarctica rocks the continent as mass shifts from West to East. Volcanic and tectonic pressure points in other parts of the geode may slip catastrophically adding to CO2 loads, while reducing uptake, from temporary sudden cooling from vocanism.
The fear is a major motivation for me.
-
joe - at 02:12 AM on 17 April 20172017 SkS Weekly Climate Change & Global Warming Digest #15
Ruins, Not Reefs: How Climate Change Is Fast-Forwarding Coral Science
Great Barrier Reef Bleached Staghorn Coral
A bleached coral near the Great Barrier Reef on March 16, 2017
The first article listed in the "stories of the week" discuss the coral bleaching. It should be noted that the GBR along with numerous reefs around indonesia are suffering coral bleaching due to a drop in sea level. Is it possible that other factors unrelated to AGW is causing the bleaching.
http://www.biogeosciences.net/14/817/2017/
Moderator Response:[Rob P] Coral die-offs from temporary falls in sea level are a natural phenomenon. The Samoans call it Taimasa - meaning foul-smelling (low) tides. This has to do with the shift in water mass in the Indo-Pacific region associated with ENSO. See the SkS post: What's happening to Tuvalu sea level?
As common sense would indicate, this only affects coral near the surface, especially those exposed at low tide. On the Great Barrier Reef, bleaching extends from the surface to 30-40 depths in some areas and it is from water that is too warm (coral bleaching being a breakdown of the symbiotic relationship between polyp and photosynthetic algae).
Lizard Island on the Great Barrier Reef saw catastrophic levels of bleaching in summer 2016, and yet look at the sea surface height variations for that area. The lowest monthly anomaly in recent times occurred in 2015 - well before bleaching was observed. Moreover, how do such small fluctuations cause bleaching in coral tens of metres deep?
So we can dismiss the sea level aspect as some silly climate change denier contrivance. The National Oceanic and Atmospheric Administration (NOAA) has a whole bunch of information on coral bleaching (Coral Reef Watch) if you're truly interested in understanding this. They even have a coral bleaching outlook, a climate model-based projection which utilizes sea surface temperature anomalies to forecast bleaching events.
-
joe - at 23:20 PM on 16 April 20172017 SkS Weekly Climate Change & Global Warming News Roundup #15
In the USA, corporations of various legal feathers are routinely granted personhood. The Supreme Court ruled in 2010 (Citizens United versus Federal Election Commission) that as legal persons, corporations have the same first Amendment rights as natural persons,
JW - FYI the SC did not grant personhood or anything resembling personhood in CU.
-
JWRebel at 23:03 PM on 16 April 20172017 SkS Weekly Climate Change & Global Warming News Roundup #15
@Joe: In the USA, corporations of various legal feathers are routinely granted personhood. The Supreme Court ruled in 2010 (Citizens United versus Federal Election Commission) that as legal persons, corporations have the same first Amendment rights as natural persons, and are therefore entitled to make political expenditures. Many see this as the final nail in American democracy, officially institutionalizing the rule of money.
Almost all large corporate persons have been found guilty of felonies multiple times, but when it comes to jail time, bankruptcy, and the other normal responsibilities of natural persons, it turns out that fictional legal persons have more rights but less responsibilities.
If we can enable faceless psychopathically inclined pools of capital to reap the rewards of actual personhood, without the concomitant obligations, there should be no reason why we cannot grant forests, wetlands, or rivers personhood.
[psychopathic is used here as a diagnostic, not a derogatory term: most corporations manifest all the diagnostic criteria for psychopathy] -
curiousd at 22:26 PM on 16 April 2017Science of Climate Change online class starting next week on Coursera
Correction: The equilibrium temp is close to 255 K in the above, not 239.7 K. I was confusing the temperature with the flux in this sentence. It has been a long night.
-
curiousd at 22:20 PM on 16 April 2017Science of Climate Change online class starting next week on Coursera
Lets deal with correction number one first. Of course I set all GHG equal to zero. Basic texts on environmental physicssuch as the one by David Archer or the one by Wolfson, consider the case where the cloud albedo is kept, but the GHG effect is "turned off". The equilibrium temperature of such an earth, given an emissivity of one, is 239.7 degrees K. For Modtran Chicago, U.S. Standard atmosphere, and 255 degrees K, no GHG, the OLR is 225.07 W/msqd. If I add my corrections to Modtran for 0.98 emissivity I get not 225.07 W/meter sqd but 233 watts per meter sqd. There is no curvature of the Earth effect because if I look at the output from Modtran with zero GHG then the OLR is stays essentially constant but shows some small scatter all the way from altitude zero to altitude 70 km.
The tenberth reference is to show that the most modern satellite result is 239 watts/per meter squared at the assumed emissivity of 1.0.
If I pare my correction down to this statement are you good with this? -
william5331 at 18:48 PM on 16 April 2017New study shows worrisome signs for Greenland ice
It is unlikely that Greenland itself will suffer from sea level rise. In addition to the hydrostatic rebound, both instantaneous and long term, as the ice decreases, it's gravitational pull which pulls the surrounding water toward it like hitching up a skirt, will decrease. Incidentally, this release of the skirt of water will raise sea level even more in other locations than just due to the flow of Greenland glacial water into the ocean.
On a different topic there should be a dynamic process increasing the melt of the ice sheets where they are grounded below sea level. As the ever warming ocean water melts the ice front, the water in contact with the ice becomes less salty and hence lighter. This water should flow up under the ice ceiling, pulling in more warm ocean water along the sea bottom. The deeper the grounding line the greater this effect should be so the process should accelerate where the sea bottom is on a retrograde slope.
-
Tom Curtis at 16:08 PM on 16 April 2017New study shows worrisome signs for Greenland ice
Haze @2:
1) The OP is about Greenland, not Antarctica, so discussion of the Antarctic Peninsula is technically of topic.
2) This is Figure 1 from the first paper you reference with regard to Antartic Peninsular temperatures (Oliva et al):

You will firstly note that 7 out of 10 temperature records are from the northern tip of the Peninsula, or islands lying still further north; and that consequently a simple mean of the temperature records does not show temperature trends over the peninsular as a whole due to spatial bias. Second, you will note that since 1998 temperature trends for the northern 7 stations and the 3 stations representing the bulk of areal extent of the peninsula have had opposite signs. That means (at best) of three regions of approximately equal area (northern, south west, and south east), we have one region warming, one cooling, and no data for the third. On that data, claims of cooling for the entire peninsular go far in excess of what is supported by the data. We can reasonably claim the pensinsula as a whole warmed from the 1950s to about 2000 as all records, and the records for the two regions with data showed that trend (and the trends in the cryosphere in the third supported it); but cannot make a claim to peninsula wide cooling since then if we are guided by the data.
3) Here is Figure 5 from Schmithusen et al:

You will note in particular that even with 4 x CO2, there is a positive change in regional forcing over the entire Arctic (though weakest over Greenland). You will further note that the regions of a negative change in the regional greenhouse effect are strictly limited to parts of East Antarctica, far from the sea. If you compare this with Fig 4 you will see that (approximately) Greenland forcing increases from a current mean value of about 5 W/m^2, as also does the West Antarctic Peninsula. East Antarctica, in constrast gets a stronger negative greenhouse effect relative to that which already exists there (on annual averages).
Further, despite the current negative regional forcing in central East Antarctica, temperatures there are still well above that which would be expected from insolation alone. That is because warm air comes in from the north. With ongoing warming in the north, the temperature gradient between maritime air above the circumpolar waters and that in the interior of Antarctica will increase, resulting in a stronger heat transfer between the two. Over the areas with an increase in radiative forcing (such as the Antarctic Peninsula), that will result in more warming than expected from regional changes in radiative forcing alone.
-
broadbarrel at 14:22 PM on 16 April 2017Debunking Climate Myths from Politicians
Please be aware that President Donald Trump is an avid and blatant rejector of nearly all concerns for the ecology, enviroment, sustainable society and climate change.
Refer to url: http://www.climatecentral.org/news/trump-cabinet-climate-change-20920 Refer to url: https://www.ioes.ucla.edu/article/environmental-future-trump-administration/
Earch url has been archived at url: https://web.archive.org/ This is so recorded substantiation of their positions may not inadvertently "evaporate" and thereby become deniable.
-
broadbarrel at 13:58 PM on 16 April 2017Debunking Climate Myths from Politicians
Skeptical Science Please add Scott Pruit to the politicians list. Pruitt was quoted as saying: “The American people are tired of seeing billions of dollars drained from our economy due to unnecessary EPA regulations, and I intend to run this agency in a way that fosters both responsible protection of the environment and freedom for American businesses.” Quote is from url: https://www.washingtonpost.com/news/energy-environment/wp/2016/12/07/trump-names-scott-pruitt-oklahoma-attorney-general-suing-epa-on-climate-change-to-head-the-epa/?tid=a_inl&utm_term=.254fc501733e
-
broadbarrel at 13:56 PM on 16 April 2017Debunking Climate Myths from Politicians
Skeptical Science, Please at President Donald Trump to the list of politicians. “For too long, the Environmental Protection Agency has spent taxpayer dollars on an out-of-control anti-energy agenda that has destroyed millions of jobs, while also undermining our incredible farmers and many other businesses and industries at every turn,” This has been quoted from url: https://www.washingtonpost.com/news/energy-environment/wp/2016/12/07/trump-names-scott-pruitt-oklahoma-attorney-general-suing-epa-on-climate-change-to-head-the-epa/?tid=a_inl&utm_term=.254fc501733e
-
Haze at 10:47 AM on 16 April 2017New study shows worrisome signs for Greenland ice
This piece commences "As humans put more heat-trapping gases into the atmosphere, like carbon dioxide, ice around the planet melts. This melting can be a problem, particularly if the melting ice starts its life on land." In view of this it is surprising that a recently published paper claims the Antarctic Peninsula is cooling. This paper (Oliva, M., et al., Recent regional climate cooling on the Antarctic Peninsula and associated impacts on the cryosphere, Sci Total Environ (2016), http://dx.doi.org/10.1016/j.scitotenv.2016.12.030) states "from 1998 onward, a turning point has been observed in the evolution of mean annual air temperatures across the Antarctic Peninsula region, changing from a warming to a cooling trend,". This is not an isolated observation as others (Carrasco, J.F. 2013. Decadal changes in the near-surface air temperature in the western side of the Antarctic Peninsula. Atmospheric and Climate Sciences 3: 275-281). and Turner, J., et al 2016. Absence of 21st century warming on Antarctic Peninsula consistent with natural variability. Nature 535: 18645.} have also shown a decline in Antarctic Peninsula temperatures. Warming in the Antarctic has been claimed to be due to atmospheric C02 but it now seems that CO2 may in fact cause cooling in the Antarctic Peninsula (Holger Schmithusen, Justus Notholt, Gerd Konig-Langlo, Peter Lemke, Thomas Jung. How increasing CO2 leads to an increased negative greenhouse effect in Antarctica. Geophysical Research Letters, in press, 2015. doi: 10.1002/2015GL066749.)
Moderator Response:[DB] Please keep your comments on-topic to the OP of the thread.
-
chriskoz at 07:58 AM on 16 April 2017New study shows worrisome signs for Greenland ice
Anyone studied the flood frequency in Greenland? The 2012 one in Kanger was well publicised but I think we are dealing with substantial increase here rather thana one in a century event like 2012 with unprecedented surface melt.
I think all infrastructure there maybe at risk of distuction by exponentially increasing flood frequency. So to those silly statements claiming some parts of the world would benefit from warming, in particular "Greenland will become greener" I would say: ain't necessarily so. "Greening" will not happen when country is about to be ravaged by serious floods. But I don't have any data confirming my fears over future of Greenland population. Obviously their culture - the disappearance of glaciers they admire and worship - is undisputable here. But on top of that their very existence maybe at stake. Will they adapt to more frequent flooding?
-
joe - at 04:07 AM on 16 April 20172017 SkS Weekly Climate Change & Global Warming News Roundup #15
Just weeks after a high court in the Indian state of Uttarakhand granted legal personhood to the Ganges and Yamuna rivers.
An Indian court says glaciers and rivers are 'living entities.' Could the same approach work in the US?
Could this same approach work in the United States - such a holding in a US court would be in direct conflict in Roe V Wade where a personhood doesnt exist until emergence from the womb.
-
MA Rodger at 22:00 PM on 15 April 2017Science of Climate Change online class starting next week on Coursera
curiousd @24,
To recap my postion on your "Correction Number One" which concerns an underestimation by UoC MODTRAN model (aka MILA) of TOA IR flux due to the limits of the wavelength used in the UoC model.
@7 you calculated a potential value of this correction as 9W/sq m, roughly 3.6% of the UoC calculated average global value.
@18 I argue that this value is too high, presenting two reasons for my lower estimate of roughly 2% or 5W/sq m.
@24 you are now calculating the value for this "Correction Number One" as if the extented spectrum (beyond that used in the UoC calculation) has zero GHG acting in it. The value you calculate 14W/sq m is thus a maximum value for "Correction Number One" which would be valid only for a zero or very small GHG effect in the wavelenghts being considered. As the graph I linked @18 shows, there is a large GHG effect in these wavelengths and the large correction you suggest @24 is unjustified.
curiousd @26,
You state that your "Correction Number Two" has been discussed with me up-thread. My position concerning the existence of your "Correction Number Two" remains as stated @18 - "This I cannot believe. And I fail to grasp the logic of your correction." Our discussion has not developed beyond that point (other than sorting out some references).
Concerning your "Correction Number Three," I fail to see the origins of the "One km" IR Radiance values in the graph linked @25. The "Surface" values are evidently blackbody calculations which are thus much dependent on emissivity. Indicative of the emissivity value (E) is the Peak Spectral Radiance (PSR) which for a blackbody temperature of 288.2K would be:-
E/PSR, 0.92/0.125, 0.94/0.128, 0.96/0.131, 098/0.133, 1.00/0.136.
Examination of the UoC output file for 1976 US Std Atmosphere (288.2K) yields a maximum PSR of 0.133 W/sqm/sr/cm^-1 which indicates Emissivity = 0.98. The Band Radiance from the UoC calculations (43.589 W/sqm/sr for 500-800cm^-1) also suggests Emissivity = 0.98.
It is unclear to me how you are calculating the 1km Band Radiance values. (You give the Emissivity = 0.98 value for 1km as 42.7272 W/sqm/sr which I note is very similar to the UoC value for Band Radiance 490-860cm^-1 42.756.) It is also unclear why this would indicate an Emissivity of 0.92.
-
curiousd at 18:53 PM on 15 April 2017Science of Climate Change online class starting next week on Coursera
Also, regarding to explaining correction three, the following comparison might be useful.
Modtran Light in the Atm SpectralCalc Modtran6
PRICE free $ $$$$
dist resolution 1 km 1 km < 1 meter
maximum alt up to 70 km error message if TOA
>"1 million point error" exceeded
if too much band width
or altitude. Therefore simulating a 54 degree angled path by multiplying the input concentration can be possible whilst extending path length not so much
-
curiousd at 08:51 AM on 15 April 2017Science of Climate Change online class starting next week on Coursera
Refer to the image you get from post 25 above. For a CO2 only GHG atmosphere these are plots of the in band outgoing radiance, in w/meter sqd steradian, for wave number range 500 wn to 850 wn CO2 bending mode, versus Earth Surface thermal IR emissivity looking down from zero km and from 1 km. I use a 680 ppm CO2 concentration because this is the present day concentration of 400 ppm multiplied by 1/cos 54 degrees, and 1/cos 54 degrees is 1.7 . Therefore a vertical path with 680 ppm has the same optical length as 400 ppm at a 54 degrees angle relative to Nadir. Therefore I can use this application of the "diffusivity approximation" as a decent substitute for actually integrating over all angles when I multiply by pi streadians to obtain out going flux in W/meter squared. This has been discussed previously by myself and M.A. Rodger here. See posts above 9 and 24.
Of interest here is the sign of the difference between the 0 km and 1 km output. This difference is, for the MILA emissivity of 0.98, given in post 9 and is for the OLR where multiplication by pi steradians has been carried out, equal to 360.2 w/meter square minus 357.5 w/meter squared. Then the OLR at 1 km is about 2.7 watts per meter squared less than at zero km.
In the figure for the URL given above, the multiplication by pi steradians has not yet been carried out and for emissivity of 0.98, the surface upward in band radiance exceeds that of the same quantity at 1 km by 43.5764 minus 42.7272 or 0.8492 watts /meter squared steradian. Multiply this quantity by pi steradians to obtain a result which is 0.8492 times pi and rounds off to 2.7 watts per meter squared, in agreement with post 9 above.
However, note in my figure you can see at the URL I refer to above, the value of the one km in band radiance decreases at a rate less than that of the zero km in band radiance as the emissivity is decreased. In fact, for surface emissivities of 0.93 or less the upward in band radiance at 1 km is greater than the upward in band radiance from the surface.
I was surprised at this result, but it has to do with Correction Three since the sign of the difference between OLR surface and OLR 1 km changes sign between emissivity of 0.98 and 0.92.
The "apparent " emissivity of MILA obtained just by looking at the output without knowing the settings of the underlying program or knowing about the 100 wn to1500wn truncation, is not 0.98 but 0.92.
This can lead astray anyone wishing to check if they are using Schwarzchild's equation correctly to compute the CO2 outgoing flux, by usig MILA. And where else can the user find a set of OLR values such a at MILA to test if she/he is doing things correctly?
I will let this post "subilate" a bit before proceeding. The finding that one can have OLR at 1 km greater than at zero km seems surprising, and my only justification so far is that: 1. I use a procedure with SpectralCalc that give good agreemen with MILA and gives an expected CO2 climate sensitivity of ~ 4 watts/meter squared. 2. That applying that procedure to low emissivities of 0.93,0.92,0.91, 0.9, and 0.89, gived me the result that the OLR from 1 km exceeds that from the surface.
I believe that desert aras have such low emissivities.
Of course an emissivity in the thermal IR less than one implies some scattering or reflection, so that likely must be considered. BTW SpectralCalc gives the caveat that they do not deal with scattering in any way; just absorption and emission.
-
Philippe Chantreau at 08:11 AM on 15 April 2017Breathing contributes to CO2 buildup
I understand the idea Tom. You expand quite well on what I described a little too quick as "shuffling carbon around." My opinion is that the kind of biomass change that would be required to explain the past 100 years increase in atmospheric carbon is so immense as to preclude a major role in this change, especially while the oceans are still acting as a sink. The idea that all of the increase could be due to biomass changes is simply not believable.
Perhaps Dr Bill is trying to make the argument that the biomass contribution is underestimated, although the bulk of what he said was innuendo on IPCC intentionally skewing the issue, which was unwarranted, as you showed. My understanding is that there is quite a bit of litterature on the subject and that the range of possible contribution of biomass changes is fairly well constrained. I don't see at first glance that Dr Bill has anything revolutionary to overturn the current state of knowledge on the subject.
www.epa.gov/ghgemissions/global-greenhouse-gas-emissions-data
Intesresting discussion here:
www.newscientist.com/article/dn11638-climate-myths-human-co2-emissions-are-too-tiny-to-matter/
Prev 391 392 393 394 395 396 397 398 399 400 401 402 403 404 405 406 Next


