


 Arguments


Recent Comments
Prev 392 393 394 395 396 397 398 399 400 401 402 403 404 405 406 407 Next
Comments 19951 to 20000:
-
nigelj at 10:47 AM on 22 April 2017Neil deGrasse Tyson on science vs. denial
Great video. It's so strange that at the height of the age of science and technology, with all the triumphs, some people are losing faith in science. I would have thought the evidence for climate science, vaccines and evolution is overwhelming.
I think the problems are a combination of the following issues:
Obviously vested interests can make people dismiss science, an issue with climate change.
Modern society has started to seriously question elites and conventional wisdom. This is liberal in essence, and can be healthy, but only if it's rationally based and it often isn't rationally based.
People also aren’t equipped with the mental analytical skills to sort the wheat from the chaff. We still don’t do a great job teaching young people (or old) about logical fallacies, poor quality arguments, and so on.
The Republican movement seems to have become more and more irrational. Maybe its a fear of science becoming too strong, and conflicting with their world views. But we all have to be prepared to modify our beliefs in light of new information. But there's just no sign of these guys seeing the light, so it's possible things are on a dismal downward spiral in America at least.
However polls do show the majority of people accept climate science, so it’s a stubborn minority who don’t. Sometimes it just takes time to process information and accept new theories, for example it took society some significant time to accept the tobacco / disease connection.
Also climate science has big implications, evolution collides with religion, and regarding vaccines people worry about side effects on children. These are therefore challenging debates, probably not indicative of science as a whole.
And there’s an annoying thing we have to contend with. Many theories require complex explanations, while a short and cleverly distorted sceptical slogan or lie can take off and become embedded. To analyse all this you need time to read both sides of debates, and many people don't have much time, and respond to the simplistic sound bites typical of our times.
You can’t convert people by totally rubbishing them. Try to reason with them, and most are receptive to this, eventually. But I have noticed it can take some time for them to come around.
-
Tom Curtis at 07:48 AM on 22 April 2017Neil deGrasse Tyson on science vs. denial
Mal Adapted @1, the 2016 US Presidential election has revealed a deep seated irrationality in the US electorate that extends well beyond the rejection of science. Like you, this has left me profoundly pessimistic about the prospects of our civilization. Much as we like to say, it could only happen in the USA, this wallowing in irrationality is not unique to the US. Brexit showed it to be alive and well in the UK. The popularity of Marine Le Pen shows it to be strong in France. The election of Clive Palmer four years ago, and Pauline Hanson in 2016 shows it has afflicted a substantial portion of the Australian population.
If this commitment to irrationality continues much longer, the Romano-germanic civilization that has dominated Europe since 1100 AD, and the world since about 1600 AD will not last much longer. That, of itself, will be tragic only to nations and people steped in that culture - but given the present threats of Anthropogenic Global Warming, habitat destruction, over-fishing and, in the background, nuclear war, the fall of the Romano-Germanic civilization may be the prelude to the fall of all civilization on this planet. These are all threats that can be dealt with, seperately and conjointly, but they require rational policy to do so.
-
Mal Adapted at 07:23 AM on 22 April 2017Neil deGrasse Tyson on science vs. denial
There is no daylight between my own and Dr. Tyson's positions on the privileged authority of science, or the importance of basic science literacy (or better, meta-literacy) to democracy.
That said, I'm pessimistic that his manifest certainty of science's epistemic authority will be persuasive to non-scientists in the PoMo era. The 2016 elections were a big shock to me, in my 7th decade. Telling people with little early exposure to science how ridiculous it is to deny AGW may be gratifying (personal experience), when you're a random guy on the Internet . It evidently hasn't done much to enhance science's credibility with the public, though, even coming from the likes of NDT.
IMHO there clearly is more to be done to prepare the ground before telling them they're fools for denying it. Damfino what, though. I'm hoping for a sort of heroic scientist-educator-politician; oxymoronic, I ruefully admit. Depressive realism, or mood-congruent thinking? You be the judge.
-
MA Rodger at 20:25 PM on 21 April 2017Heartland Institute's misinformation campaign into schools
I'm surprised there is no link to the offending book(let). If for nothing else, there is the idea set out in the audio (Ep8 in theOP) that the book(let) is so wrong in its message that it presents an educational opportunity. So a link is surely needed for all those educational institutes who the deluded denialists Heartland Institute have yet to reach.
I was also a bit shocked by the reference in the audio to Bob Carter's death. It is true that the booke(let) is the work (I should simply call it "lies" rather than "work") of three fake experts and such fake experts are indeed not such a numerous species. But Carter's name on the book(let) is not a case of postumous attribution of authorship. The book(let) was published a month or so prior to Bob Carter's death.Mind, the book(let) tells us it is based on a chapter from a far bigger work but that bigger work has yet to see the light of day. From what we are told, the bigger work would be 1,000 pages. (It is described as the third volume of a marathon 3-volume writing exercise which will apparently total 3,000 pages. The first two volumes comprise 933 pages & 1,062 pages.) Presumably, this Volume 3 of their magnus opus will be no more truthful than the preceeding pair. (I assume the second volume is nought but a pack of lies for the first certainly is. I checked a random section of their first volume (Section 2.1: Forcings & Feedbacks - Carbon Dioxide, pp151-165.) and found fifty-seven fundamental errors.)
The audio does discuss addressing the bare-faced lies within the book(let) ("...refute all the physical science claims they are making which are wrong...") but argues that it is more important to counter the bogus claim that "the 'scientific consensus' on the causes and consequences of climate change is without merit." While I would agree, pointing out the eye-watering stupidity of the bogus experts from NIPCC & Heartland can surely assist in showing how bogus is their primary claim.
And with that in mind, when I randomly picked a chapter from the book(let) and then examined the primary evidence presented to support their first claim in that chapter I found these liars are actually 'hiding the incline' in a manner many time more significantly than the famous 'hide the decline' which they made such a fuss over. Their 'hide the incline' is illustrated by this graphic (usually two clicks to 'download your attachment').
-
ubrew12 at 17:32 PM on 21 April 2017Heartland Institute's misinformation campaign into schools
Bast has done some reprehensible things in his long career, but mispronouncing 'Oregon' (25:29) is probably the least forgiveable. I'm 97% sure, or 0.3%, depending on who is counting.
Outside Heartland Package: "Why do Scientists disagree about Global Warming?"
Inside Heartland Package: "Send in this card with your name and address and you, too, can be a 'Scientist'! We'll ship your diploma out immediately!"
-
Tom Curtis at 13:35 PM on 21 April 2017Increasing CO2 has little to no effect
DrBill @309, radiation models are not climate models. They determine the transfer of radiant energy within the atmosphere given a set of conditions which include well mixed greenhouse gases present, water vapour present, clouds present, and atmospheric density and temperature profiles. They were first developed for the US Airforce as part of its effort to develop infrared guided missiles (Sidewinders), and were later used for the development of FLIR systems, for interpreting microwave radiation from the atmosphere as temperature, and of course, for determining IR radiation from the atmosphere. As such, they can determine the change in Outgoing Infrared Radiation given a change in atmospheric profile, where such changes at the tropopause are also the change in atmospheric forcing.
In 1970, LBL radiation models could produce results as accurate as this if fed detailed atmospheric profile data gathered by a weather balloon:
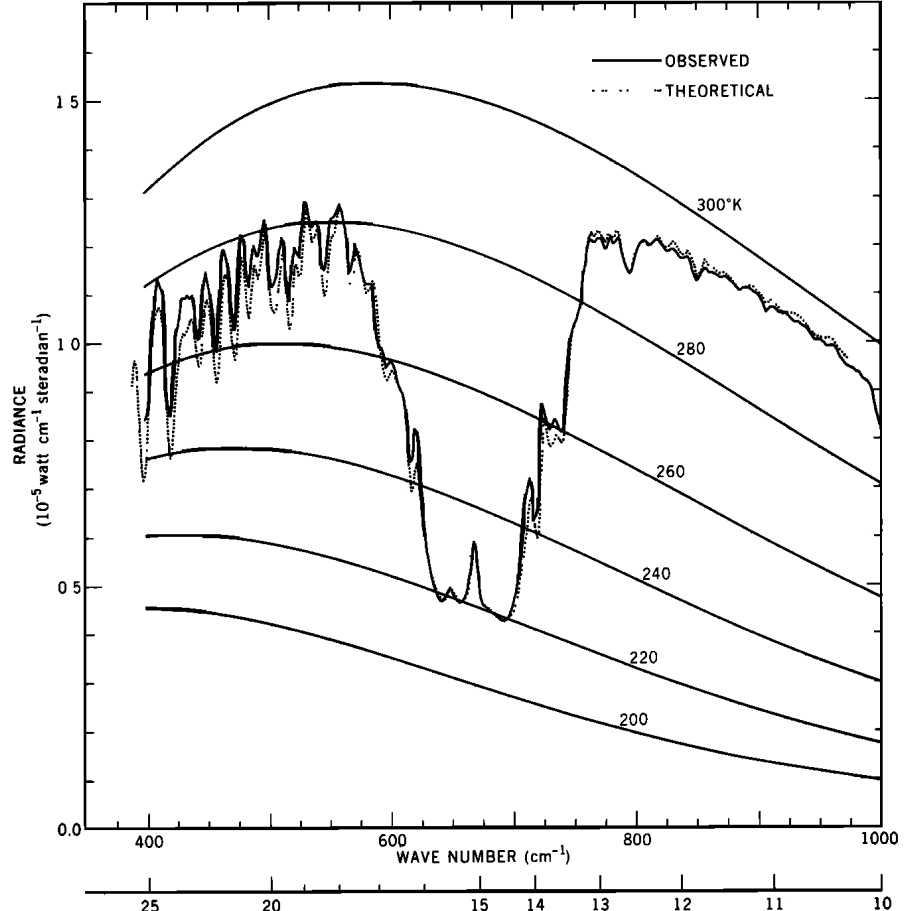
By 2008 they could produce results with accuracies like this with more approximate profile information:

Further, for determining radiative forcing, the models are generally set with a temperature profile determined by radiative/convective equilibrium in the troposphere (ie, one that follows the adiabatic lapse rate), and with a radiative equilibrium above the tropopause, and therefore complies with the requirements of the laws of thermodynamics (including that for Gibbs free energy).
Of course, radiative models only determine forcing, and not the temperature response to forcing within the troposphere. (They can be used to calculate the initial temperature responce in the stratosphere and above were radiative equilibrium obtains.)
Global Circulation Models, which determine temperature responce as well as radiative response, also include approximations to the laws of thermodynamics governing movement of gases under gravity. (Approximations only given the limits of cell size required to make the models able to operate on modern super computers.)
Moderator Response:[JH] Spencer Wart has detailed the history of General Circulation Models here.
-
nigelj at 08:36 AM on 21 April 2017Heartland Institute's misinformation campaign into schools
The so called Heartland package on climate change is not so much a sceptical viewpoint, as a collection of lies, deceptions and plain nonsense. As such I would have thought it doesn't meet the threshold of quality and reliability, for material to be taught in schools.
However students will be aware of some disagreement with climate change theory, and its unwise to pretend this doesn't happen. If sceptical viewpoints must be mentioned in schools, at least keep them to the saner ones, and put them in context, and discuss their weaknesses (and there are many huge weaknesses).
It's also time we taught students tools to see through poor quality ideas, logical fallacies such as red herring arguments, cherrypicking information, non sequiters, etc,etc. There is so much fake news, and flakey theories, or conspiracy theories, and it's sadly not going to go away, and is the price we pay for an open society and freedom of speech. Students need to know how to evaluate this material rigorously.
-
Evan at 05:33 AM on 21 April 2017SkS Analogy 1 - Speed Kills
Because the original plot of the annual rate of increase of CO2 showed too much annual variability, I replaced the original figure with a 10-year average of annual CO2 flucuations. For reference, the original figure is shown here.

-
Evan at 05:08 AM on 21 April 2017SkS Analogy 1 - Speed Kills
Point taken William, and my mistake. I will be more careful in the future.
-
william5331 at 05:00 AM on 21 April 2017SkS Analogy 1 - Speed Kills
Perhaps it is a minor niggle but I wish we would agree on terminology and then continue to use it. As I understand it we are in an ice age which started some 2.5m years ago. During that period, we have had about 30 glacials or if you like glacial periods and about 30 interglacials. We are at present in the Holocene interglacial and the previous one about 125,000 years ago was the Eemian interglacial (or interglacial period). In the first half or so of this ice age, the period was about 41,000 years but more recently the period has been around 100,000 years. It doesn't help educating the non scientific community if we use sloppy terminology. I don't care if we decide to call glacial periods ice ages but then we need another term for the recent 2.5m years.
-
Evan at 04:50 AM on 21 April 2017SkS Analogy 1 - Speed Kills
I am not an expert on the CO2 dataset, but my expectation is that like temperature, the absolute values jump around a lot from year to year. That is why the best way to view the data is with a fitted curve. For the analogy I calculated the rate for each year. Converting the data into a 10-yr. average of the CO2 rate of increase produces the following plot, which loses the big variations in data, but preserves the overall trend.

-
bjchip at 04:50 AM on 21 April 2017SkS Analogy 1 - Speed Kills
The BBC also reported on the rate back in 2006
"The "scary thing", he added, was the rate of change now occurring in CO2 concentrations. In the core, the fastest increase seen was of the order of 30 parts per million (ppm) by volume over a period of roughly 1,000 years."... "The last 30 ppm of increase has occurred in just 17 years. We really are in the situation where we don't have an analogue in our records,"
http://news.bbc.co.uk/2/hi/science/nature/5314592.stm
-
DrBill at 03:42 AM on 21 April 2017Increasing CO2 has little to no effect
The free energy change of a process is the sum of energy and entropy*temp, and is generally regarded as happening spontaneously when the sum is <0. A version of free energy is that of Helmholtz, whose summation is ΔF (or ΔA) = ΔE -TΔS, but another is the Gibbs ΔG=ΔH-TΔS. The difference between the two expressions is that ΔE and ΔH are not the same thing: ΔE, as I've been used to thinking of it, is now named ΔU, while ΔH = ΔU + Δ(pV). In short, Gibbs Energy includes PV work, while Helmholtz does not when evaluating the possibility of a spontaneous process. A view of this, which I hold, is that the ΔE portion emphasizes the radiative changes, while the ΔH portion includes pV work.
Since the atmosphere not only radiates energy in trying to come to equilibrium, but also does substantial pV work, I believe a model that seems to rely on radiative transfers is not sufficient to explain the climate.
In support of this, I refer the reader to the 1962 and 1976 editions of The U.S. Standard Atmosphere. Google links lead to pdf's and I don't know if anyone wants to wade through dozens of derivations and perhaps 60 pages of notes and explanations, so I won't burden this post with the links themselves, unless someone wants them. In summary, the NASA, NOAA, and a host of other sponsors and contributors determine a model of the atmosphere based on gravity and Cp ((∂H/∂T)p [see @301], and regard CO2, methane and NOx as "trace gases" with no significant impact on temperature. Similarly, the lapse rate -g/Cp suggests the derivation from Gibbs.
The dichotomy is strong enough to get out the old slide rule, imo, and attempt to recognize something fundamental like Cp in the forcing equation. I have not so far.
-
kmoyd at 03:15 AM on 21 April 2017SkS Analogy 1 - Speed Kills
This is a very useful rebuttal to "The climate is always changing." argument.
For or those who don't care about nature, it would be helpful if there were a mention that agriculture is also affected.
is there an explanation for the three very high points?
-
Evan at 23:49 PM on 20 April 2017SkS Analogy 1 - Speed Kills
The post-1950's data is a simple linear fit in Excel. Nothing fancy. Although one can eaily make the case for CO2 rising faster than a linear trend (as pointed out in the responses), in this analogy the point was to simply introduce the idea of just how much faster we are moving than a "base rate" defined by deglaciation cycles.
-
DrBill at 12:59 PM on 20 April 2017Increasing CO2 has little to no effect
Just a quick thanks to Tom CurtiS, JH and RH. FWIW, I tried several ways to make the page show up and not until this evening did I try to quit and relog in, and that seemed to work. I agree with chriskoz about courtesy and thank Tom for recognizing a typo. If JH/RH don't mind, I wouldn't mind seeing my 302,3,4 deleted; 301 had all I had in mind to ask, as it had reference to the partial derivatives that result in Cp. It's late here, for me, and I'll post a new submission tomorrow.
-
Tom Curtis at 11:04 AM on 20 April 2017Increasing CO2 has little to no effect
DrBill @301, the formula for radiative forcing was not directly derived from fundamental physics. Rather, the change in Outgoing Long Wave Radiation at the tropopause, as corrected for radiation from the stratosphere after a stratospheric adjustment (which is technically what the formula determines), was calculated across a wide range of representative conditions for the Earth using a variety of radiation models, for different CO2 concentrations. Ideally, the conditions include calculations for each cell in a 2.5o x 2.5o grid (or equivalent) on an hourly basis, with a representative distribution and type of cloud cover, although a very close approximationg can be made using a restricted number of latituded bands and seasonal conditions. The results are then have a curve fitted to it, which provides the formula. The same thing can be done with less accuracy with Global Circulation Models (ie, climate models).
The basic result was first stated in the IPCC FAR 1990. That the CO2 temperature response (and hence forcing) has followed basically a logarithmic function was determined in 1896 by Arrhenius from empirical data. The current version of the formula (which uses a different constant) was determined by Myhre et al (1998). They showed this graph:

The formula breaks down at very low and very high CO2 concentrations.
-
Digby Scorgie at 10:59 AM on 20 April 2017Humans on the verge of causing Earth’s fastest climate change in 50m years
Tom Curtis @9
When the "level of economic harm and natural disasters" becomes sufficiently catastrophic, I can't see anything less than a collapsing global civilization, with huge numbers of people dying of starvation and strife (Syria many times over) and economic activity plummeting as a consequence. Local civilizations will still survive but far less fossil fuel will perforce be burnt. Anyway, that's my gut-feeling — but then I'm a cynical old man.
-
amhartley at 10:48 AM on 20 April 2017Antarctica is gaining ice
Should this discussion be updated to account for the recent record lows in Antarctica's sea ice extent?
jlsoaz: Did you look at the National Snow & Ice Data Center's website, nsidc.org?
-
amhartley at 10:38 AM on 20 April 2017SkS Analogy 1 - Speed Kills
The analogy does make some good points, & clearly. Does anyone besides me worry, though, about using the period 1851-1950 as the comparator? For that period to be meaningful, it would have needed to last as long as we expect our current warming rate to last (probably many centuries, under a business-as-usual scenario), & we would need to have observed the warming's impacts on food supplies, sea level rise, weather & so on.
Since 1851-1950 was not that long, maybe a more meaningful comparator period would be the last previous period of warming of >1,000 years (ignoring any periods with other factors present that would grossly exacerbate extinctions & so on, such as asteroid hits). -
Tom Curtis at 10:19 AM on 20 April 2017Increasing CO2 has little to no effect
chriskoz @305 while I agree that correct spellings of names is a matter of courtesy, DrBill spelled my name correctly in three posts prior to that @304, so it is reasonable to assume that that mispelling was entirely inadvertent. Further, "most accomplished" is a compliment that suggests significant acheivement in a scientific field, whereas I lack even a BSc. I take that as a compliment to my depth of understanding of the topic, for which thankyou. However, while I think is deserved, that depth is limited, especially relative to anybody with a PhD in atmospheric physics.
-
curiousd at 09:00 AM on 20 April 2017Science of Climate Change online class starting next week on Coursera
Hello All,
No the moderator is wrong. I have learned all I can learn, you folks have helped me, and I am on my way.
Cheers.
Curiousd
Moderator Response:[JH] May the Force be with you. :)
-
Cedders at 08:44 AM on 20 April 2017Corals are resilient to bleaching
A note that even after another hot summer of coral bleaching, this time without an El Niño, Jim Steele doesn't seem to have learned much. He's written an article on the web entitled "Falling Sea Level: The Critical Factor in 2016 Great Barrier Reef Bleaching!" attacking Hughes et al (2017). Global warming and recurrent mass bleaching of corals. Steele's article has been referred to by James Delingpole and others, presumably because it tries to blame anything other than sea temperatures for coral mortality despite their evident close relationship.
The article about coral mortality in Sulawesi he references would not explain bleaching and its authors support the overall picture of thermally-induced bleaching and mortality. One of his suggestions is that Hughes's demonstration of mass mortality of the northern GBR was based entirely on aerial surveys. That is false, as can be seen in reports for example in SciAm or New Scientist. Although this has been pointed out to him, Steele has as of 19 April yet to correct these errors.
-
chriskoz at 08:20 AM on 20 April 2017Increasing CO2 has little to no effect
DrBill@304,
Please show a bit more respect to Mr Curtis by taking care to spell his name correctly. The fact that Mr Curtis in one of the most accomplished commenters on this site calls for even more care.
Then people will show more respect to you and your comments, reciprocally.
-
chriskoz at 08:05 AM on 20 April 2017SkS Analogy 1 - Speed Kills
Typo in my post@2.
"dppm/dy" should read "dppm/dt". Sorry.
-
chriskoz at 08:02 AM on 20 April 2017SkS Analogy 1 - Speed Kills
If I read the plot correctly, the linear trend since 1950 does not look to fit the data. The data rises faster than the line in the figure. And the data in more accurate than pre-1950 part (I'm assuming data comes from MaunaLoa and rapid accumulation ice cores respectively).
So, since the y-axis is already a first derivative (dppm/dy), while the x-axis is linear, the actual CO2 trend looks faster than quadratic since 1950. This is the first time I've realised it. I don't need to explain to people on this site what ultra-quadratic trend means in context of "Elevator Statement" above: more than freefall, more than gt2/2. Those politicians who still have such basic understanding of maths & kinetics (sadly none associated with GOP in US) should be given this post to read.
-
JWRebel at 05:00 AM on 20 April 2017Yes, we can do 'sound' climate science even though it's projecting the future
@ubrew12: Good points. The third point is also a giant misapprehension even if you grant the premise. I happen to agree with what Spencer says about the the Earth, but this does not give us a free pass — his conclusion is a total non sequitor. You cannot cross the street without looking and say nothing happens without God's will, so there's no danger. Not looking is part of what is happening; nothing anybody believes about the Earth or Mother Nature can suspend cause and effect. Balance is always restored. What we do and don't do matters a great deal. The Israelites are told to plant trees, to allow the land rest (fallow), etc., if they want to keep the land as their inheritance. Nowhere does it state that it doesn't matter what you do. Quite the opposite. There is no religion that states that you endanger your life and soul if you kill a fellow human being, but pouring infinite amounts of CO² into the atmosphere has no consequences, the indulgences have already been provided in advance at no cost.
-
MA Rodger at 04:41 AM on 20 April 2017Science of Climate Change online class starting next week on Coursera
curiousd @39.
So, concerning the graph you introduced @25, it is incorrect to say that "This image has to do with the last correction,"Correction Three" to MILA." In truth it has no bearing in the development of your "Correction Number Three" , the graph being the result of your use of SpectralCalc. As we continue to have great difficulty getting to grips with your use of MILA, adding the output of a different model into the discussion is a step too far.
Concerning your "Correction Number Three", I repeat my comment @33; it is only duplicating your correction resulting from the limited spectrum under analysis within MILA ( your "Correction Number One"). And I still see no reason for your "Correction Number Two" because there is no reason to believe that the MILA calculator is not already adjusting using a "diffusivity approximation".
And may I be so bold as to suggest an alternative to this torturous discourse we engage in here. You could approach UoC concerning their MILA asking for their understanding of the different approximations their model encompasses and their relative impact on the output.
Moderator Response:[JH] As long as you and/or Tom Curtis respond to his posts, curiousd will likely keep pursuing this matter on this website.
-
Quidam at 03:15 AM on 20 April 2017SkS Analogy 1 - Speed Kills
" Slam on the breaks" should be " Slam on the brakes"
Moderator Response:[JH] Glitch corrected. Thank you for pointing it out.
-
DrBill at 02:42 AM on 20 April 2017Increasing CO2 has little to no effect
Is this post system working? My last three tries have not produced a post after Tom Curtic @ 300.
Moderator Response:[JH] Yes, the system is working. All of your comments have appeared.
[RH] What's probably happening is, he's posting at the end of one page and the comments is showing up on the new following page. That one trips people up from time to time.
-
DrBill at 02:39 AM on 20 April 2017Increasing CO2 has little to no effect
Tom Curtis @ 300 I've been trying to post a physics question, but the page won't update with my submission, so I'll just use English. Does the forcing equation arise from fundamental physics to your knowledge, or is it something from curve-fitting efforts? Is it possible to put partial differential equations in this text-box?
Moderator Response:[JH] All of your prior posts were visible.
-
John Hartz at 02:17 AM on 20 April 2017Science of Climate Change online class starting next week on Coursera
curiousd: In the context of your commentary, the following caught my eye...
39-year-old drawing hints at what the Event Horizon Telescope may have just captured: the true shape of a black hole
What Does a Black Hole Really Look Like? by Amanda Montañez on April 17, 2017
-
DrBill at 02:07 AM on 20 April 2017Increasing CO2 has little to no effect
Tom Curtis @300. Thank you. Can you tell me if the formula for radiative forcing is a curve-fitting equation (ie, without the sensitivity factor), or is it derived from fundamental physics? I can't seem to locate something that ought to be related, say, to the partial derivative of enthalpy wrt T at constant p, . Have you seen something of the sort? My apologies if this is a duplicate. The page did not update with my submission, until I took the symbols out.
Moderator Response:[JH] They all appeared. Two of the duplicate posts have been deleted.
-
DrBill at 02:04 AM on 20 April 2017Increasing CO2 has little to no effect
Tom Curtis @300. Thank you. Can you tell me if the basic equation is a curve-fitting equation (ie, without the sensitivity factor), or is it derived from fundamental physics? I can't seem to locate something that ought to be related, say, to the partial derivative of enthalpy wrt T at constant p, (∂H/∂T)p. Have you seen something of the sort? My apologies if this is a duplicate. The page did not update with my submission.
Moderator Response:[JH] Your prior two duplicate posts have been deleted.
-
ubrew12 at 01:46 AM on 20 April 2017Yes, we can do 'sound' climate science even though it's projecting the future
Lamar Smith: "Anyone stating what the climate will be... at the end of the century is not credible" Then Chairman Smith is not credible, since the argument for doing nothing about fossil emissions is based on a prediction that climate in 2100 will be unaffected by it. This 'pushback' argument is not made often enough: the 'do nothing' alternative is still a course of action based on a prediction (that despite doing nothing, everything will be OK). On what is that prediction based? History? Intuition? Madam Costanza's crystal ball? No rational course of action, or inaction, is made without an estimate of its future impact. Since all courses of action, or inaction, require such future predictions, why are only the predictions of the climate scientists being questioned?
Deniers, when questioned on this, will often appeal to history: 'climate has always changed naturally over the course of Earth's history'. This is a non sequitor: if Smith shot his neighbors dog, his defense can't rest on the observation that most dogs throughout history died naturally. Besides: name something that hasn't changed naturally over the course of Earth's history.
Rarely, deniers will reveal something closer to the heart of their objection, as when Dr. Roy Spencer said "Earth and its ecosystems — created by God’s intelligent design and infinite power and sustained by His faithful providence — are robust, resilient, self-regulating, and self-correcting, admirably suited for human flourishing, and displaying His glory." So, that's a prediction of future climate based on 'Everything is going to be OK, because God told me so'. Personally, I prefer Madam Costanza's crystal ball.
-
BBHY at 20:36 PM on 19 April 2017Humans on the verge of causing Earth’s fastest climate change in 50m years
Even if humans don't burn all the fossil fuels, the rapidly thawing permafrost could boost CO2 to that higher level, or to the GHG equivalent since that would add a lot of methane to the mix.
-
curiousd at 19:03 PM on 19 April 2017Science of Climate Change online class starting next week on Coursera
Another thing....I should call my corrections one and two "suggested supplements" to MILA. The potential for the user to obtain his/her emissivity of 0.92 would be solved simply if, someplace on the screen that the user sees when the website is opened, the statement is made that the emissivity used is 0.98.
I first brought this up at Science of Doom, and Steve Carson was the one who suggested working up a revised MILA estimate for the clear sky OLR. The other S of D responder posted that although he had used MILA he had never thought of investigating the button for the underlying program.
I will acknowledge Steve Carson when I contact David Archer. Again, S of D explains the diffusivity approximation at length, and recommends it in their section that derives the symbolic solution to the upward stream of the two stream solution to Schwarzchild's equation.
Finally, in post 38 above, the statement is made "I have tracked down this Schwarzchild Equation and, rather than the ones that explains the wobbles of the planet Mercury, it is a rather mundane equation that I didn't appreciate had a name and which is explained here."
1. The S.E. that is used in the present context was first used in elucidating the physics of the sun it is not:
2. The first solution to the general theory of relativity that is the "Schwarzchild Radius" of a black hole. And of course general relativity is what described the precession of the perihelion of mercury, and that discovery was independent of Schwarzchild.
3. I guess this thread is the first time you have heard of the Schwartzchild Equation, M.A. Rodger? The equation may look simple but I found it not so simple to apply in practice. There is a subtlety in the application of the boundary conditions, IMO.
Moderator Response:[JH] A reminder, MILA = "Modtran Infrared Light in the Atmosphere"
-
chriskoz at 17:25 PM on 19 April 2017Yes, we can do 'sound' climate science even though it's projecting the future
Thank you Kevin for that oped. Gavin's TED talk is an excellent complementary explanation, in case you haven't watched it yet. Be wise and source reality from the relevant experts rather than from fake news makers.
-
curiousd at 16:55 PM on 19 April 2017Science of Climate Change online class starting next week on Coursera
In the above, I state mistakenly that Note that my 1.7 factor is 1.666 or 2.3 rounded off. Mistake. my 1.7 factor is 1.666 rounded off. One over 1.666 equals the cosine of 53.96 degrees. 53.96 degrees rounds off to 54 degrees. One over 1.7 equals .5882, and the ArcCosine of 0.5882 is 53.9 degrees which rounds off to 54 degrees, which is the angle I choose.
I have by going through this exercise come to realize that Pierrehumbert stating that cos theta = 2/3 would be an equally valid choice as cos theta = 1/2 implies an upper limit for the angle of 60 degrees and a lower limit of 48.1 degrees.
Grant Petty's text suggests cos theta equals 3/5 which is the arccosine of 53.1 degrees.
Houghton chooses 3/5 as the ratio,a ratio which is the Arc cosine of 53.1 degrees, which is the same angle recommended by Petty.
My angle of 54 degrees lies within the range of 60 degrees upper limit to 48.1 degrees lower limit corresponding to page 191 of Pierrehumbert, and is only ~1 degree greater than the 53.1 degrees used by both Petty and Houghton.
-
Tom Curtis at 13:55 PM on 19 April 2017Increasing CO2 has little to no effect
DrBill @299, the formula for the radiative forcing of CO2 is 5.35 x ln(CO2current/CO2initial). That is equivalent to 12.32 x log(CO2current/CO2initial). NOAA gives this, and formulas for the radiative forcing of other greenhouse gases here.
To determine the equilibrium response to a given radiative forcing, you need to multiply the forcing by the climate sensitivity factor. That is approximately equal to 0.8 +/- 0.4oC/(W/m2), which is what wikipedia says.
-
chriskoz at 12:08 PM on 19 April 2017Humans on the verge of causing Earth’s fastest climate change in 50m years
Tom@7,
Thanks for the pointer to the source publication of your claim. It was an interesting read. And it confirms that the amount on FF reserves can be hgher than I thought beforehand and Wink12K scenario of releasing 12EgC anthropogenic CO2 slug is at least theoretically possible, though constrains other than resource limit can make it unrealistic. I would add that with a CO2 slug that big, the natural feedback of thawing permafrost and unknown mechanisms that can turn the ocean into CO2 source, can contribute to even more CO2 release.
BC@8,
A conversion of .75 when going from forcing to temp is the fact that Equilibrium Climate Sensitivity used by Hansen is 3K/double CO2 while double CO2 creates 4Wm-2 forcing. Hence 3/4=.75.
But I think not just ECS should be used to determine temp evolution on the timescale in the OP graph. More appropriate is Earth System Sensitivity which takes into account millenial scale feedbacks, such as melting icesheets, permafrost thaw I mentioned above. ESS is larger than ECS. So, having not read the OP study, I don't understand why the temps on fig 4 are smaller than ECS. From your eyeballing, it looks more like Transient Climate Sensitivity figures - 2K/double CO2 wich is 50% of forcing number in Wm-2 - e.g. 3.0 degC for RCP6. Maybe figure h shows just the amount of CO2 released in each scenario and does disregards the ocean CO2 uptake, optimistically assuming the strength of the ocean CO2 sink will not be affected till the end of the period shown and ESS feedback wil not happen. With such assumptions you can say that ocean CO2 uptake will largely counter-balance the warming progressing from TCS to ESS within decadal to a century timescale and postulate TCS only level of warming on that timescale.
-
DrBill at 11:45 AM on 19 April 2017Increasing CO2 has little to no effect
I read a lot of this thread, but not all of it, an found that the disussion had moved on from the basic question of its title, to a temperature rise due to a concentration change. This is similar to something from wikipedia that says the forcing resulting from CO2 is accordiing to 5.65K*log CO2(1)/CO2(0) = change in temperature. Is this the understanding here, or has wiki got it wrong? Just trying to understand and if this is the wrong thread, I apologize in advance.
-
curiousd at 09:18 AM on 19 April 2017Science of Climate Change online class starting next week on Coursera
Note to Tom Curtis comment 37. I had always assumed, say for two years or so, that I could never understand anything that button revealed, as it would have something to do with the program source code. It was only when I determined by integrating one of the outputs by using a digitized result with an underlying width which by accident extended between 5 wn to 2000 wn and got a significantly larger OLR than was given in the MILA output, and then found I was within 2% of the MILA output if the underlying interval was limited to 100 wn to 1500 wn. that I realizedsomething was wrong.
By user output I meant what the user sees in the window that appears when you click on the URL for MILA. Then I looked at that button and found that the actual integration was limited to 100 to 1500 wn and that the emissivity was0.98 The way I found this out, and that indeed the information was revealed by that button, was described earlier in the thread, Tom Curtis, which you might have looked at more carefully before accusing me of a false claim.
Regarding comment 38. Here is how I get the upward intensity as a finction of emissivity and altitude.
For the zero altitude in band intensity I go to the SpectralCalc black body calculator APP and calculate the in band radiance for 288.2 degrees and the emissivity I put in. I use a wave length range of 500 to 850 wn which completerly includes the bending mode band of CO2.
For CO2 the bending mode range is contained within the 500 to 850 wn range. The band from 100 wn to 500 wn is completely transparent if CO2 is the only green house gas, which I also put into SpectralCalc. The same is true for the window between 850 wn and 1500 wn. Therefore, since CO2 is completerly transparent for 100 wn to 500 wn, and 850 wn to 1500 wn I also obtain those intensities using the SpectralCalc Black Body Calculator as described above in this post. The upward intensity for a CO2 only atmosphere, will be the same for all altitudes for those two outer widows, as observed at ground level, and therefore I just add them at higher altitudes to the output I get for the 500 to 850 band.
For the 500 to 850 band I use the "Atmospheric Paths" APP of SpectralCalc. This gives either transmittances or radiance outputs. Here I use the radiance output. The way this works is that there is a virtual source at ground level, for which you can put in a temperature of 288.2 degrees and an emissivity of choice. Again, I choose an atmosphere with only CO2, major isotopologue. A complication is that the U.S. Standard atmosphere is used in the scale factors. Therefore a scale factor of one does not correspond to 400 ppm of CO2, since back in the 70s the CO2concentration was less than this. For 400 ppm you must therefore use a scale factor of 1.212. The U.S. standard atmosphere is default for the SpectralCalc atmospheric path sections.
Here is my only non standard step: I use instead of 400 ppm a concentration of 1.7 times 400 ppm or 680 ppm. This corresponds to a scale factor of 1.212 times 1.7 or 2.06. Why do I do this? I am in effect using the "diffusivity approximation" as described in great length both in Pierrehumbert's text and Grant Petty's text. The idea is that if one does not wish to integrate the output radiance to obtain diffusive flux, one can approximate the result of integrating that radiance by multiplying the in band radiance by pi and simultaneously replacing all paths involved by a straight line path going at angle theta relative to vertical. Here I quote from the pages within Pierrehumbert that are not available in the URL http://cips.berkeley.edu/events/rocky-planets-class09/ClimateVol1.pdf
Quoting from Pierrehumbert p. 191: "...if the radiation field remains approximately isotropic, the decay rate is the same as for unidirectional radiation propagating at an angle theta such that cos theta = 1/2, i.e. 60 degrees..." Then "..the choice of cos theta = 1/2 is by nomeans a unique consequence of the assumption of isotropy....(under certain conditions) cos theta = 2/3 and this would ve an equally valid choice within the limits of the isotropic approximation..."
Petty staes on page 214..."The most commonly used value of (symbol for one over cos theta) is 5/3"
Note that my 1.7 factor is 1.666 or 2.3 rounded off and my angle is 54 degrees, not 60 degrees.
Furthermore in The Physics of Atmospheres by John Houghton third edition he states on pp. 11 - 12 that for Schwarzchild's Equation, to a good approximation the intensity may be replaced by the diffuse upward flux if B(T), [B(T) is the symbol for the black body emission per unit solid angle per unit area of a surface at temperature T] is replaced by pi B and the incremental increase in altitude dz is replaced by 5/3 dz."
At one time I went through the procedure of replacing vertical angle paths by paths at 54 degrees using a spread sheet. But I realized that exactly the same result is obtained by keeping the path vertical and replacing the concentration q by 1.7 q. Mathematically this must be the case since all the expressiont for transmittance in Pierrehumber involve the set of symbols F (q, theta) = q/cos theta. In the bottom of page 229, Pierrehumbert, his equation for the transmittance between pressures p1 and p2 is one minus the equivalent width where the equivalent width of a single Lorentzian line is one over delta (delta is he range of wave number considered)
time 2 times the square root the hitran line strength for a Lorentzian at at the base of the atmosphere times a different "strong line strength LS". The strong line strength contains together the set of symbols F = q/cos theta. This can be expanded to give the Curtis-Godsen approximation. I have tested whether the transmittance values I get from SpectralCalc and transform to angled paths at 60 degrees using a spread sheet are identical to the transmittance of a vertical path with q' = 2q . The agreement is exact!
Say I chose theta to be 60 degrees. Since for a vertical line cos theta is one, and 2q/one equals q/cos 60 degrees what I do is exactly equivalent to the "diffusivity approximation"
Bottom line....what MILA does is actually integrate over all angles. I use this approximation instead. The techical consultant at SpectralCalc tells me that what I am doing is an approximation to doing this a better way, where he would have used a "fouth order quadrature" whatever that is. He also told me that the same thing is true for the radiant atmospheric path APP as for the transmittance paths in Schwarzchild Equation, i.e. by multiplying the path length by 1.7 or by multiplying the concentration by 1.7 I can approximate the best way of going from intensity to diffuse flux which would use a "fourth order quadrature".
It works!! See post 8 above. The Science of Doom describes the method in their section on the "Greenhouse Effect" "The Equations"
You should also know that if you use atmospheric paths that are too long you get an error message in SpectralCalc to the effect that you have exceeded the one million point limit. Also, their are angled paths already available in SpectralCalc but they are real paths which are strongly refracted, and you need idealized paths that go in straight lines to use this approximation.
-
bjchip at 04:47 AM on 19 April 2017Yes, we can do 'sound' climate science even though it's projecting the future
It truly gets a bit absurd.
Think about the real reason for doing science. The evolutionary advantage reason for doing it. It is ENTIRELY about projecting the future.
All the explaining, the theory, the curiousity, the analysis, the data gathering, is about understanding what the real world does well enough to predict what the real world will do with enough time and certainty to change things.
Understanding "why" (which is what science is) allows preparation and changes to "what" ultimately happens. It is the root of every benefit of human civilization.
Moderator Response:[JH] The use of "all-caps" is prohibited by the SkS Comments Policy. The use of bold face font for emphasis is acceptable.
-
Daniel Bailey at 23:08 PM on 18 April 2017Arctic icemelt is a natural cycle
As Tom notes, both the Arctic sea ice and Antarctic sea ice are more than 2 standard deviations below the long-term average. So that point bears repeating.
Arctic Sea Ice (per NSIDC):

Antarctic Sea Ice (per NSIDC):

-
Daniel Bailey at 23:01 PM on 18 April 2017Arctic icemelt is a natural cycle
NASA's position on land-based ice sheet mass losses:
"Data from NASA's GRACE satellites show that the land ice sheets in both Antarctica and Greenland are losing mass. The continent of Antarctica has been losing about 118 billion metric tons of ice per year since 2002, while the Greenland ice sheet has been losing an estimated 281 billion metric tons per year. (Source: GRACE satellite data through 2016)”
Greenland Land-based Ice Sheet Mass Losses, per GRACE:

Antarctica Land-based Ice Sheet Mass Losses, per GRACE:

-
Daniel Bailey at 22:50 PM on 18 April 2017Arctic icemelt is a natural cycle
To sum, the earth is losing a trillion tons of ice per year:
- 159 Gt Antarctic land ice, McMillan el al, GRL (2014)
+ 26 Gt Antarctic sea ice, Holland et al, J Climate (2014)
- 261 Gt Arctic sea ice, PIOMAS
- 378 Gt Greenland, Enderlin et al, GRL (2014)
- 259 Gt other land based glaciers, Gardner et al. Science (2013)
Total = - 1,031 Gt
Losses outnumber gains by a ratio of 40:1
-
Humans on the verge of causing Earth’s fastest climate change in 50m years
Thanks Tom. (BTW - I live in Brisbane too)
-
Tom Curtis at 19:07 PM on 18 April 2017Humans on the verge of causing Earth’s fastest climate change in 50m years
BC @8, the gap appears compressed because of the use of a log scale on the y-axis. Further, the scenarios are defined for their forcing as at 2100. RCP 8.5 continues to expand atmospheric concentration long after that so that its final focing is significantly greater than 8.5 W/m^2. RCP 6.0, in contrast, maintains a near constant forcing after 2100. Finally, Twink12 is defined by the number of terratonnes of carbon emitted rather than by forcing (as I understand it).
-
Tom Curtis at 19:01 PM on 18 April 2017Humans on the verge of causing Earth’s fastest climate change in 50m years
Digby Scorgie @6, nobody knows, and the time will depend on the rate of fossil fuel burning. Further, to a certain extent, increased energy resources and be used to counter much of the economic effect of AGW, particularly in highly industrialized areas. A sufficiently irrational person could greatly extend the time before it became impossible to maintain the technological civilization needed to burn fossil fuels by burning fossil fuels faster and faster. (This strategy requires calous disregard for those whose economic situation isn't so favoured.)
I do not think the OP argues for so high a benchmark on disruption, ie, that it will significantly impair our ability to burn fossil fuels. I think it is arguing that at some point the level of economic harm and natural disasters will catastrophic, potentially to the point of negative economic growth and declining population. Our civilization can survive declines in both of low percentage; and with it our ability to burn fossil fuels will also be preserved should we be mad enough.
Prev 392 393 394 395 396 397 398 399 400 401 402 403 404 405 406 407 Next


