


 Arguments


Recent Comments
Prev 401 402 403 404 405 406 407 408 409 410 411 412 413 414 415 416 Next
Comments 20401 to 20450:
-
Rob Honeycutt at 01:20 AM on 15 March 2017It's the sun
JohnFornaro... This would be a more appropriate topic for this thread. Please repost your question there.
-
Sanjeev Ghotge at 01:09 AM on 15 March 2017The fossil fuel industry's invisible colonization of academia
Dear Drs Franta and Supran: As an older well wisher, former academic and technologist, please be advised that you have put your future careers on the line. But don't get intimidated, the stakes are the future of humanity and possibly , life on Earth. So here's some encouragement from a far corner of the universe viz India.
Sanjeev Ghotge
-
Jim Hunt at 01:08 AM on 15 March 2017Electric Cars are the Missing Link to a Zero Carbon Energy Grid
Michael - I have somewhat belatedly stumbled upon this article on my specialist subject! I tend to look at the subject through a UK lens, where we have particular problems due to our high latitude "maritime" climate.Why do you "doubt that cars can contribute more than a few percent of needed power at night"? Is that via an Antipodean lens?Here we don't have many air conditioners compared to the US and Australia, and although many folks don't like having it "in their backyard" there's lots more onshore wind around than solar PV.A "halfway house" to full bi-directional V2G technology is so called "smart charging":http://www.V2G.co.uk/2016/10/will-the-united-kingdom-become-an-electric-nation/Wouldn't that help in your neck of the woods too? -
PluviAL at 01:08 AM on 15 March 2017The fossil fuel industry's invisible colonization of academia
Word selection is ironic. US had a Neurosurgeon, denier, running for president. But then, I too had wrong information when I wrote my book related to the subject and underestimated the efficacy of alternative energy in 2013, and passed on wrong info.
The objective of the industry is clear, to maximize fossil fuel profits at the expense of the planet's viability, before the poison is shut down.
The solution seems just as clear, we need to fight to accelerate development of viable technology and policy. Policy is the tough one in the US. But the US is just the head and largest emitter per capita, the rest of the world needs to act for good policy, the US is broken for the next two years.
-
Rob Honeycutt at 01:03 AM on 15 March 2017Models are unreliable
Michael... I'm also old enough to remember it too. People born after the 1970's when the Clean Air Act was implemented just don't grasp what it was like. What I remember was both the thick black air and the smell of the local plastics factory, which was located right next to our neighborhood.
And I didn't grow up in NYC or LA. This was out in East Tennessee! The river that ran through town stank from the raw sewage that was being dumped there. The air was filty, especially in the winter when everyone was burning coal in basement furnaces to heat their uninsulated homes.
Ultimately, the cost of cleaning these things up is less than the costs they are imposing on the economy in the first place. I'm certain CO2 is going to be very much the same.
-
cMike at 00:57 AM on 15 March 2017The albedo effect
Thanks to all of you who read my post. It had been quite a while since the previous one. I was attracted to this site because I was looking for albedo related facts, especially related to the delta effect of the loss of arctic sea ice. I have read extensively about global warming and actually do know about the role of water vapor (i.e., the water cycle), clouds as contributors to the albedo effect and the thermal heating aspects of CO2 on the atmosphere. That said, assertions that things are more complicated than what I included, while true, kind of miss the point.
Focusing on thermal warming of the atmosphere suggests that it is the atmosphere's warming that is the problem. Yet the truth about global warming is that it is ultimately about warming of the oceans and the temperature of the air is almost irrelevant compared to the solar energy impinging on the oceans and the evaporative cooling that offsets it. In other words the heat transfer from air to water is negligible. So what would warm the oceans? My first post posits a mechanism: solar warming of arctic seas no longer hidden under sea ice. What I had hoped to find was some analysis that computed the area of lost ice and calculated the difference in reflectance between ice (ok 90% isn't perfect) and water to estimate the added energy absorbed. I keep hearing comments about how much greater the effects of "global warming" are in the arctic but never a why. I'm describing the why here and hope somebody can help quantify it.
-
Rob Honeycutt at 00:53 AM on 15 March 2017Models are unreliable
SCE... (We have a rule here about no piling on. I see we have four against one going here, so apologies. Just say something if you'd prefer to drop this back to just one specific line from one commenter and the rest of us will oblige.)
For my part, I'd just like to point out that the discussion keeps going the same direction to focus on possible reasons for lower CS. Again, this may turn out to be the case, but there are as many (if not more) reasons to believe that CS might be higher than IPCC central estimates.
When the Montreal Protocol was implemented industry had been screaming that it would be a business killer. Entire industries were going to be decimated by this attempt to regulate SO2 emissions to address acid rain. After it was implemented, quite the opposite happened. There were costs involved but it ended up being far less economically impactful than estimates.
We have a far more critical situation with CO2. Even if CS is 2°C, that would only mean we have an additional decade (maybe) to address the problem. If CS ends up being higher... then we're really behind the 8 ball. By all estimates the most rational response is to agressively start addressing this asap. The scientific community has been saying this for a long time and politicians have failed to respond, and they've failed to respond specifically because of efforts by the fossil fuels industry to seed doubt in the minds of the general public. Curry and Lewis are very much part of that effort.
-
JohnFornaro at 00:52 AM on 15 March 2017It's the sun
Hi all. I've posted hardly at all on this site due to time constraints. However, I have read the first page very carefully, particularly following BioCab's comments, partly because my predilection is that AGW is probably happening, but that mankind's affect on the climate is not catastrophic.
One of the issues that came up in Page 1, back in 2007, is the argument that warming is likely to be causing CO2 release. This argument is that mankind, while emitting a lot of CO2, is not the major CO2 emitter on the planet. I understand the argument that it is thought that the minsiscule amount of CO2 that is emitted by mankind is forcing the warming, but the apparent leverage of that warming has not yet been proven.
My question is this: Does anybody know which page on this thread presents the 'Warming is Releasing' argument? Or is it the case that the "Warming is Releasing" argument resides on it's own page?
Thx! JF -
MA Rodger at 00:45 AM on 15 March 2017Models are unreliable
SemiChemE @1012,
You disagree with opinion expressed in this thread, in that you consider that Curry's GWPF paper does have a place here in scientific discussion. Given the main thrust of Curry's GWPF paper reiterates Lewis & Curry (2014) which carries no such dispute, can you make clear what it is in Curry's GWPF paper you feel is necessary to include in this discussion but which is absent from Lewis & Curry (2014).
I should make plain my position. I have in the past examined a number of GWPF papers and found them "consistently wrong and entirely flawed." GWPF policy papers are thus entirely without scientific credibility. They actually make rather good comedy. -
Doug Mackie at 20:31 PM on 14 March 2017To tweet or not to tweet at Donald Trump? That was the question!
Tweet 23: “Leave all that limestone be & it stores that carbon. Stops it going any place else. Limestone is a carbon SINK.” Comment above: “limestone weathering is net neutral” Additional Issues: 1) Goal post shifting: This post (discussing basalt) was an egregious example of goal-post shifting. My original complaint (re tweet 23) was to say that the weathering of limestone is not a source of carbon; because in fact calcification is a source and weathering is a sink (see 2d). 2) Misdirection: Yes, you can use the equations to show basalt as a source during weathering but a) Discussion was about limestone b) See OA not OK for discussion about equilibrium constants. And see any 1st year chem text for discussion about rate constants in the context of “spontaneous” and equilibrium constants. c) Basalt (and limestone for that matter) are part of slow carbon cycle. I and others pointed this out. This means that both (but especially basalt) are utterly irrelevant to CC and OA. d) Torturing a definition is always a sign of a weak argument and has been covered at sks many times. Goal post shifting and misdirection are tactics that sks rightly excoriates deniers for. Why do it here? 3) Caps ban: Going to have to agree to disagree on this one. If you want to post tweets containing caps then you have to accept caps in responses. Let’s play the imagine game: Imagine DJT and seen and responded. I bet you would have engaged on content and would not have edited. It came across as pure pettiness. I signed my name and was not trolling. Given my authorship of the entire series of OA not OK, I am clearly a communicator and a little bit informed about the relevant chemistry. I was participating within the 140 chr rules of the game you had initiated. My $0.02 on what you should have said re original tweet 23:“Oops. Ha ha. Yes, you are right, limestone is not a sink (because to make it some CO2 was released). Anyway because it would be part of the slow carbon cycle it is irrelevant to us over the next couple of hundred years. Oh, and as for that stuff about basalt? Yeah, sorry about that.” Thanks to Phil for the chat. Tom Curtis: See OA not OK book for instructions on drawing your own speciation plot.Moderator Response: man, where did the para breaks go? -
Doug Mackie at 20:28 PM on 14 March 2017To tweet or not to tweet at Donald Trump? That was the question!
Tweet 23: “Leave all that limestone be & it stores that carbon. Stops it going any place else. Limestone is a carbon SINK.” Comment above: “limestone weathering is net neutral” Additional Issues: 1) Goal post shifting: This post (discussing basalt) was an egregious example of goal-post shifting. My original complaint (re tweet 23) was to say that the weathering of limestone is not a source of carbon; because in fact calcification is a source and weathering is a sink (see 2d). 2) Misdirection: Yes, you can use the equations to show basalt as a source during weathering but a) Discussion was about limestone b) See OA not OK for discussion about equilibrium constants. And see any 1st year chem text for discussion about rate constants in the context of “spontaneous” and equilibrium constants. c) Basalt (and limestone for that matter) are part of slow carbon cycle. I and others pointed this out. This means that both (but especially basalt) are utterly irrelevant to CC and OA. d) Torturing a definition is always a sign of a weak argument and has been covered at sks many times. Goal post shifting and misdirection are tactics that sks rightly excoriates deniers for. Why do it here? 3) Caps ban: Going to have to agree to disagree on this one. If you want to post tweets containing caps then you have to accept caps in responses. Let’s play the imagine game: Imagine DJT and seen and responded. I bet you would have engaged on content and would not have edited. It came across as pure pettiness. I signed my name and was not trolling. Given my authorship of the entire series of OA not OK, I am clearly a communicator and a little bit informed about the relevant chemistry. I was participating within the 140 chr rules of the game you had initiated. My $0.02 on what you should have said re original tweet 23: “Oops. Ha ha. Yes, you are right, limestone is not a sink (because to make it some CO2 was released). Anyway because it would be part of the slow carbon cycle it is irrelevant to us over the next couple of hundred years. Oh, and as for that stuff about basalt? Yeah, sorry about that.” Thanks to Phil for the chat. Tom Curtis: See OA not OK book for instructions on drawing your own speciation plot. -
michael sweet at 16:52 PM on 14 March 2017Models are unreliable
SCE:
Did you read the US Climate Change report I linked earlier? It is already costing us a lot dealing with the changes that have already occured. The drought that started the Syrian war was the worst drought they have had in 900 years. Does that seem like a coincidence, or was it caused by AGW?
According to Jacobson (which is peer reviewed), if we switch to renewable energy (WWS) it will save money, create more jobs, solve AGW (at least stop adding to the damage) and result in a dramatic lessening of pollution. Currently over 13,000 people in the USA die every year from air pollution from coal burning power plants. Additional combustion results in tens of thousands more premature deaths. You want to continue this for what?
Please cite a peer reviewed report that backs your claim that changing to renewable energy will be bad for the economy. You appear to be citing worries from propaganda on the internet.
You have not addressed the cost of continuing to use fossil fuels. The cost of sea level rise alone is trillions of dollars, even if we count the cost of the dead (and their health care before they die) as zero. What is the cost of treating fossil fuel caused disease like asthma and heart disease?
If we were to start to seriously start to build out WWS and it turned out to be bad for the economy we could easily just stop the build. It would cost less than the Iraq war to build out a complete WWS system for the USA so that we no longer needed to import oil forever.
What are you fearful you need to defend? Are you old enough to remember the terrible pollution problems from the 1960's and '70's? I am. It was almost as bad as China today. Air was unbreathable across the US. The fossil fuel executives currently in charge of EPA want to return to air that cannot be breathed. Is that what you want? If not, how do you propose to move forward?
-
Glenn Tamblyn at 15:00 PM on 14 March 2017Models are unreliable
SCE
Another aspect that paleoclimate can tell us a bit about is sea level. The transition out from the last glacial maximum saw sea level rise by 120 meters of more. The map of the world looked different then. There is still enough ice left in Antarctica and Greenland to raise sea level andothe 65-70 meters if it were to melt - essentially a 5 C warming melted 2/3rds of the ice present at the LGM. How much warming to melt the rest?
The previous inter-glacial period the Eemian 125,000 years ago was lightly warmer than the current one (before we started raising the temperatuire) Temperatures during the Eemian were something similar to todays. And sea level was 5-9 meters higher than today. If we look for when CO2 levels were last around 400 ppm we have to go back around 3 million years, to the middle Plieocene. There were still glacial cycels but they were warmer. Theinter-glacials appear to have had CO2 levels around 400 pp or so. Temperatures were 2-3 C warmer than today, and sea level was 10-20 meters higher. So just with what we have done so far, if CO2levels don't drop, we would appear to have locked in many meters of sea level rise. It isn't just this century that this will happen, it will last for centuries.
But we are still raising CO2 levels. At current emission rates we could get to 600-700 ppm by the end of the century. To find a period like that in the past we now need to go back 30+ million years. Back to when the Antarctic ice sheet was only just starting to form. We are certainly capable of taking CO2 levels to that height. If we still haven't reigned in emissions we could almost lock in sea level rise of many 10's of meters over subsequent centuries, and possiby millenia.
Flood Myths are a common feature of many cultures, from the Epic of Gilgamesh to the Bible. Queensland Aborigines have oral traditions telling of how their ancestors walked the hills we now call the Great Barrier Reef.
In the centuries ahead, those times of myth will be returning. The seas will rise, thats what they have done in the past. -
SemiChemE at 14:49 PM on 14 March 2017Models are unreliable
scaddenp @1019 - I'm afraid you are missing the point. I do not claim that the satellite data set is the best. Rather that only in the satellite era do we have a spacially dense data set adequate for capturing most of the relevant phenomena that must be captured and calibrated in the models.
I'm completely fine with climate scientists using a hybrid record, incorporating surface records, radiosonde data, satellite data, and Ship-based and buoy based observations to make the best data set possible. But, my point is that only in the satellite era has such a data set been possible.
Furthermore, since we are only 40 years into this era, we are barely half-way through a complete Pacific Decadal Oscillation, which appears to be one of the larger sources of natural climate variability. For these reasons, modelers must make assumptions about natural climate variability that may or may not be true. Once we have observed a complete cycle, we'll be in a much better position to verify or refine these assumptions as necessary. This will lead either to improved model verification, which will significantly increase our confidence in the existing models or development of refined models that are much more accurate.
-
Glenn Tamblyn at 14:25 PM on 14 March 2017Models are unreliable
SemiChemE
Although we don't have multiple planets to run experiments on, we do have a long history of climate on this planet. Paleoclimatology is able to estimate climates going back 100's of millions of years. And one recent meta-study put all this together to estimate what climate sensitivity actually was from that history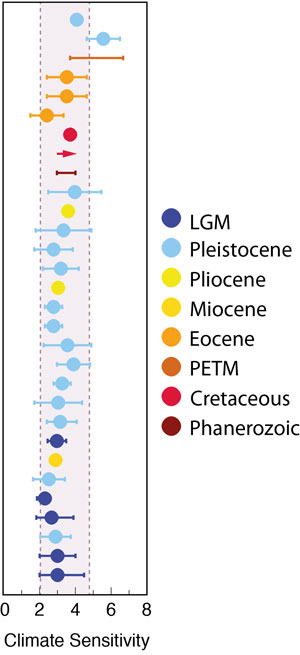
Thus graph is adapted from the PALEOSENS study. The study looked at several dozen papers that had estimated climate forcings and sensitivities over various geological ages. It harmonised the methods they had used to produce a common method of estimating sensitivity to a radiative forcing, due to CO2 or anything else. Then John Cook applied the accepted forcing from CO2 - 3.7 W/M2 per doubling of CO2 to get ECS.
The different periods are LGM - Last Glacial Maximum, 20,000 years ago. Pleistocene/Pliocene - millions of years ago. Miocene/Eocene 10's of millions. PETM (Paleocene/Eocene Thermal Maximum) was a period 55 million years ago where a rapid warming event occurred, The Cretaceous is the end of the age of the Dinosaurs up to 65 million years ago, and the Phanerozoic is the entire period back to 420 million years ago.
As you can see none of these studies suggest particularly low values for ECS. A few do suggest higher than 3 and there are several outlier studies that John hasn't included that do suggest even higher values.
To me the Earth has run the experiments for us and these are the results. ECS of less than 2 seems very unlikely.
A second aspect we learn from paleo studies is about speed. The LGM was probably 5 C colder than now as a global average. The warming (and retreat of the ice sheets) took around 10,000 years. so 0.05C/century. Now temps are rising at of the order of 1 C/century and that might increase. CO2 varied over the same period, rising by around 100 parts per million (ppmv) from 180 to 280. Thats 1 ppm/century. Today CO2 is rising at around 1ppm every 20 weeks.
During the PETM, temperatures spiked up by around 6 C, a small extinction event happened and an ocean acidification event. A sediment core sample from Svalbard from this period puts the rate of change of CO2 concentrations then at only 1/10th tha pace of today.
To find a geological period where CO2 concentrations rose probably faster than today we have to go back 252 million years, to the end-Permian Mass Extinction event. A vast volcanic event lasting 10's and possible 100's of 1000's of years in Siberia included periods where CO2 levels may have risen faster than today. The end-Permian event saw 75% of families of species on land go extinct, 96% in the oceans.
Where changing climate is concerned, 'Speed Kills'. -
SemiChemE at 14:22 PM on 14 March 2017Models are unreliable
Rob Honeycutt @1016 - My understanding is that one of the largest sources of natural climate variability is the Pacific Decadal Oscillation. I am by no means an expert, but my understanding is that this phenomenon has a period of 50-70 years (see wikipedia). As stated before, we are roughly 40 years into the satellite era, so presumably we have observed roughly 2/3's of one cycle with a relatively dense data set (eg. the satellite record). I believe that once we have observed a complete cycle (or perhaps even a bit sooner), our understanding of this major natural process will greatly improve and as a result, our ability to model it properly will also improve. Thus, I'm anticipating a significant advance in the modeling accuracy within the next two decades. Presumably, this will lead to significant improvements in the precision and accuracy of model-based ECS estimates.
Note, I'm not saying that the satellite data set is perfect or the best temperature measurement, but it is the only set with nearly complete coverage of the earth's atmosphere. Thus it is the natural data set for use in calibration and validation of models designed to cover the atmosphere.
-
scaddenp at 13:54 PM on 14 March 2017Models are unreliable
"rather that only in the satellite era do we have a spacially complete dataset. Before this time, there are huge gaps in the temperature record, especially over the oceans, which constitute roughly 71 percent of the Earth's surface and in sparcely populated regions"
Still caution here. Satellite temperatures derived from MSU (UAH, RSS) are attempting (with large errors) to measure the temperature from a several kilometer thick chunk of lower troposphere. They cannot measure surface temperature. Comparing surfaceSAT records (eg GISTEMP, BEST, C&W) use ship and bouy data to cover the ocean, supplemented by satellite derived estimates. The estimates of trend from SATs have lower uncertainities that those from MSU (see here for more discussion and comment there if you want to discuss this further)
-
Rob Honeycutt at 13:08 PM on 14 March 2017Models are unreliable
"...the social costs of planning for an overly pessimistic ECS would also be tremendous."
When economists look at these questions, that's not what they're telling us. They're saying, very clearly, the most economical thing to do is to invest now in mitigation. It only gets worse the longer we wait.
-
Rob Honeycutt at 13:06 PM on 14 March 2017Models are unreliable
SCE @1015... But no one is even close to planning for overly pessimistic scenarios. Even the scenarios that are as likely as Curry&Lewis are in the 4-6°C range. We're challenged to just get a rational carbon tax that could even start to address a 3°C scenario. We're currently trotting along almost as if CS is near zero, and we've been doing that for the past 30 years while the scientific community has been telling us that we have a critical problem.
That said, a lot is happening with renewables that people should be cautiously relieved by. But that's not progressing anywhere near fast enough to deal with just a central estimate of 3°C.

-
Rob Honeycutt at 12:59 PM on 14 March 2017Models are unreliable
SemiChemE... It could be much longer than decades before we have a highly accurate estimate of CS. This is a problem that's been worked on for many decades and the range has remained essentially unchanged. The satellite record is a very poor data set to use for these purposes because the uncertainty of that data is much higher than the surface temperature data.
The higher end CS uncertainties are not going to be resolved by better estimates coming from either satellite or surface station data since the higher end uncertainties revolve around (in part) things like methane releases from permafrost and clathrates.
You need to understand, we're approaching uncharted waters relative to at least the past 2-3 million years once we push past 2°C over preindustrial.
It's becoming a bit of a cliche phrase now, but uncertainty is not our friend. Uncertainty is a case for stronger action, rather than inaction.
-
SemiChemE at 12:52 PM on 14 March 2017Models are unreliable
Rob Honeycutt @1013 - While I agree that planning for the best case scenario would be a mistake, the social costs of planning for an overly pessimistic ECS would also be tremendous. While its easy to say these costs should be born by the wealthy and are a minimal sacrifice, the reality is that in both scenarios, the bulk of the costs will be born by the poor, who cannot afford them. So, in the end it is critical that we get it right, which means understanding the limitations of the models and continuously improving them.
-
SemiChemE at 12:03 PM on 14 March 2017Models are unreliable
michael sweet @1007 - Certainly, the surface temperature record has its place and I did not mean to imply that the satellite data was the only valid dataset, rather that only in the satellite era do we have a spacially complete dataset. Before this time, there are huge gaps in the temperature record, especially over the oceans, which constitute roughly 71 percent of the Earth's surface and in sparcely populated regions (Antarctica and large regions of Russia, Africa, South Amercia, etc...).
Without a spacially complete dataset, it is impossible to verify whether a particular model properly distributes heat across the planet. Further this adds significant uncertainty to attempts to understand the relative contributions of CO2 and other natural sources of climate variability, since there could be local temperature variations, which the sparce temperature records do not capture.
Like you said, paleoclimate data is great in that it covers very long time periods, but again it tends to be even more sparce and somewhat less precise, again leading to significant uncertainty.
For these reasons, we are likely still decades away from having a highly accurate estimate of climate sensitivity to CO2.
-
michael sweet at 11:09 AM on 14 March 2017CO2 effect is saturated
Thanks Tom, I misread the graph. I will have to read your posts about this graph more closely.
-
Rob Honeycutt at 10:49 AM on 14 March 2017Models are unreliable
SemiChemE... What all this comes down to is risk assessment. If you're assessing risk you shouldn't pick one best case scenario. You need to look at the full range.
Who knows. Curry and Lewis might be correct about CS. There are reasons that other researchers believe their assessments are wrong (glacial-interglacial feedbacks being one). But are you really going to risk global lifesupport systems for generations based on a best case estimate?
I'd suggest it's probably more rational to base a course of action on higher end CS estimates. Plan for the worst but hope for the best.
-
SemiChemE at 10:35 AM on 14 March 2017Models are unreliable
Tom Curtis @1005 the point of my comment was that the models still contain a great deal of uncertainty, which limits their usefulness for predicting long-term climate trends and the impact of CO2 emissions on those trends. This is self-evident from the CMIP5 model estimates of ECS: 3.22 (2.1-4.7), mean (5%-95%). Thus, even the best models show a fairly large range of sensitivities, likely spanning more than a factor of 2.
Lewis and Curry's analyses suggest that the real climate sensitivity could be even less and thus the models may have even more uncertainty. While it's fair to criticize some of their assumptions and argue that similar analyses, such as those you cited by Otto are more likely to be accurate, even Otto's modal value of 1.9C is below the 5% lower limit of the CMIP5 models (2.1). This suggests the models are still imature and as a result, there is a reasonable possibility that they overstate the impact of CO2.
Finally, I disagree with your last statement that Curry's analysis need not be considered in a science based blog. She and Lewis show plausible (though possibly unlikely) scenarios consistent with a low ECS. Even the IPCC fifth assessment does not rule out an ECS as low as 1C. Rather, if you want to make a rational science-based case for why we should be concerned about global warming, you should instead be prepared to show which of their assumptions are weak and why a higher ECS is considerably more likely.
-
Tom Curtis at 09:52 AM on 14 March 2017CO2 effect is saturated
Michael Sweet @440, the graph doesn't show that.
Rather, it shows energy transfers across the surface/atmosphere and atmosphere/space boundaries. It does not show the relative proportions of energy transport at any particular altitude (or averaged across all altitudes) within the troposphere. The former because that will change with altitude, and the later because of its design.
Further, even if it did show the proportion of the energy transfer mix within the troposphere, the relevant values would be net radiant energy transfer (57.9 W/m^2) vs energy transfer by convection (86.4 W/m^2) and latent heat transfer (18.4 W/m^2) giving respective percentages of 35.6%, 53.1% and 11.3%.
-
scaddenp at 09:46 AM on 14 March 2017CO2 effect is saturated
In terms of how far CO2 measurement has improved since Wake's 1969 paper, see Fouchier 2011. And for spatial mixing, it is hard to beat NASA's 1 year video of CO2 from NASA
-
Tom Curtis at 09:43 AM on 14 March 2017CO2 effect is saturated
Wake @436, I would certainly be interested in a citation of the scientific article from which you conclude that at"... the tropopause there is a sharp drop of CO2 presence into the stratosphere ...". I am aware of Georgii and Jost (1969) who find a "quite sudden change of about 3–5 p.p.m. CO2 is usually observed at the transition from tropospheric into stratospheric air and vice versa". I am also aware of Bischof et al (1980) and there conclusion that "...the CO2 mixing ratio is not constant with altitude but rather decreases in the stratosphere, by about 7 p.p.m.v., between the tropopause and 33 km", along with their speculation that the variation is because "...recently increased concentrations of CO2 in the troposphere have not propagated far into the stratosphere". I am further aware that up to the mesopause, CO2 concentrations stay within 16 ppmv of contemporary surface values:

{Source: Emmert et al (2012) ; 2004-2012 mean of upper atmosphere CO2 concentrations. Contemporary surface value (Mauna Loa): 385.7 ppmv}
My problem is that none of these seem qualified as "a sharp drop". Indeed, even the 16 ppmv difference between the tropopause and the mesopause represents only a difference in radiative forcing of 0.2 W/m^2 if it were applied across the whole atmosphere. It applies, however, not across the whole atmosphere but over that part which has an optical depth of less than one, ie, were IR radiation typically escapes straight to space with the consequence of minimal further impact on the greenhouse effect.
Regardless of impact on the greenhouse effect, the fact that CO2 concentrations at 80 Km altitude are a close approximation of those at 10 Km altitude refutes the idea that there is significant gravitational sorting of concentration below the thermosphere. That is further refuted by Aoki et al (2003) who show from d13C concentrations that:
"This quantitative agreement of Δδ13C/ΔCO2 indicates that the vertical profiles of CO2 concentration and δ13C observed in the lower stratosphere over Japan, Scandinavia and Antarctica were thought to be formed by the height-dependent poleward transport of tropospheric air intruded into the stratosphere in the tropical region."
-
michael sweet at 09:33 AM on 14 March 2017CO2 effect is saturated
Wake,
This graph, originally posted above at 430 (and many other locations) by Tom Curtis,

shows that only 20% of energy transfer in the Troposphere is from conduction and latent energy according to measured data. Please provide a reference to support your claim that " the lower atmosphere transfers heat more in conduction mode that radiation". Since measured data indicates that the majority of energy is transferred by radiation, CO2 is indeed more important than conduction.
Mixing is very slow compared to radiation transfer of energy. The atmosphere is always layered. Look at the clouds. Many days there are two or three (or more) layers of clouds. The first picture is visible on any long airplane trip.
A change of 4 ppm at the Tropopause is too small to be visible on the graphs Rob Honeycutt posted. It is an insignificant change. It was an interesting factoid for me to learn. The scientists who study the atmosphere undoubtedly already know this factoid.
-
Wake at 08:56 AM on 14 March 2017CO2 effect is saturated
If you look at http://www.nature.com/nature/journal/v221/n5185/abs/2211040a0.html you will see that through direct measurements there is a 3-5 ppm step from the tropopause to the stratosphere. The stratosphere starts at about 15 km altitude and that step is not shown on that graph of yours. I would therefore question that source.
And in any case isn't the more important point that the lower atmosphere transfers heat more in conduction mode that radiation? If this is so we can assume that heat is reaching the upper atmosphere via the entire atmosphere and not any specific gas. Once above the cloud levels it would appear that the lower latent heat content of CO2 and Tom Curtis' explantion of heat radiation would be more applicable.
I would also question Michael Sweet's idea that the atmosphere doesn't have large scale mixing by showing unusual conditions of atmospheric layering.
Moderator Response:[PS] Fixed link
-
Rob Honeycutt at 08:50 AM on 14 March 2017CO2 effect is saturated
Here's another graph showing the vertical profile of 4 major greenhouse gases.

Source: Earth and Planetary Sciences » "Global Warming - Causes, Impacts and Remedies", book edited by Bharat Raj Singh , ISBN 978-953-51-2043-8, Published: April 22, 2015
-
Rob Honeycutt at 08:21 AM on 14 March 2017CO2 effect is saturated
Wake... "Direct tests have shown a sharp drop in CO2 with altitude."
I don't think so...

[Source]
-
michael sweet at 07:56 AM on 14 March 2017Models are unreliable
Tom
Thank you for the update. I apologize to Nic Lewis.
Imagine my surprise to hear that Nic Lewis' result is now consistent with the IPCC. 2016 will bring him higher still. Interesting that Curry reports only the lowest estimate. I wonder why ;P.
Using GISS data baseline 1880-1910 and now as 1996-2016 I get a difference of 0.94C while Lewis shows only 0.75C for similar times. Lewis is probably using HADCRU which is biased low at current times. Before 1880 GISS does not estimate temperature because they think there is not enough data. If Lewis used GISS his estimates would be even more similar to the IPCC.
-
Wake at 07:42 AM on 14 March 2017CO2 effect is saturated
I am having trouble following an argument that doesn't take into account the mass of the individual gases. CO2 weighs almost three times what oxygen does and takes up two thirds the space. Direct tests have shown a sharp drop in CO2 with altitude. At the tropopause there is a sharp drop of CO2 presence into the stratosphere demonstrating that while mixing may occur in the heavier, lower, atmosphere the fact that CO2 is a heavier component is still there and CO2 is still much higher near the ground than higher. In the heavier troposphere most of the transmission of heat is due to conduction and not radiation. This leaves one wondering why we are even considering 100 ppm change in a minority gas, that has a lower heat content than other gases, being considered as any sort of problem.
-
Tom Curtis at 06:52 AM on 14 March 2017The albedo effect
cMike @84, first many people have produced good, sucinct explanations of the greenhouse effect. Here at Skeptical Science you have two such explanations by Chris Colose (The Planatery Greenhouse Engine Revisited; and Joseph Postma and the Greenhouse Effect Pts 1 & 2). Pitched for easier comprehension, there is also my post on the subject (which, of course, I recommend).
Beyond that, your explanation contains a number of small, and one larger error. The larger error is that greenhouse gases do not simply reemitt the energy absorbed by radiation. Instead that energy is typically transfered to other molecules by collisions as either kinetic energy or changes in excitation states. In short it is thermalized, that is converted into kinetic heat energy. At the same time, a certain percentage of greenhouse gas molecules will always be in an excited state because the temperature of a gas, with the percentage depending on the temperature of the gas. That means the greenhouse gases will radiate at a rate dependent on their temperature, with the radiation going equally in all directions.
With regard to minor points, Ice has an albedo around 0.9, but snow has an albedo that depends on its age, and varies from 0.5-0.9, with lower values to be found in older snow. That is very important because typically sea ice is covered by snow. Further, clouds alone add an albedo of about 0.2 to the Earth, but the total albedo is only 0.3 because of overlap.
Finally, here are the relative strengths of various feedbacks as determined by the IPCC AR5:

P is the Planck feedback, which determines the temperature response to a forcing with no other feedbacks. WV is the Water Vapour feedback. LR is the Lapse rate feedback. WV&LR is the Water Vapour plus Lapse Rate feedback. They are shown coupled like that because they are related to each other, with the result that uncertainty is the combined feedback is much less than that in each seperately. C is the cloud feedback, which is the most uncertain of all the major feedbacks. Finally, A is the albedo feedback from changes in ice and snow. It is 18.75% of the strength of the water vapour feedback, which is the strongest of the positive feedbacks.
The figure is Figure 9.43 and the tabular data from which I calculated relative strength is from Table 9.5.
-
michael sweet at 06:49 AM on 14 March 2017Extreme weather isn't caused by global warming
SemiChemE,
It is more complicated that just the change in diurnal temperature. The US Climate Change Assessment (from 2014) is the best source of scientific information about changes in the USA. If you are not from the USA, the information there will generally be similar to other parts of the world. Effects vary a lot from region to region.
The most consistent predictions are that heat waves, drought and flooding will increase. During the winter that means heavy snows (like they currently are having the the USA). Significant increases in heavy precipitation have been measured across the entire USA but are most pronounced in the North East where there has been a 70% increase in the heavist precipitation events. (Heavy precipitation = more floods). Hurricanes like Sandy are more common already. Indeed, Sandy was the latest hurricane in recorded history in the North East by several weeks. Record heat waves are already common.
It is unclear if the total number of Hurricanes will increase or decrease, but the strongest hurricanes are expected to be more common. Already hurricanes average about 15mph stronger than 50 years ago. Since the power of the wind goes up with the cube of the speed, 15 mph is a big effect. Some models suggest that the melting Greenland Ice sheet will cool off the North Atlantic so much that super storms start to occur. Hopefully those models will turn out to be incorrect.
We may get lucky and less diural difference means less extreme weather. Or we may not be lucky and more energy in the system means more and stronger storms. In either case we expect more floods and more drought. Meters of sea level rise are also a given. The question is how fast the sea level will rise. Don't buy land in Miami.
The report I cited is much less biased than I am. See what they say.
Watts Up With That is a site well known for misleading and outright false reports. If you want to understand the science be careful about who you trust on the internet. Scientists recommend Skeptical Science.
-
Tom Curtis at 06:22 AM on 14 March 2017Models are unreliable
michael sweet @1009, in fact Nic Lewis has updated his estimates, at least to include 2015 data. As he needs updates on forcings and OHC as well as temperatures, we may need to wait until late April for his 2016 update.
The update is in fact the Lewis (2016) cited by Curry. He produced a table of updates and alternative estimates as follows:
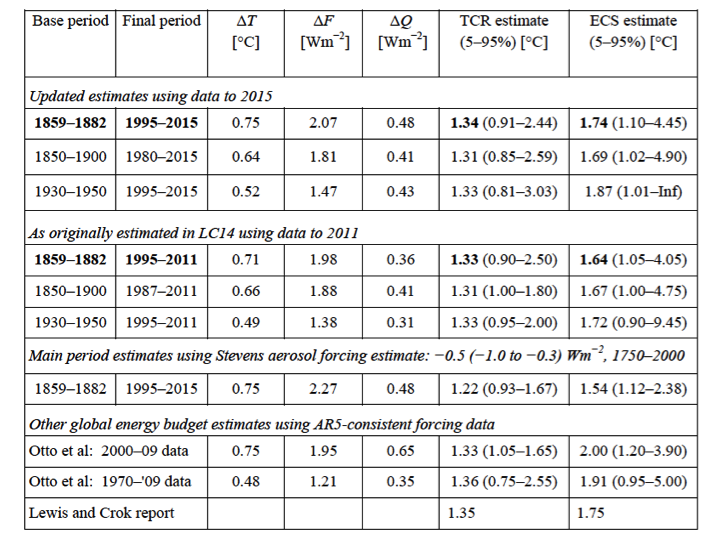
Unsurprisingly, Curry reports only the lowest estimate of ECS on the table.
The other estimates are consistent with, or higher than the AR5 estimate (bearing in mind they are modal values). The differ significantly from the AR5 estimate only in having (for the most part) tighter uncertainty bounds. That in turn is due to their all coming from a single method, whereas the IPCC allowed consideration of other emperical estimates as well. That is, Nic Lewis (and Judith Curry) increase their certainty that ECS will be in the low end of the IPCC range by the easy expedient of excluding relevant data (and other methods of analysing the data they use).
-
Rob Honeycutt at 06:00 AM on 14 March 2017The albedo effect
cMike... Your description is okay, but it's really only one piece of the puzzle, and is something that's been well understood for many decades. There's quite a lot more science involved to explain how CO2 operates in the atmosphere to warm the planet. We have lots of articles here at SkS that you can read. A good place to start is the SkS welcome page.
-
cMike at 05:47 AM on 14 March 2017The albedo effect
The doubts about CO2 warming effects have never so far been answered by useful dialogue describing in compelling ways how CO2 warming actually happens. Let me offer the following:
The sun warms the earth but about 30% of the sun's energy is reflected back into space by snow and ice, which perfectly reflect the wavelengths of energy coming from the sun. The atmosphere is transparent to the sun's energy so all that reflected energy escapes to space. The other 70% is absorbed by the earth and then re-radiated at longer wavelengths. Most of those wavelengths pass on through to space but a cluster around 15 nanometers is absorbed by CO2 and then re-radiated, half toward space half toward earth. That incoming 15 nanometer energy is not reflected by snow and ice. Instead they absorb it completely and it causes them to melt. That's why glaciers all over the world are melting (not because the air is warmer). That also explains why the sea ice in the Arctic has been disappearing in the summer. Now that the ice is gone the energy of the summer sun beams down on open Arctic water instead of ice and is absorbed instead of being reflected. That changes the energy balance of the earth. The effective albedo around the North Pole has changed enormously. I submit that this is probably the largest contributor to global warming and find it more than strange that nobody seems to have commented on this as a compelling explanation of global warming. -
michael sweet at 05:05 AM on 14 March 2017Models are unreliable
Tom,
I am puzzled to learn how Nic Lewis can estimate that the sensitivity to a doubling of CO2 is 1.5 - 1.6C when in 2016 the temperature was already about 1.5C above pre-industrial. Hansen estimates about 0.6C in the pipeline and we are nowhere near doubing CO2. Granted that 2016 was an El Nino year, but that only adds about 0.1C to the temperature.
Nic Lewis initially made his estimates in about 2012 when the temperature had risen slowly for a few years. SInce the temperature has risen so quickly the last three years, I would epect that Nic would need to rework his calcualtions. I doubt that Mr. Lewis or Dr. Curry will redo the calculations.
-
Tom Curtis at 03:44 AM on 14 March 2017Models are unreliable
michael sweet @1007, to add a bit of irony, the two estimates of climate sensitivity on which Curry, and hence SemiChemE rely on depend on comparing current temperatures and Ocean Heat Content with that from the late 19th century. What is worse, they do not use the only empirical data regarding the change in OHC since the late 19th century. Rather, they use model estimates. That means that if we reject the models as insufficiently accurate, we must also reject Nic Lewis's estimate of the ECS.
-
Tom Curtis at 03:35 AM on 14 March 2017We're heading into an ice age
CO2 levels are now above 400 ppmv, 33% higher than at anytime in the last 800,000 years:

Of course HydrogenOne concludes from this that temperature in the Eemian was similar to that today, and in the face of strong orbital forcing, it fell back into an interglacial, the much stronger CO2 forcing, and much weaker orbital forcing today will also drive us back into an interglacial. No doubt it is the massive loss of NH albedo due to the loss of sea ice that convinces him of this:

(2012 Aug arctic sea ice (purple) overlaid on 1938 Aug arctic sea ice.)
-
Tom Curtis at 03:26 AM on 14 March 20172017 SkS Weekly Climate Change & Global Warming Digest #10
The chart of changes in atmospheric CO2 is very interesting because it shows a relationship between changes in CO2 level and annual temperatures. The dip in temperatures relating to the Mount Pinatubo eruption (1992) is very prominent, as are the peaks in 1987/88, 1998, 2005, 2007, 2010, 2015 and 2016, all of which set globa temperature records at their time (and most of which were El Nino years). There are some exceptions. 2012 shows a massive increase despite being a cool year (for its decade), and 2014 barely increases over 2013, despite being a record warm year at the time.
This relationship at least partly is caused by the fact that the ability of sea water to absorb CO2 is a function of temperature. In cool years more of the annual anthropogenic emisssions are absorbed. In warm years less. That results in a smaller atmospheric increase in cool years, and a larger one in warm years, even though the total increase is always 100% anthropogenic.
It does mean, however, that looking at the annual atmospheric increase is a poor way of estimating annual anthropogenic emissions. Annual anthropogenic emmissions increased by an average of 3.28% per annum from 2000-2007, but at half that rate thereafter (1.62% per annum). The increases for 2012, 2013, and 2014 (the last year for which data is available) were 0.76%, 1.70% and 0.78% respectively. In absolute terms, that makes 2012 and 2014 the smallest annual emmissions in the 21st century excluding 2008 and 2009.
There is reason to hope, given this data, that the world is on the verge of stopping the annual increase in fossil fuel emissions. That hope is, of course, severely challenged by the advent of the Trump administration. We cannot, however, conclude from the annual mean growth of CO2 that the world has resumed its former, precipitate growth the use of fossil fuels. Nor can we conclude from that possible stabilization of CO2 emissions that we are effectively tackling climate change, for which CO2 emissions have to reduce rapidly.
-
Tom Curtis at 03:00 AM on 14 March 20172017 SkS Weekly Climate Change & Global Warming Digest #10
HydrogenOne @2 is plainly sloganeering, so I do not expect it to survive the moderators attentions (see the comments policy). I will restrict my comment to note that typically when "... we have seen en elevation in temperature, CO2 levels, Volcanic activity, and a decrease in Solar Activity" an ice age has not followed. Typically those conditions have resulted in soaring global temperatures because the changes in solar activity over time are very small relative to the change in forcing that has followed on changes in CO2 levels.
HydrogenOne merely demonstrates again (as if we needed another demonstration) that it is very easy to convince yourself of what you wanted to believe in the first place if you allow yourself the luxury of fake facts.
-
HydrogenOne at 02:46 AM on 14 March 20172017 SkS Weekly Climate Change & Global Warming Digest #10
What has happened in the past everytime we have seen en elevation in temperature, CO2 levels, Volcanic activity, and a decrease in Solar Activity? An Ice age. Every single time in history this has happened an Ice age as always followed. So we are in fact headed for another Ice Age. Global Warming is a joke.
Moderator Response:[RH] Sloganeering. Please read the SkS commenting policies before continuing to contribute.
-
HydrogenOne at 02:39 AM on 14 March 2017We're heading into an ice age
As you can see the data provided by SS proves that this is not the first time temperatures have reached this point. Just like the upcoming ICE age will not be the first time Tempertures dropped significantly after a decrease in solar activity and increase in volcanic activity. Yes we are in deed headed for another Ice age.
Moderator Response:[JH] Sloganeering snipped.
-
michael sweet at 21:32 PM on 13 March 2017Models are unreliable
SemiChemE,
You should read more about satalite temperature records. Carl Mears, head scientist at RSS says the surface record is more reliable. The model to convert measurements into temperature is very complicated and major errors are found all the time. The final result is the temperature several miles up into the air. How useful is that?
By contrast, the surface results have been consistent for decades. BEST used a new method of analysis and added a great deal of data and got an identical result. The surface station project eliminated a great deal of data and the result was identical. Both BEST and the surface station were run by deniers.
You should look more at paleo results. Compared to satalite records they are great. They give insight into very long data series.
-
Tom Curtis at 17:32 PM on 13 March 2017Models are unreliable
I should note that while some estimates from Heydt et al are in the low end of the AR5 range, all are higher than those cherry picked by Judith Curry.
-
Tom Curtis at 17:20 PM on 13 March 2017Models are unreliable
SemiChemE @1004, neither Judith Curry, the Global Warming Policy Foundation nor Nic Lewis have a sterling reputation when it comes to climate science. All have shown a strong prediliction to cherry pick results in favour of low sensitivity/low impact projections. That is evidenced again in the report for which you provide the URL.
More specifically, in Table 1 Curry reports the climate sensitivity estimates of the IPCC AR4, the IPCC AR5, and the CMIP5 model ensemble, along with just two recent estimates. Nic Lewis is an author of both of those estimates, with Judith Curry being his coauthor in the first, and higher estimate. The two climate sensitivity (best) estimates are, respectively, 1.64 oC and 1.54 oC per doubling of CO2. Both estimates are by the energy balance method. I should note that by "best estimate", Curry means the modal value. Given the use of estimates of ECS in estimating likely damages from global warming, it is more appropriate to report the mean value. Given the assymetry in the uncertainty ranges, the mean value is likely to be higher than the modal value.
For comparison, using the same method but less controversial assumptions, Otto et al (2013) found a most likely (ie, modal) estimate of 1.9 oC with a 5-95% confidence range of 0.9-5.0 oC. That is warmer than the effective IPCC estimate of the modal value as determined by Rogelj et al (2014) (See supplementary data, tables 1 & 2, case f).
Further, when we look outside the strict confines of energy balance based estimiates of ECS, the range of values becomes much larger. Bodman and Jones (2016) report estimates of mean values for the ECS of 2.0, 3.2, 1.8, and 2.6 oC per doubling of CO2 for a range of studies, the oldest of which was published in 2012. An even greater range is obtained if we consider studies of paleo data, as shown in Figure 1 of Heydt et al (2016):

(To read the graph, the x axis shows the approximate GMST relative to 20th century values, while the y axis shows the climate sensitivity parameter. To obtain the ECS for 2xCO2, multiply that value by 3.7 W/m^2. As can be seen a range of values are obtained, most commensurate with the IPCC AR5 and CMIP 5 estimates, though with some lower and some much higher.
Lewis likes to argue that energy balance estimates are incontrovertibly superior to other estimates, but there are good reasons to doubt that. Indeed, there are good reasons to think that such estimates are biased low. Nic Lewis' results are further biased low on top of that by his controversial assumptions all of which tend towards a lower estimate of ECS.
To summarize, Judith Curry's GWPF report is typical of their productions in being based on extreme cherry picking of data to drive an ideological point. It is not a fair summary of the science, and therefore need not be considered in a science based blog.
-
SemiChemE at 15:00 PM on 13 March 2017Models are unreliable
I'm new here, but here's a quick intro, I'm a chemical engineer with approximately 20 years experience in the semiconductor industry. A significant portion of that time involved computational fluid dynamics (CFD) modeling of reacting flows. Thus, I'm quite familiar with the capabilities and limitations of CFD models. All GCMs are at heart, large-scale CFD models.
@1003 - The video gives a nice overview of the climate models for the layman, but I can't help but think the scientists are downplaying many of the model limitations.
Yes, for most of the phenomena of interest the basic physics are pretty well understood, but to model them on a planetary scale, gross simplifying assumptions must be made due to computational limitations. The skill of the model is intimately tied to the accuracy of these assumptions and that is where the model can easily go astray.
Dr. Judith Curry gives a pretty good summary for the layman of some of the most salient model limitations in an article linked here:
https://wattsupwiththat.com/2017/02/21/curry-computer-predictions-of-climate-alarm-are-flawed/
The bottom line is that while some of the approximations are extremely accurate, by necessity the models for some processes are quite crude. This latter set, varies from model to model depending on the specific model purpose and is one reason for the spread in reported model results. It is these crude approximations that ultimately must be tuned to fit the available data, but with such tuning comes the ever present risk of getting the right answer for the wrong reason, in which case there is no guarantee that the model will be useful for future predictions.
If we had several earths to experiment on, we could run multiple experiments with different forcing conditions and sort out the various contributions of different effects, but since we have only one earth, we don't have any way to completely distinguish the impact of the various forcings (eg. CO2 levels, solar radiation, cloud formation, SO2 and aerosols, Natural variability, etc...) from each other. This means we have to make educated guesses about the various sensitivities. Over time, these guesses will get better, as we get more data to compare them to and we better understand the various sources of natural variaton (eg El Nino/La Nina).
However, at the moment, we really only have about 40 years of reliable, high-density data (the satellite era) and we're trying to decouple the impact of increasing CO2 from a natural variability signal that also seems to have a 30-60 year period. Dr. Curry contends that the due to such factors, the IPCC has over-estimated the sensitivity of the climate to CO2, possibly by as much as a factor of two.
If true, this means that climate change will happen much more slowly and to a lesser degree than originally predicted.
Prev 401 402 403 404 405 406 407 408 409 410 411 412 413 414 415 416 Next


