


 Arguments


Recent Comments
Prev 402 403 404 405 406 407 408 409 410 411 412 413 414 415 416 417 Next
Comments 20451 to 20500:
-
nigelj at 06:56 AM on 7 July 2017Why the Republican Party's climate policy obstruction is indefensible
NorrisM @12
Thank's for clarifying your views on Trump and Pence. I was probably a little unfair to have suggested you were being disingenuous. It was just impatience on my part.
Just briefly on the issue, because I'm more interested in the red, blue team issue. I have the same reaction, Trump is scary, and Pence is too ultra conservative for me and particularly regarding religion. I could much more easily accept someone like Reagon.
I'm also not impressed with politicians who just make things up, and while they are literally all guilty of this, and none of us are perfect, Trump is in a class of his own.
When people cannot even agree on basic facts, theres nothing left but fighting and tension, or even all out civil war.
However I would prefer Pence by a small margin. I have real concerns that Trump could start an unnecessary war, and this is the greater concern for me living in NZ, as such things have global implications outside America, either militarily or econiomically, so Pence seems preferable from my own admittedly self interested perspective. But surely none of us want a war? Especially another war that literally doesn't make sense.
I have mixed feelings about Trump surviving the first term. It would be hard to impeach him, although moves have already started in earnest. The Russia thing is a mystery, and I would not like to guess an outcome. Perhaps Trump is teflon coated like certain other presidents, and it's common with shrewd politicians, but he is so mired in so many scandals that there's quite a high probability he might not survive the first term.
I doubt he will be re-elected unless his attitudes change. Republicans have no love for him. However much may depend on the economy, as this determines politicians fates more than anything.
I'm still very sceptical about your red blue team. I suppose if it produces more funding that would be nice. JW Rebel has raised some good points.
I would do as you yourself say in general, and "step back and look at the issues from the outside". The scientific community are unlikely to take the red blue team seriously as its just a smaller version of the IPCC, and set up by people with a very strong hatred of climate science, so hardlly objective people. The rest of the world will see it as a jacked up joke of a process, that may be biased and untrustworthy. The Australians would call it a sort of Kangaroo Court. So whatever the result, it is likely to have poor credibility. And who would be on the panel? It will be hard to find exemplary people, and if its staffed with numerous sceptics it will be considered a joke by the rest of the world.
I think Tom Curtis made a key point about sceptics. Yes, I would accept climate scientists like Michael Mann are not perfect. The last IPCC report had a mistake about Himilayan Glaciers, (one mistake in a document over a thousaand pages long, and not actually remotely crucial to basic climate theory). This stuff gets enormous publicity, but rarely does the so called "media" do a review of the numerous mistakes made by "sceptics" and believe me they are numerous.
So yes what might ultimately count most is the substance of someones ideas, we should never forget that, but one side in this debate has far more general credibility, and its not the sceptics. But the mass media are corporate owned, and have done a cynical and I believe deliberate job protecting the sceptics from any real scrutiny.
Sceptics are always sure they are right about everything and never admit uncertainty, ever. Have you noticed this? They do come across like lawyers. In comparison the IPCC meticulously documents varying levels of certainty across varying things.
Ultimately the sceptical campaign is a huge delaying tactic.
-
Pol Knops at 06:48 AM on 7 July 20172017 SkS Weekly Climate Change & Global Warming News Roundup #26
About Olivine.
Indeed there is NO silver bullet. So we need to reduce CO2 emissions, but also remove CO2 from the atmosphere.
-1- So solely counteracting all of the global CO2 emissions with solely olivine is not a good idea.
-2- There is more and more research available. See i.e. this open access article from Francesc Montserrat (and myself ;-) )
http://pubs.acs.org/doi/abs/10.1021/acs.est.6b05942Best regards,
Pol Knops
-
too at 06:34 AM on 7 July 2017Why the Republican Party's climate policy obstruction is indefensible
This seems to be an updated 2016 paper,
https://thsresearch.files.wordpress.com/2016/09/wwww-ths-rr-091716.pdf
Also, this seems to largely be related to these two topics:
https://www.skepticalscience.com/Satellite-record-vs-thermometers.htm
https://www.skepticalscience.com/surface-temperature-measurements.htm
-
supak at 05:11 AM on 7 July 2017Why the Republican Party's climate policy obstruction is indefensible
Anybody seen this paper I hear the deniers crowing about today?
https://thsresearch.files.wordpress.com/2017/05/ef-gast-data-research-report-062717.pdf
Wallace, Aleo, and Idso.
They're saying it's peer reviewed, yada yada. If anyone could point me to a debunking of this, I'd appreciate it.
-
JWRebel at 04:28 AM on 7 July 2017Why the Republican Party's climate policy obstruction is indefensible
1. The only honest climate "sceptics" are those who are rather unfamiliar with the material: people who out of some sort of misguided ideological loyalty to their group or tribe think that it is another left-wing progressive government ploy, out to destroy traditional values, work, and families. The rest are being disingenuous at best. Those who are taking a group position may be open to changing their minds under the right circumstances, probably not by learning about IR-bands and CO² molecules, but by appeals to their loyalty and conservatism which mandate not running down the farm before handing it over to their children.
The others are not well-intentioned or well-meaning people.2. Just because 97% of [climate] scientists have stated that anthropogenic climate change is real does not mean that the other 3% have good theories and other data sets showing the opposite. Far from it. That would mean there are a lot of bona fide scientists with reasonable alternate theories whose research and credentials are impeccable. That is not true: finding sceptics that you can parade around as "real" scientists is like searching for a needle in a hay stack. That is why you keep meeting the same very small handful of star-status sceptics, none of whom are close to producing some synthesis of theoretical grounds on why the data has not been interpreted correctly and can be better explained by their alternative.
3. Staffing a red team (Richard Muller is no longer a candidate) with qualified specialists is therefore pretty much mission impossible. It's like equipping moderate "rebels". After ½ a $billion there were 5 rebels, who immediately passed their equipment on to the other side to which they defected at the first encounter. Educating new candidates for your red team would be like cupping some sea water and crossing the entire beach — they would be convinced by the material as soon as they started understanding the efforts and results undertaken so far.
4. If there were qualified scientists with convincing alternate explanations of the facts, they could make a killing$. Such a person would be herded into every studio and corporate office around.
5. The whole sceptical delusion is a disorder that only seems to occur in a select group of Anglo-Saxon countries, much like an infection, mainly due to patterns of media ownership and corporate funded think tanks and lobbyists.
>> Only rhetorical and political considerations remain. It is time for investments in energy alternative and research in the same order of magnitude as military spending: this is one war we cannot afford to lose. People on the wrong side of this issue have to be outed as dummies, fakes, mercenaries, nincompoops, malevolent charlatans, hired ideologues, whores. None of the talking points are remotely plausible for anybody who takes the time to look into the actual science and responses by scientists. People who raise the "talking points" need to be pointed in the right direction once or twice, but any sign of perseverance means it is willful stupidity.
Against the foolhardy even the gods contend in vain. -
ubrew12 at 02:33 AM on 7 July 2017Why the Republican Party's climate policy obstruction is indefensible
NorrisM@6 said: "ClimateGate had a very damaging effect... It is very similar to evidence given by a witness testifying in some legal case... For any jury, ALL of the evidence of that witness is tainted."
I'm constantly amazed how often climate deniers use the Law as an example to Science. Who has a more questionable reputation, lawyers or scientists? Next time I see a scientist chasing an ambulance I'll revise my opinion. For example, deniers keep harping on the exact timing of the demise of the Arctic summer sea ice. It is apparently really, really important to them that the scientists accurately predict the exact year when Arctic summer sea ice disappears. Who, other than a lawyer, performs this kind of misdirection? Hey, prosecutor, 80% of the sea ice is already gone! Past tense. In the last 30 years. Outside a courtroom, is there any question where the remaining 20% is headed?
Those of us fighting what is going on need to be aware that we are fighting rooms full of lawyers, and their speciality is misdirection. A favorite is 'moving the goalposts': like suddenly its no longer sufficient to point out that 80% of Arctic summer sea ice is gone, scientists must now predict exactly when the remaining 20% will be gone or their reputations will be ruined, their testimony tainted, and climate denial justified for the rest of eternity.
The appeal to jurisprudence is how NorrisM can point to the 'hiatus' and render judgement, "The models did not predict this and therefore are unreliable." But barrister, outside the kind of courtroom that found OJ Simpson guiltless of murder, any model of reality fundamentally cannot beat reality. It's not possible. It can only beat other models. It's not the fault of scientists if the Heartland Institute won't produce any. What you really should be asking yourself, NorrisM, is: 'Why won't they?'. That would at least lead you to a constructive outcome.
-
NorrisM at 02:01 AM on 7 July 2017Why the Republican Party's climate policy obstruction is indefensible
nijelj and Tom Curtis. Thanks, some very interesting replies.
As a non-scientist (and Canadian) I am just trying to get a handle on a very important issue looking on from the outside given that the main battleground is in the US. Please be assured that I think that the election of Trump is one of the scariest things to happen in my life. My concern is that everything that I have read and listened to (Sam Harris podcasts especially) tells me that we have Trump for a long time unless evidence is uncovered showing that Trump personally colluded with the Russians. But all that means is that we end up with Pence as President. Given my views on religion, this is just as scary a prospect.
So my point is that a "new" red team blue team is about the only thing that I think the Republicans will undertake. If this ultimately gets more money for observational equipment, then that would be a positive.
-
rocketeer at 01:23 AM on 7 July 2017Bad news for climate contrarians – 'the best data we have' just got hotter
Funny how the 'climate science deniers' (I like this term because it clarifies exactly what they are denying) get so upset about the tiny corrections made to the surface data (i.e. Karl 2015) but think the satellite data is incontrovertible, despite the major revisions made every few years.
-
Eclectic at 22:58 PM on 6 July 2017Why the Republican Party's climate policy obstruction is indefensible
NorrisM @6 ,
regarding the APS (American Physical Society) workshop/review of global warming [carried out in January 2014] and its 500+ page transcript (fortunately each page is brief!!!) :-
I have read through the transcript, with particular attention to the sections which you highlighted (in another thread) as showing dubious science and/or dubious answers/fudging ..... and I must say I found nothing substantive there which could be taken as overthrowing the mainstream science. Nothing at all. So I must beg you to be specific in nominating and clarifying any points which you feel strongly could support the denialist position (other than points of sheer empty rhetoric — of which there were many!!!!).
And in support of my statement above : it comes as no surprise that the senior officials/scientists/physicists of the APS found nothing substantive enough to justify them altering the APS Statement on AGW and climate science.
Furthermore, you will have noted that the review panel workshop date was January 2014 : just before the 3 record hot years 2014 / 2015 / 2016 (plus year-to-date in 2017) gave added demonstration of how empty and unreal were the claims that Global Warming had stopped. On top of that, the accompanying tropospheric warming now shows Christy's own claims to be wrong. And also reinforcing that Lindzen is very, very wrong.
Tom Curtis and Nigelj have indicated the false reasoning i.e. "motivated reasoning" used by many science-deniers such as Koonin Lindzen Christy and Curry. It must be highly likely that Curry's claim that "Climategate" suddenly converted her away from mainstream science ..... is a factitious claim made in retrospect : a demonstration of "motivated reasoning" on her part. After all, numerous independent reviews have shown that the "Climategate" allegations were a beat-up over nothing substantive. And what real scientist would alter her views, citing evidence known to be false?!
That is why the Republican politicians' professed desire for "Red Team" reassessment, is pure poppycock. All they wish to do is achieve further years of delaying tactics, and at the same time give the public the impression that the genuine climate scientists are sufficiently moved by doubt of their own position (as to agree that review is necessary).
-
HK at 22:11 PM on 6 July 2017Bad news for climate contrarians – 'the best data we have' just got hotter
Here is a direct comparison of the new RSS TLT record and the RATPAC-A record based on weather balloons with real thermometers. The latter is an average of the four altitude levels 1.5, 3, 5.6 and 7.2 km. The two records use different base periods, but that doesn’t change the fact that their trends are very similar after the RSS update.

-
nigelj at 18:44 PM on 6 July 2017Why the Republican Party's climate policy obstruction is indefensible
Norris M @6
Interesting comments, but I largely disagree.
"Rightly or wrongly, I think that ClimateGate had a very damaging effect on the climate change views of conservatives everywhere. "
Well it probably didn't help their views. I can appreciate that much.
People do get tainted by one so called mistake (alleged in the cause of climategate), but that is very shallow to dismiss people on that basis.
It's also very much "wrongly" that climate gate tainted anyones views. I'm a political moderate, with a reasonably decent arts, technical and some science education. It only took me five minutes reading the actual evidence of climate gate and both sides of debate and commentary, to see there was literally nothing there, nothing wrong. Numerous investigations have also concluded the same.
People concluding otherwise, must want to conclude otherwise, and are being irrational. I do however agree it was an unfortuante thing and rather bad luck, but to claim it means the damage is irreversible is absurd, innacurate and lazy thinking.
"Judith Curry has herself admitted that this made her seriously question her position which was until then "mainstream"
Her views are in a small minority of climate scientists, and she does not have a spectacular research record or any great clarity on anything, in fact she is rather vague about things. So please explain why you give her views prominence.
"The hiatus"
So much rubbish is talked about this. Firstly the latest information shows the pause was more of a short blip, and entirely within expectations. Last years temperatures changed everything.
It's at least partly inaccurate to claim models didn't predict the pause. All models without exception expect flat periods, but its impossible to predict them exacly because short term natural variation is slightly random. Models have been reasonably reliable predicting temperatures, as evidenced by articles on this website.
Things are still slightly under predictions, but only slightly and this is not enough to be concerned about. Republicans dont appear to want to hear that, instead they seem to hear, things are not 100% as predicted to within millimetres, so everything must be wrong. With respect this is childish, self interested, and intellectually empty thinking, and they are smarter than that.
"For now let us not get into arguments about this because you will NOT convince the Republicans by one "new study" that shows that the IPCC was mistaken. "
So you are saying don't even try because people are so stubborn with minds closed? Humanity might as well give up. Just imagine your outrage if Hilary Clinton said something like that. Nobody needs to be that closed minded.
Remember the only evidence that really counts is the science, and weight of scientific evidence, and it all points one way. Not politics, or character of climate scientists, or scandals, or occasional mistakes, or the like. One mistake on a minor point does not make an entire theory wrong, or key conclusions wrong. Climate change theory is built on wide evidence, not one piece of evidence.
"So "97% of climate scientists" does not cut it with Republicans. They simply do not trust the climate scientists believing, rightly or wrongly, that their bread and butter is really based upon making sure that climate change is primarily man-made."
Well that is just foolish thinking. Scientists are not exaggerating to manufacture work. Scientists get work in all sorts of fields because its needed, without glamourising everything.
We could turn around and say we dont trust politicians because their bread and butter depends on xyz, or business people or anyone. The world cannot and doesn't work like that or it would come to a complete stop . You have to have fundamental trust in professionals, unless they personally start to consistently act otherwise. Now look at the many, many false claims by Donald Trump, and there you have someone of dubious integrity.
Basically people just do their jobs, and scientists are no different. They very critical of each other if they can find fault, because its in their interests.
"Can anyone really be a scientist and say that 100% of climate change is man-made? "
Obviously yes, if thats what the science finds, and it does or very close to it. It's like certain diseases have very precise causes.
"Climate change has been on-going for the life of the planet and the man-made CO2 emissions simply cannot be 100% unless you have strong evidence that we are in a natural "cooling period". "
There is overwhelming evidence that we are in a natural cooling period. The solar energy output of the sun has been in a decades long cooling phase. Review "Is it the sun" on this website. This is a key reason for scientists beings concerned, quite apart from the evidence and calculations that point at CO2.
"It is not possible that the climate naturally is not going either up or down. "
No because the science doesn't find this. There are over 12,000 research papers on climate change, and many look at this aspect. How many would be enough for you?
"When you say "100%" you sound like an extremist. Most people, and especially conservatives, do not like extremists. Not a smart thing to say."
Maybe so, but when they said 90% that was too extreme as well. Seriously do we have science here, or "pc" correctness on an acceptable level? What is an "acceptable level" and why?
"But back to the Republican position. When they see there are real-life climate scientists like Judith Curry (who I have to admit sounds much more balanced than Michael Mann in testimony before the various Congress committees and who is not subject to any "ad hominem" attacks that seem to be levelled at Christy and Lindzen),"
With respect, you are being one eyed. There's fault on both sides. Michael Mann gets abuse each week for example. Forget the short tempers, and look at the scientific research.
"then the "red team blue team" approach with other scientists (primarily physicists I hope) may be the best answer to the Republicans"
It's a staged, dubious sort of enquiry that can achieve nothing new. It's too small. The IPCC is much, larger and they include sceptics as well as so called warmists, and rotate new scientists on each review panel. You have a very good process, but most people haven't read what really happens overall, only biased little snippets of information taken out of context.
The rest of the world has moved on while the Republicans alone seem stuck. You are just engaging in delaying tactics yet again, and we are sick of it for over a decade now. The rest of the world has seen through the ruse, and moved on to accept the obvious reality of human caused warming.
"Once we get past what Dessler calls "positive statements" (in his very good book on climate change)"
It's a very dubious book, and it's not about books and opinions, it's about the weight of published evidence in proper journals.
"I just think the climate science community has to do a reality check. Trump won and he in all likelihood is here for at least for the remainder of his first term and possibly 8 years (would Pence be any better?). "Anyone who does not accept this is really like the ostrich in the sand pictured on the home page of this website."
That's a real laugh given Trumps approval ratings are so low. I doubt he will even survive this term, and chances of re-election look slim. I'm sorry he is probably a good family man, but imho he is a confidence trickster, and does not have solidly founded policies and beliefs.
"I personally am very unhappy with this situation but the American people have spoken!'
Yeah sure. All your previous comments suggest otherwise.
"Churchill has noted, democracy is close to unworkable but compared to the alternatives, it is the best. "
Well I would agree on that, but not with much else.
-
Tom Curtis at 18:32 PM on 6 July 2017Why the Republican Party's climate policy obstruction is indefensible
NorrisM @6, while I agree that "climategate" was damaging, your analysis does not give the reason.
In the first instance, while the climate scientists may have used a poor choise of words in several (among many thousands of) emails, multiple independant investigations showed they had done nothing wrong as regards science (one was guilty of trying to avoid Freedom of Information requirements). This is even demonstrable on the public record, with the most damaging accusations being that the scientists "hid the decline" whereas they had discussed the decline in late twentieth century tree ring widths (ie, the decline in question) in multiple publicly available scientific papers. Several more damaging accussations were complete fictions; ie, the people making the accussation were involved in fraudulent behaviour in making and presenting "evidence" for the accussation.
Secondly, even if the scientists in question had been guilty of scientific misconduct, they represented a handful of scientists among literally thousands of climate scientists. In almost all industries, cases of misconduct will rise well above the approx 1% level that would imply. The people rushing to condemn climate science do not typically condemn those industries of dishonesty on that greater basis, so it is not true that they are condemning climate science on that much smaller sample.
Thirdly, the climate "skeptics" in general, and nearly all of them in particular, have been guilty of demonstrable dishonesty or sharp practise on a regular basis. So much so that it is difficult to find a single "skeptical" paper in recent times that does not involve blatant misrepresentation of either what others have claimed, basic science, or observed facts. This far more wide spread dishonesty has not resulted in a general distrust of climate "skeptics", or their positions. Therefore they have not rejected climate science because of the purported dishonesty of climate scientists.
The second two points rely on a fundamental of causation, ie, that like causes have like responses. This is a factor in reasoning. If we do not trust x because of circumstances, y, then we will also not trust x' if an exactly similar set of circumstances, y' applies. The exception is with motivated reasoning. That is, when we do not trust x because we do not like the message they give, but we asribe the mistrust to circumstances y to give a cloak of rationality to our mistrust. If we then come across x' who gives a message we do like, even though exactly similar circumstances, y' apply, we will trust them because the actual reason for our distrust was the dislike of the message.
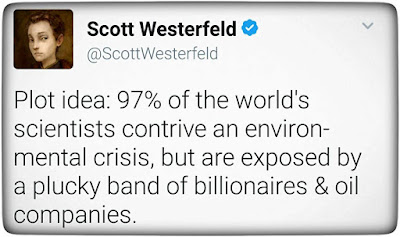
To be honest, most conservatives are probably not that direct. They may reject climate science simply because Pravda on the Hudson (ie, Fox News) does so, which they in turn trust because of motivated reasoning; while Fox News gives great, and very distorted prominence to "climategate" while concealing the many distortions of their regular contributors on climate.
The same motivated reasoning applies to rejection of consensus messaging, as it implicitly means accepting Scott Westerfield's far more implausible "plot idea":
-
nigelj at 17:28 PM on 6 July 2017Why the Republican Party's climate policy obstruction is indefensible
Noam Chomsky talks plenty of sense. His book "Who Rules the World" is a recent introduction to the full range of his views, and chapter 11 the doomsday clock covers climate change and nuclear issues. He also discusses neoliberalism.
This guy has some "new deal" leaning economic views which I partly agree with, but some dont like. I suggest put economic ideological bias aside. His main points are more related to political values and foreign policy, where he is just asking that America be consistent, that they apply to themselves and their own government the rather high standards they demand of everyone else.
-
NorrisM at 16:31 PM on 6 July 2017Why the Republican Party's climate policy obstruction is indefensible
Rightly or wrongly, I think that ClimateGate had a very damaging effect on the climate change views of conservatives everywhere. It is very similar to evidence given by a witness testifying in some legal case who is completely honest in his testimony until the last question, where, in his desire to "win the case" for whatever side, he "fudges" his last answer. The cross-examining lawyer then leads another witness who proves on that very point that the witness was not telling the truth. For any jury, ALL of the evidence of that witness is tainted. I truly think this happened with this issue. Judith Curry has herself admitted that this made her seriously question her position which was until then "mainstream". It is just about irrelevant now as to what was or was not the intention of those emails. The damage has been done. End of story.
When you add this to the issue of the "hiatus" of X number of years whether or not it was really there (the IPCC at least in 2013 coined that term) has added to the legitimate questions of conservatives that are we being led down a garden path. The models did not predict this and therefore are unreliable. That is not an unreasonable position to take IF the hiatus really occurred. For now let us not get into arguments about this because you will NOT convince the Republicans by one "new study" that shows that the IPCC was mistaken.
Then you add on John Christy's famous graph which so impressed Steve Koonin between the predictions of the models and the actual observations (see APS panel hearing below). Do you not think that those pressing the Republicans not to do anything on the climate change file have not read the transcript of the APS panel hearing where three (3) of the top IPCC contributing climate scientists, Collins, Hand and Santer, admitted that the model predictions do not track the observations? Their answer was that they do not trust the observations. Can you not see how this would make conservatives suspicious?
So "97% of climate scientists" does not cut it with Republicans. They simply do not trust the climate scientists believing, rightly or wrongly, that their bread and butter is really based upon making sure that climate change is primarily man-made. Can anyone really be a scientist and say that 100% of climate change is man-made? On that point I fully agree with Perry. Climate change has been on-going for the life of the planet and the man-made CO2 emissions simply cannot be 100% unless you have strong evidence that we are in a natural "cooling period". It is not possible that the climate naturally is not going either up or down. When you say "100%" you sound like an extremist. Most people, and especially conservatives, do not like extremists. Not a smart thing to say.
But back to the Republican position. When they see there are real-life climate scientists like Judith Curry (who I have to admit sounds much more balanced than Michael Mann in testimony before the various Congress committees and who is not subject to any "ad hominem" attacks that seem to be levelled at Christy and Lindzen), then the "red team blue team" approach with other scientists (primarily physicists I hope) may be the best answer to the Republicans. Give it a go and see what happens. If the Koch Bros result happens again, then you will have a very legitimate and strong position to force the Republicans to act. If their own "red team blue team" comes to the conclusion that CO2 emissions are really the cause then we are at least then only into the question of how much warming and decisions as to how best to approach this. So I say, fully support the "red team blue team" even if it has been done before.
Once we get past what Dessler calls "positive statements" (in his very good book on climate change) which are the facts, then we can get into "normative statements" on what we think the results are in economic terms and what we should do about it, both as to mitigation and adaptation.
I do suspect that such a "red team blue team" debate will get bogged down on the facts and largely because we do not have the proper instruments to measure what is happening year to year. If the result is that the Republicans do at least decide to dedicate much more money to funding both weather/climate satellites and water buoys and on-land temperature measurements then it will be a "win" for the majority of climate scientists who believe that we are the cause.
What I found most unsatisfying about the APS panel struck in 2014 to re-evaluate their statement on Climate Change is that after having somewhat of an "appellate hearing" there were no "reasons for judgment", just a decision by the Board of Directors of the APS one year later to effectively stick with their previous statement. I have no problem with them sticking with their same statement but by providing their reasons they could have provided massive "independent evidence" outside the climate science community that man made warming is a major threat to our world. On another post, I have made reference to the APS panel. You can read the APS Workshop Framework Questions and transcript of the proceeding with 6 of the top climatologists on both sides of this debate on the APS.org website just searching "Climate Change Policy Review".
I just think the climate science community has to do a reality check. Trump won and he in all likelihood is here for at least for the remainder of his first term and possibly 8 years (would Pence be any better?). Anyone who does not accept this is really like the ostrich in the sand pictured on the home page of this website.
I personally am very unhappy with this situation but the American people have spoken! Get used to it! As Winston Churchill has noted, democracy is close to unworkable but compared to the alternatives, it is the best. Comey must stay awake at nights realizing how he might have turned the course of history.
Moderator Response:[DB] "ClimateGate"
Please better familiarize yourself with the content here. For example, your meme has been debunked, in that 9 separate investigations have completely exonerated all scientists of all charges.
"The manufactured controversy over emails stolen from the University of East Anglia's Climatic Research Unit has generated a lot more heat than light. The email content being quoted does not indicate that climate data and research have been compromised. Most importantly, nothing in the content of these stolen emails has any impact on our overall understanding that human activities are driving dangerous levels of global warming. Media reports and contrarian claims that they do are inaccurate."
SOURCE
The Skeptical Science post on the topic
Further, the court has ruled that academic emails can be withheld:"emails are proprietary records dealing with scholarly research and therefore exempt from disclosure"
SOURCE
And the original fake news articles have all been retracted by the organizations that published them. -
Ger at 14:50 PM on 6 July 2017Planet Hacks: Flying
Fly by night? At least half the of the heat is radiated into dark-cold space. Assuming that the flight is above the clouds.
-
One Planet Only Forever at 14:46 PM on 6 July 2017Why the Republican Party's climate policy obstruction is indefensible
I am soooo embarassed. I had meant to spell Chomsky correctly but I put the link in first and finished typing my thought then hit submit before the thought to confirm the spelling resurfaced.
-
One Planet Only Forever at 14:34 PM on 6 July 2017Why the Republican Party's climate policy obstruction is indefensible
The New York Times has published an email based interview of Noam Chomski. The interview presents an interesting perspective on Team Trump and who the supporting trouble-makers really are (spoiler alert - it is not Russian Hackers attempting to rig the election).
An interesting point made is that Climate Change and Nuclear War are Noam's top identified concerns (and it is hard to argue against that) with the current USA leadership and its supporters being the major concern related to those two concerns (also hard to argue against).
-
One Planet Only Forever at 13:49 PM on 6 July 2017Why the Republican Party's climate policy obstruction is indefensible
A minor phrasing corrrection to my earlier comment:
"What I have presented above regarding Rick Perry applies when deserving/responsible Leaders are acting in Businesses and Governments."
-
One Planet Only Forever at 13:27 PM on 6 July 2017Why the Republican Party's climate policy obstruction is indefensible
It is deplorable when someone who does not have the capability to understand complicated important matters gets promoted to the level of their clear incompetence (the Peter Principle). It is more deplorable when that person's boss is as incompetent at being the Boss of that role.
Rick Perry first claimed he was a skeptic then proved that he was not a skeptic. When faced with something that doesn't sound reasonable a skeptic would say they will have to investigate the matter to better understand it and promise to return with an honest response after achieving a better understanding. Rick Perry did not do that regarding the best explanation of what has been going on as presented by the Lead Scientist on the BEST Team.
So Rick Perry showed that he was incapable of investigating, or unwilling to investigate, a matter to be sure he understood it. That makes him undeniably incapable of properly performing the responsibilities of his appointed leadership role. He should be removed from the role and b required to take training and pass tests to prove he has developed the required capabilities before getting a similar role. If he tries to excuse his statement and claim he actually did know better then he is worse than incompetent and should be penalised in addition to being removed from his role.
What I have presented above regarding Rick Perry applies in properly Lead Businesses and Governments.
The fact that Trump has not removed Rick Perry from the role he has proven his lack of ability to properly perform should be adequate proof that The Boss is also not capable of properly performing the duties of the President.
-
Digby Scorgie at 11:57 AM on 6 July 2017Planet Hacks: Flying
The horrible background music drives me nuts.
-
One Planet Only Forever at 09:48 AM on 6 July 2017Bad news for climate contrarians – 'the best data we have' just got hotter
Jeff T@7,
Initially I wasn't certain about what you were referring to, so I checked the graphs.
It appears you are commenting on the trend line shown on the "Major revisions upward after 1998" graph. That graph compares the trends of the data since 1998 for the correction of interpretation of the satellite data.
The trend of the entire RSSv4 TLT data set is shown in the lower graph labelled "Satellite temps warming faster than surface". The trend line of the entire data set is less than 0.2 in 1998 and nearly 0.5 at the end (2016/17). The trend line in the earlier graph that starts in 1998 is above 0.2 in 1998 and clearly below 0.5 at the end.
So the trend of the overall data set is actually a more rapid rate of increase than the rate from 1998 to today.
And I agree, deniers would attempt to claim something similar to what you thought you had discovered and hope that people will 'like what they hear and not bother to check if what they want to believe is actually valid'.
-
HK at 08:48 AM on 6 July 2017Bad news for climate contrarians – 'the best data we have' just got hotter
DrivingBy @5 and Nigelj @6:
The satellites providing the data used by RSS and UAH are not 20,000+ miles above the Earth, but only about 800 km (~ 500 miles), roughly twice as high as the International Space Station and orbit the Earth every 100 minutes or so.
Maybe you were thinking of the geostationary orbit (35,800 km / ~ 22,000 miles) used by the communication satellites? If these satellites really were that high up, they wouldn’t suffer from the tiny atmospheric drag that still exists a few hundred kilometres above the Earth and causes the orbits to change over time.I think the RSS TLT record is reasonably accurate now, not only because it agrees pretty well with NASAs surface record (the second graph) but also with lower troposphere measurements by weather balloons with real thermometers in direct contact with the atmosphere.

-
Jeff T at 08:08 AM on 6 July 2017Bad news for climate contrarians – 'the best data we have' just got hotter
John, thanks for the explanation of the RSS changes and your many other efforts to encourage action on climate change. One complaint though: the graph that compares old and new RSS data shows trends since 1998. The trend lines were clearly computed by ignoring data prior to 1998. Consequently, there is an implicit discontinuity of temperature in 1998 that makes the trend steeper than it ought to be. Skeptical Science has correctly faulted people like Christpher Monckton for similar calculations. Please make it clear in the text that you don't consider it proper to ignore some of the data.
-
nigelj at 07:43 AM on 6 July 2017Why the Republican Party's climate policy obstruction is indefensible
Republican politicians tend to have been in business or have ties to the business sector. They have been responsible for large corporations, or managing other peoples money, or are contracted to produce results and profits, and maybe they see climate science as threatening to that and their friends in the business sector.
But thats not really an excuse to deny basic science, or irresponsibly damage the environment, or promote dubious modes of business behaviour. Clearly plenty of executives have acted unethically at times, for example the GFC exposed this. Politicians deregulated the business sector, and created an environment conducive to unethical behaviour. We the public should not have to put up with any of this.
Making a profit is not a reason to cut corners. The rest of us have to do our jobs correctly and within ethical guidlines, and various rules, so the same should apply to everyone. Nobody is above the law, or simple ethics, and responsible behaviour.
I'm pro business, but voters are stupid if they keep voting for parties that over protect the business sector.
It would be great if the Republicans (and a large part of their voting base) just took a deep breath and look at examples like Vovo Car's, who clearly accept the problem, given they are moving to 100% production of electrics and hybrids. So their ceo, executives, owners and managers clearly have a different attitude to the envionment than the Republican Party. Maybe they are just smarter business people as well, and see the writing on the wall.
-
nigelj at 06:08 AM on 6 July 2017Bad news for climate contrarians – 'the best data we have' just got hotter
Driving by, yes true in your first half on corrections. Very clever point.
The surface data is more important as we inhabit the surface , but I think climate scientists consider satellite data important because most climate models (but not all) expect 25,000 miles up would heat slightly more than the surface, and this would be a strong sign of the greenhouse effect. the latest data does appear to confirm this. It's something to do with how the lapse rate works.
Here's another fustration on corrections, regarding surface temperatures, the denialists say its all due to "urban heat islands" and then the data is adjusted to ensure this effect isn't biasing temperatures upwards, and then the denialists say "you fiddled with the data". You can't win with these people. It's like falling into a river full of piranah fish.
-
DrivingBy at 00:05 AM on 6 July 2017Bad news for climate contrarians – 'the best data we have' just got hotter
Wouldn't it be helpful to point out that satellites
- Are 20,000+ miles above Earth
- Do not have thermometers.
- Don't measure the temperature where stuff lives.
A theromometer on a satellite would just measure the temperature of space. I suspect most denialists have no clue about that, as they do a copypaste of bullet points they've seen somewhere. If they whine about 'corrections', then give them the raw (microwave sensor) data and tell them to interpret it themselves, but accurately. Then if they just translate microwave sensor raw to temp, it's "wrong, you didn't calibrate". If they do calibrate, come back with "you just used corrections on the data".
But more to the point, note that they're looking at an air mass far above ground that's partly insulated by the greenhouse effect (it's blocking some of the ground's IR radiation). If if you can process the EMR sensor data (microwave sensor, iirc) from 25,000 miles up into an accurate temperature, it doesn't look at the ocean temp (90%+ of surface heat) OR the ground level air temp. So the question could be "Why are you looking away from the thing we're talking about (ocean+surface) and staring into space?
-
SingletonEngineer at 23:21 PM on 5 July 2017Planet Hacks: Flying
I do much of my holiday travel with Google Earth Streetview.
It's less than perfect but is cheap, I don't need to leave my home and chair, and I don't have to put up with other passengers and cramped seating.
More seriously, for several years I and others have been trying to introduce virtual meetings via Skype to Rotary Clubs and the many committees that they spawn. Progress has been slow, but at least the legislation in NSW, Australia was amended a year ago to enable electronic attendance at meetings.
-
Glenn Tamblyn at 15:23 PM on 5 July 20172017 SkS Weekly Climate Change & Global Warming News Roundup #26
Gingerbaker
Just some comments.- The figure of 30 billion tonnes a year. I have done a rough estimate that all mining and quarrying activity is around 100-150 billion tonnes a year, so a significant increase.
- Then all of that needs to be crushed to reasonable fineness. Currently of that 100-150, only part of that is crushed, mainly mineral ores, so possibly doubling world crusher capacity. And crushing is energy intensive. So a substantial expansion. Obviously all this would need to be powered from renewable sources.
So all in all a huge undertaking.
Next, I would want to see a lot more research into consequences in the oceans, that paper is rather light on that topic but it may be the make or break issue. Although they are right about the basic chemistry there is a lot of scope for unintended consequences for the biosphere in the ocean.
Imagine we have spread a couple of 100 billion tonnes, then we discover some unexpected bad consequence in the oceans. Once the dust is scattered that is one very hard Genie to put back ino that bottle.
So I think this idea needs to be explored very strongly, but it is very preliminary at this stage. -
nigelj at 12:49 PM on 5 July 2017Planet Hacks: Flying
What you say is sensible enough. Business can be conducted more via the internet at least in some cases.
In fact the internet, and hd television, and virtual reality systems are perhaps reducing the need for tourists to travel internationally quite so so much. Young people don't need to travel anyway. They spend all their time glued to smartphones.
The finnish video was entertaining and accurate. Who said the Finns had no sense of humour?
-
One Planet Only Forever at 08:46 AM on 5 July 2017Trump fact check: Climate policy benefits vastly exceed costs
Rephrasing my previous comment:
Regarding nuclear power generation costs: If the costs to neutralize or eliminate damaging waste products, not hide them by doing something unsustainable like dumping it in the ocean, are considered then nuclear power is not likely to be a cost-effective option.
-
One Planet Only Forever at 07:25 AM on 5 July 2017Trump fact check: Climate policy benefits vastly exceed costs
Regarding nuclear power generation: Until a way is developed to truly have no "accumulating dangerous waste" nuclear is not a sustainable option.
Regarding ways to get energy from solar and wind when the sun isn't shining or the wind isn't blowing: There are many ways to store energy, including pumping water back up behind a hydro dam or pulling a train load of waste mass up an inclined track with the train rolling down spinning a generator. So what is needed is adequate capacity for generating the total needed power with many existing ways of suitable storage. Better storage technologies will of course make the systems even better. And having combinations of renewable energy supply on the same grid reduces the need to use the stored energy (occasionally windy when the sun isn't shining, sunny when calm).
Moderator Response:[PS] A gentle reminder that this forum is not the place for a discussion on the pro and cons of nuclear power beyond the on-topic points about cost. Those wishing to discuss this issue are encouraged to do so at BraveNewClimate.
-
One Planet Only Forever at 07:08 AM on 5 July 2017Trump fact check: Climate policy benefits vastly exceed costs
nigelj@27,
I agree. And I should have put a larger quote from the interview into my comment@24.
What I disagree with was the suggestion that because of aggression being a permanent part of human character, humanity should move to live on other planets and space stations in case the aggression goes so far unchecked that an entire planet/location is wiped out.
As you mention, the aggression can be effectively managed. My main point is that until humanity effectively limits the winning by unacceptable behaviour it does not deserve to spread onto other locations because the real problem has not been sustainably addressed, it is being spread out with none of the added locations safe from the feared fate.
Also, a group of humans that allows aggression to dominate is not humanity. It is inhumanity or savagery. And inhumanity or savagery does not deserve to have a future.
But on further reflection I would add that aggression is not the major problem. The major threat to humanity is the cult of faithful followers of the damaging dogma that 'a better result will be produced if everyone is freer to believe whatever they want to excuse what they want to get away with doing'. The members of such a cult clearly would expect to benefit from such a belief being enforced/promoted in law and culture. The aggressive, selfish, wicked, mean-minded people will undeniably have a competitive advantage in any game, especially ones with winning based simply on popularity or profitability (no rational consideration of distant motives required). Those people will clearly push against Good Reason restrictions on what they can get away with. And they can easily tempt others to side with them about how unfair it is to restrict their ability to get away with something they want to get away with (or make it more expensive and transfer wealth to the ones who do less of the unacceptable activity), especially if that something has been allowed to become more popular and profitable in spite of the Well Reasoned understanding that it is unacceptable.
-
nigelj at 06:49 AM on 5 July 2017Trump fact check: Climate policy benefits vastly exceed costs
I don't oppose nuclear, but I'm cautious. I grew up during the three mile island scare and chernobyl, and these things imprint on your mind.
And a world full of many thousands of nuclear stations using the current technology would still present a significant risk, and these accidents do not respect borders. Many developing countries are unlikely to have stringent safety standards, training etc.
Then nuclear has cost and issues and is slow to get built etc.
On the other hand I see no problem with newer, safer technology like thorium, but this seems still experimental and stalled. Why is this? Is it because traditional types of power are available and legal to use so theres no incentive to develop thorium?
Developing thorium might take some government assistance, or private / public partnership to develop thorium power to a usable stage.
There's no reason not to combine wind, solar, and thorium if it becomes viable. Small thorium reactors are viable in theory, and this would be perfect to solve intermittency problems or peak load situations. This would be a potent and useful combination if its technically feasible.
-
Rob Honeycutt at 03:26 AM on 5 July 2017Trump fact check: Climate policy benefits vastly exceed costs
It's also important to think in terms of return on investment (ROI). Not talking about energy return on energy investment (ERoEI), just plain ROI.
When an investor puts up money for a coal or gas plant, they're tying up that money for a long period of time. Typical FF plants operate for 40 years. Even though the plant will pay for itself in the early years, the entire lifecycle of the plant is import in order to maximise returns on the investment.
The lifecycle for wind turbines is much shorter, like ~20 years. And already there those plants have a lower LCOE than coal. So, those investors are maximising their investment over a shorter period of time.
What comes into play here are the projections for costs of wind and solar 20 and 30 years down the road when a new generation of wind and solar will replace today's new facilities. The LCOE of all new FF based energy sources will have risen, while the LCOE for renewables will have dramatically fallen.
Where does that leave those FF plants built today? They will be mid-life and economically uncompetitive in the energy market.
I'm fairly certain LCOE calculations don't account for this. They merely look at the full lifetime costs of the plants and projected cost of fuel source. They don't account for the competitive landscape of each technology in the marketplace over the lifetime of the facility.
In this case the shorter lifespan of wind and solar, in a rapidly improving energy market, have a distinct advantage.
-
Peter Shepherd at 00:12 AM on 5 July 2017Bad news for climate contrarians – 'the best data we have' just got hotter
First link to "new paper" needs repair.
Moderator Response:[DB] Fixed; thanks!
-
Eclectic at 20:42 PM on 4 July 2017Trump fact check: Climate policy benefits vastly exceed costs
NorrisM @30 , yes I think you are quite right — even the most optimistic observer can see that there is "nothing that can be done" about the U.S.'s Republican Party politicians, when it comes to getting them to tackle major problems (such as AGW and other long-term issues). We will have to wait for their current political donors to die off [fortunately, many such individual wealthy donors are already very elderly] ..... or in the case of public companies (e.g. ExxonMobil) to eventually be overtaken by shareholder revolt. And please correct me: but I have the impression the G.O.P. is rather lukewarm about building new nuclear plants.
Like Nigelj, I have no fundamental objection to nuclear electric generation. Yet it has almost insuperable difficulties nowadays, with long build times and very high capital costs (including amortization of de-commissioning costs) as well as the worrisome vulnerability to terrorists. Not to mention the NIMBY factor ;-)
Possibly the proposed Thorium Reactors could overcome some of these problems — but that is off in the Never Never Land of the future. And as you yourself say, it is irresponsible to take our society down a road which relies on future technological changes (of a very uncertain sort).
NorrisM, coal-fired generators are nowadays distinctly unattractive to investors. Furthermore, the author you mentioned [Alex Epstein, of The Moral Case etc] has misled you about the marginal cost of their electric output — it is nowhere near as low as wind/solar's. And the same applies with Levelized Costs.
A different Epstein [Paul Epstein] in an economic study Epstein et al., 2011 shows the externalized costs with coal are three times higher than the "face value" costs with coal. Yes, 2011 is 6-7 years ago now — but the externalized cost ratio will not have improved since then. And either way, there is no reason to avoid pushing ahead with more wind/solar generation, for the purpose of achieving a partial reduction in CO2 emissions (since the matter is urgent).
Frankly, author Alex Epstein is little better than a propagandist trying to cloak his bias, and confuse readers with false moralising.
-
bjchip at 19:18 PM on 4 July 2017Trump fact check: Climate policy benefits vastly exceed costs
You should distinguish between the support of a low and stable inflationary regime, and the support of economic growth. The two are different things, and while the first relates to the nature of money, the second does not.
If money is backed by debt and interest is charged for that debt the second most definitely does relate to the nature of money and in fact it explicitly attempts to violate the laws of thermodynamics. Which leads to failure and instability over time, which is observed in every debt-backed money. The actual interest rate that is demanded is zero and ZIRP came as a surprise only because I expected monetary collapse first.
"In the first instance, the economy needs to grow at least at the same rate as the population grows or each generation will become poorer."
Yup... that's required and natural growth and it isn't anything like what we've seen this past century. Is it??? I haven't gotten into population, but population growth is a problem separate from the effect of money as debt. Conflating the two simply worsens understanding of both.
Wait for the book or argue with me elsewhere OK? This ain't the place or the time.
The point is that economics is important to the environment. It is critical to it, because it governs usage of the environment and regulation will only temporarily save a resource that is economically attractive. The "poaching" will happen until the economic advantage or the resource are gone.
-
Kevin C at 19:00 PM on 4 July 2017Surface Temperature or Satellite Brightness?
It also suffers from a lot of surface contamination, which varies with surface type. So turning the brightness signal back into a temperature signal is even harder than for the other channels. For surface temperature, infrared satellites are probably more useful, although you still need to deal with the differing surface properties.
-
nigelj at 18:29 PM on 4 July 2017Trump fact check: Climate policy benefits vastly exceed costs
Norris M @30.
I dont think you can say that fossil fuels are massively cheaper than wind or solar power. I also dont think you can simply say nuclear is cheap power. Plenty of studies show otherwise as below. This is levelised costs on country by country basis and highly detailed. Its consistent with articles I have read elsewhere in Forbes etc.
en.wikipedia.org/wiki/Cost_of_electricity_by_source
Broadly generally on shore wind and hydro is the cheapest form of electricity per unit, levelised cost. Coal is moderately cheap.
Nuclear, Solar and offshore wind are in the middle.
Gas is expensive but depends on the type.
I think choices on low emssions electricity generation are best made by individual countries according to their available best resources, etc,etc.
I dont have anything firmly against nuclear power but clearly it has its issues, benfits, and problems. I dont see how nuclear stands out as a magic or universal answer. The costs are just not low enough, and it is very slow to build, and get regulatory approval compared to wind or solar.
But then, no option stands out as a magic answer. On shore wind has become very cost competitive, but then it won't work alone as the only option for countries without consistently reasonably windy weather.
My country has numerous options before exploring nuclear power, and we have seismic issues right through our country, and are very reliant on agricultural exports, so just cannot afford even a slight nuclear problem.
On the other hand as you say nuclear may appeal to the Republicans, and may be acceptable to the public in America. It may suit countries with very inconsistent wind or cloudy climates, and lacking in other energy resources.
-
nigelj at 17:58 PM on 4 July 2017Trump fact check: Climate policy benefits vastly exceed costs
Doug_C @29
I don't know what the future would bring, or what will replace capital, but this book attempts to answer exactly that question: Post Capitalism, by Paul Mason.
He talks about historic economic cycles, Kondratief Waves, and the rise of the uber style economy as an indication of where things might be going. He explores the peer to peer economy and possible changing roles of money, new forms of lending, changing nature of ownership, bitcoin etc. Its not a stunning book, but its definitely very good. He also gets right into climate change and the low carbon economy.
I have another interesting one I'm half through: How will Capitalism End, by Wolfgang Streeck.
And here's another book of relevance: The production of money, how to break the power of bankers, by Ann Pettifor. BJChip you might be interested.
I tend to favour a soft edged version of capitalism myself. The Joseph Stiglitz approach, the nobel prize winning economist chap.
-
bjchip at 17:29 PM on 4 July 2017Trump fact check: Climate policy benefits vastly exceed costs
Tom Curtis #14
"If money represents work done, in the standard sense of physics, then mining 100 tonnes of nickel ore and transporting it to a refinery would generate no more, and no less, value than mining 100 tonnes of quartz"
No. It costs the same "money" or "energy" to do the mining but that is not the same as the value we place on what we extract.
Value and Money are not the same thing. You can waste money, you can waste work, but the value of something painted by a Picasso is vastly different from the work that Picasso put into it. It was however his work. If you pay YOUR work for that Picasso you have to exchange value, not work. Once the separation occurs - that value is subjective but money is objective - the remaining problems of investment and taxation and the representation of entropy remain to be solved.
I said it is complicated. I was not understating things. It is simple to say it, but we who have been raised with nothing but debt based dollars as our medium of exchange have a great deal of difficulty dealing with anything else.
-
NorrisM at 15:57 PM on 4 July 2017Trump fact check: Climate policy benefits vastly exceed costs
Eclectic@21
After watching the YouTube taping of the proceedings of the House Committee on Science, Space and Technology in March 2017 and the announcements of Trump, I do not see any realistic chance that Trump and the Republicans will do very much at all on specific steps to counter AGW beyond Trump's announcement of greater funding for nuclear energy research. I personally think this is about the only thing that he has got right. I think you know that James Hansen also believes that we cannot realistically replace fossil fuels without a major shift to nuclear energy. I think this echoes the views of Doug_C in this thread.
On the issue of Alex Epstein, unless I have missed something, the cost per unit of energy for fossil fuels today is massively less than that of solar or wind power leaving aside some form of carbon tax. In four years, since the publication of his book I highly doubt that the technology has changed. In spite of the efforts of Elon Musk, it is my understanding that there has NOT been a major breakthrough in the technology of batteries that can solve the underlying problem of solar and wind power (leaving aside their costs per unit of energy) of supplying electrical generation at night. This clearly will be a game changer if and when it happens. But look at cold fusion. Where is it today. It is irresponsible to take our society down a road which relies on future technological changes. Nuclear power is the responsible way of weaning us from fossil fuels if it is determined that the costs outweigh the benefits.
Although I do not agree that every forest fire can be attributed to climate change (ever considered El Nino?), I do agree with Doug_C that nuclear energy is the only realistic way to go.
So perhaps this should be the focus with the Republican party. Support the efforts of the Climate Leadership Council. This is a "revenue neutral" proposal that puts a price tag on fossil fuels but returns the tax to the US people by way of a "dividend". But after looking at the Republicans propose massive reductions in Obamacare in order to pay for tax cuts for the wealthy, I am not sure that will even work because this Carbon dividend would clearly help the poor in the US. The rich would clearly put more in by way of carbon tax than they would get out by a pro rata divident to all US citizens. Trump's coal miners might not be so happy as well.
Editor: This is clearly on topic because according to James Hansen, nuclear energy wins "hands down" over the per energy unit cost of wind and solar power.
-
Doug_C at 15:28 PM on 4 July 2017Trump fact check: Climate policy benefits vastly exceed costs
nigelj @ 28
I think you put it really well, Adam Smith one of the pioneers of modern economics was an early proponent of free markets but soon came to realize that capital was a great servant but a very poor master.
"People of the same trade seldom meet together, even for merriment and diversion, but the conversation ends in a conspiracy against the public, or in some contrivance to raise prices."
I think the days of capital based economics are coming to an end, they have served their purpose and their time is done.
I'm not sure what will replace them, but it is going to have to be very dynamic and adaptive in the same way human society as a whole will have to be in the coming decades.
The challenges we are leaving for the generation just entering the world and those that follow are immense.
-
BaerbelW at 14:23 PM on 4 July 2017Bad news for climate contrarians – 'the best data we have' just got hotter
newairly - check Kevin C's Surface Temperature or Satellite Brightness? from last year. The article contains a flow chart depicting how the measurements from satellites "turn" into temperature. It should answer your question.
-
newairly at 13:47 PM on 4 July 2017Bad news for climate contrarians – 'the best data we have' just got hotter
I have always thought that satellite measurements depend on modelling to extract temperature signals from the raw data. Am I correct about this? Are there any fairly basic sources which describe how the temperature signal is extracted?
-
nigelj at 13:14 PM on 4 July 2017Bad news for climate contrarians – 'the best data we have' just got hotter
Important news, and good historical perspective in the article. Of course the denialist response will be predictable and tiresome, involving the usual stupid accusations.
-
Gingerbaker at 11:51 AM on 4 July 20172017 SkS Weekly Climate Change & Global Warming News Roundup #26
tcflood
1) Jacobson & Delucchi reply to Clack:
http://web.stanford.edu/group/efmh/jacobson/Articles/I/CombiningRenew/Line-by-line-Clack.pdf
2) Clack responds to J&D'd response:
http://www.vibrantcleanenergy.com/wp-content/uploads/2017/06/ReplyResponse.pdf
Moderator Response:[PS] Link fixed. Please learn how to do this yourself in the Link tool.
-
Gingerbaker at 11:44 AM on 4 July 20172017 SkS Weekly Climate Change & Global Warming News Roundup #26
Michael Sweet
The link study addresses many of the issues listed in your review paper. 1 Kg olivine sequesters 1.25 kg Co2. When ground up into powder, it works very fast, and also produces carbonate which will address ocean acidification. To sequester 1 year's worth of our current CO2 emissions, it would require 7 cubic kilometers worth of stone. This would be a large operation - making olivine the 3rd largest mining product. It would cost $250 billion a year.
We would obviously need to stop burning carbon. But this would be a relatively inexpensive way to reduce atmospheric CO2 levels quickly. Quite a bargain, really.
-
scaddenp at 07:52 AM on 4 July 2017A Comprehensive Review of the Causes of Global Warming
It is also worth noting that in political debates, finding a middle ground is often in the way forward. However, science doesnt go for middle ground much. You cant try and postulate that there are fictional sources of warming for which there is no evidence. If you want to excuse humans then you need to provide evidence for other causes that dont violate first law thermodynamics. For example, you cant say the warming is coming from the oceans on some "natural cycle" while the oceans continue to heat. You can explain short term heating (eg El Nino) from ocean/atmosphere exchange (ocean heat content drops) but not long term.
-
nigelj at 07:41 AM on 4 July 2017Trump fact check: Climate policy benefits vastly exceed costs
Doug_C @25, yeah I agree about the underlying physical science realities and risks. This is my underlying thinking and has been for years. I do think we are at huge risk of undermining the only planet we have, and we absolutely cannot count on escaping to other planets etc.
However I have turned into an envionmental pragmatist or moderate in some ways. I can see the business perspective as well, and that we have to be realistic and fair to everyone. We need the business sector.
To me its a case of how do we promote economic growth and mining etc, but how do we do this responsibly with minimal impact? Its a hard road technically, and I'm treading a middle ground ideologically, and will not be popular for that, but I see few options.
I think we can "have our cake and eat it" if we are smart, and just a bit fair minded.
But you are dead right any economic or real world policies have to fit within the physical limits of the environment. That's a good bottom line. Of course the debate is how you quantify all this.
"How do you get government that is supposed to represent society in general and the private sector to cooperate to protect the basic integrity of the planet we all depend on for survival when the clear imperative in many cases is to have the greatest benefit for the private sector no matter the cost to us all."
It's a big problem. The pendulm has swung too far to corporate neoliberalism. A healthy belief in free markets has been wrongly interpreted to mean no control over markets at all, and profit as the only criteria which is clearly not workable. Profit is important, but so is maintaining stability of the underlying system.
Such a thing as genuinely totally free markets is actually impossible, unless we want no government and total anarchy. The term only ever meant free from arbitrary and illogical control. Markets have to have rules and boundaries, or they dont function and cause irreparable harm. And this is really about issues around health, safety, environmental concerns, and financial stability.
Politicians need to wake up to these obvious realities. They are there to make planetary systems workable and stable, not to pander to narrow, selfish and destructive interests.
Prev 402 403 404 405 406 407 408 409 410 411 412 413 414 415 416 417 Next


