


 Arguments


Recent Comments
Prev 415 416 417 418 419 420 421 422 423 424 425 426 427 428 429 430 Next
Comments 21101 to 21150:
-
RedBaron at 02:49 AM on 30 January 20172017 SkS Weekly Climate Change & Global Warming Digest #3
Michael,
You are right that US farmers are businessmen. You are also right that farmers have pretty good long term records. You are right that farmers are aware of the impact climate change is causing their businesses. I never once met an American farmer who was an AGW denialist. And most American farmers are conservative Republicans too. Their influence is part of the reason for the "red state" heartland traditionally voting Republican.
So there is an opportunity with farmers to develop an AGW mitigation strategy that cooperates with the Republican party by including this demographic of Farmers and rural communities.
However, you will have to address a few things.
In 2012 the average age of farmers was 58.3 with over 20 times more farmers over age 75 as under 25. This has been growing steadily every year, as income:cost of living ratio has dropped. 52.2% of those farmers principle income off farm and only 46.1% of farmers with net positive income from farming. That means a full 63.9% of US farmers are operating at a loss and the only way they manage to avoid bankrupcy is off farm income. As if farming wasn't already a hard enough job!
Source: USDA-NASS, Census of Agriculture
This has caused a steady stream of farms to fail since 1970. In fact the financial stability of the small to medium family farm continues to decline, forcing 1/2 of the farmers in the whole country out of business and the remaining farms have doubled in size.
Also, Ag’s % GDP has fallen from 6.8% to .7% GDP. Available arable land has fallen from 189,244,000 hectares in 1969 to a minimum value of 151,669,300 in 2011 due to extensive land degradation and land use change. We are producing about 1 ton of food for every 100 tons of top soil lost. The % of the US publics food dollar that reaches the farmer is at an all time record low.
As razor thin as farm margins are, in order to effectively recruit this demographic you must first teach the farmer how to disconnect his operation from fossil fuel inputs. Right now lowering the price of oil can mean the difference between a profit and losing the farm.
"When farmers view soil health not as an abstract virtue, but as a real asset, it revolutionizes the way they farm and radically reduces their dependence on inputs to produce food and fiber." -USDA
It is one of the reasons for the huge push by the USDA NRCS & SARE to teach farmers how to wean themselves off Haber process nitrogen and mined phosphorus. A push that Trump right now has on hold with the gag order on the USDA! And worse, Trump appointed an industrial Ag guy.
Trump picks Sonny Perdue for agriculture secretary
So don't expect any improvement this 4 years. The fox is in charge of the hen house.
See the real power isn't really the farmers. They are between a rock and a hard place. The real power lies in the industrial giants supporting the farmers and taking that huge cut of the food dollar. As long as the US farmer is dependant on them, they really have no choice at all. And by themselves, there are far too few to worry about, and are typically safely ignored as a voting demographic. As long as the real power at the USDA is using the "mushroom" strategy, expect no help from farmers, no matter how scientifically and economically sound it might be.
-
michael sweet at 23:15 PM on 29 January 20172017 SkS Weekly Climate Change & Global Warming Digest #3
Digby Scorgie,
Farmers are a powerful lobbying force in the USA. Most farmers are rich businessmen. If they were serious about climate change their voice would be heard. Their failure is one of the major effects of climate change. Farmers keep long term weather records for their locations. They are aware of the changes climate change is causing for their businesses.
If farmers were to take a strong stand on AGW the Repubilcans would have to listen. The factor holding back their concern is completely political. If they can be reached it would comletely change the political debate. That change would benefit all of us (as Tom states).
-
Tom Curtis at 20:59 PM on 29 January 20172017 SkS Weekly Climate Change & Global Warming Digest #3
Digby Scorgie @9, because my children will also be adversly effected by those consequences. As will billions of others.
-
Eclectic at 13:26 PM on 29 January 2017CO2 lags temperature
Tom Curtis @517
Thanks for your courteous and prompt reply, especially in view of your workload. I had been innocently picturing that each of the recent set of glaciations followed a very standardized path, without much variation. There was an earlier SkS article that linked to a paper showing the Milankovitch orbital fluctuations of the past half-million years, and indicating that in the coming few dozen millennia we would experience a relatively low-eccentricity of orbit, which might have a damping effect on the approach of the next glaciation. But as you say, Holocene humanity (and its increasing population) would be a more likely explanation for the Holocene's "abnormality".
Thanks once again, Tom. And if it's not being too saccharine of me, I'd like to thank you on behalf of all visitors and participants at SkS. You are a scientific powerhouse in the SkS comments columns.
-
Digby Scorgie at 12:31 PM on 29 January 20172017 SkS Weekly Climate Change & Global Warming Digest #3
michael sweet @8
I don't understand the need to persuade people of the reality of climate change, even if their livelihood depends on it. If they refuse to accept reality, let them suffer the consequences.
-
michael sweet at 11:00 AM on 29 January 2017Joint Statements on Climate Change from National Academies of Science Around the World
Driving By,
We do not need to wait 75 years to start movng cities. Already parts of New York and New Orleans have not been rebuilt. Those people moved inalnd. Miami Beach is currently spending hundreds of millions of dollars in a futile effort to hold back the sea. They will eventually have to give up and move. In Tampa Bay, where I live, $175 billion dollars of real estate is at risk from the next hurricane.
If the next major hurricane strikes Galveston (or any other major city at risk) the Federal Government will likely stop subsidizing insurance. When that happens homes in the low areas will no longer be worth anything. People will start to move. Recently the New York Times claimed houses threatened by sea level rise have not increased as much in value as safer houses.
This Zillow report claims 1.9 million homes in the USA will be flooded by 6 feet of sea level rise. On the East Coast a substantial number of those would be flooded in a big storm now. When investors realize the risks they are taking what will happen to the coastal housing market? A hurricane does not have to strike me, if Fort Lauderdale gets hit (39,000 homes at risk from 6 feet of flooding, a big hurricane can have over ten feet of storm tide) our insurance will go up.
I am 58 but I expect to see coastal property values tank in my lifetime.
-
Digby Scorgie at 10:25 AM on 29 January 2017Joint Statements on Climate Change from National Academies of Science Around the World
According to Kevin Anderson of the Tyndall Centre, a likely warming of four degrees by the end of the century under business as usual will result in a planet incompatible with an "organized" society. He didn't use the term "civilized" because he didn't think we currently have a civilized global society!
He also reckons that, taking carbon budgets into account, we'd have to shrink the global economy by 10% a year to avoid more than two degrees of warming. The economists, on the other hand, say that 4% is the most that can be contemplated, else global civilzation will collapse.
I conclude from the foregoing argument that we either collapse global civilzation now in exchange for a habitable planet or we do nothing and collapse civilization later when the planet becomes barely habitable. If the argument is valid, civilization collapses in both cases.
-
Tom Curtis at 09:02 AM on 29 January 2017Temp record is unreliable
Eclectic @403, I have responded here.
Moderator Response:[PS] Thanks for your consideration in keeping conversation ontopic. Most appreciated.
-
Tom Curtis at 09:01 AM on 29 January 2017CO2 lags temperature
Eclectic asks elsewhere, with regard to the relative attribution to albedo and ghg contributions to the glacial to interglacial cooling as shown in Hansen and Sato:
"May I ask you whether the warming-phase figures are similar — or whether the CO2/albedo relationship is asymmetric regarding the actual causation of progressive warming as the planet exits a glacial age (i.e. whether CO2 plays a larger role in the ultimate root cause of the rapid 3-degree warming which terminates the typical glacial age) ?"
The graph I showed represents the change in radiative forcing and temperatures between the Last Glacial Maximum and the Holocene, ie, over a warming phase. However, it takes the difference in the values between the two times, and the relative contribution may (indeed, probably) differs at different stages in the process, or by small amounts for different glacial to interglacial (warming) or interglacial to glacial (cooling) transitions.
Based on Shakun et al (2012), durring the earliest phase of the most recent glacial to interglacial transition, albedo effects were probably more important than GHG effects, but that means at some stage the GHG effects would have been more important than the albedo effects than is shown in the Hansen and Sato graph. Otherwise the cumulative effect would not be that shown in their graph.
Likewise, from the long lag in the previous glacial to interglacial shown in the first graph in the OP, albedo effects were probably more important in the early stages of that transition, with GHG effects becoming more important later on with cumulative contribution from Eemian to LGM likely to approximate to those shown in Hansen and Sato. That said, lags vary substantially between different transitions, and sometimes though not often CO2 changes precede temperature responses (eg, 325000 years ago in the Vostock graph) - so the exact relative contribution and timing of the contribution must also vary. In general, however:
1) Milankovitch effects trigger the temperature response;
2) Albedo effects seem to follow closely on the Milankovitch effects; and
3) GHG effects seem to lag on both, and to lag more in cooling transistions than in warming transitions.
As to GHG being unimportant, consider this smoothed version of the Vostock graph:

The smoothing makes clear that the current interglacial is unusual in to respects. First, in prior interglacials temperatues have declined quite rapidly after the maximum has reached (in geological terms), before dropping through the floor once some threshold is reached. In contrast, in the Holocene, they have remained near constant. Second, in prior interglacials, have also declined (though not as rapidly as temperature initially in the Eemian at least). In contrast, in the Holocene the CO2 concentrations started to decline, and then rose by about 20 ppmv, against the temperature trend. There is substantial reason to believe that the CO2 increase was due to agricultural practises of preindustrial humans; and that the flat temperatures of the Holocene are due to the temperature increase from the rising CO2 countering the temperature decrease from the known increase in albedo over the same period (due to Milankovitch factors). (Known increase in albedo because the Arctic was ice free 8000 years ago, and reached a Holocene maximum in sea ice extent in the 19th century.) The Holocene climate and CO2 record would not have been possible if CO2 had no effect. Of course, there is far better evidence of the effect of CO2 than this, and I do not expect anybody unwilling to be convinced by that other evidence to be convinced by this. But it does illustrate that their go to evidence also refutes their case.
-
Tom Curtis at 07:59 AM on 29 January 2017Joint Statements on Climate Change from National Academies of Science Around the World
DrivingBy @2, "the public" is not a set with constant composition. Specifically, overtime the number of people born before any specific year tends to decrease, while the number born after that year tend to increase. And for those born after 1990, typically their minds are not made up (and they accept global warming science in a far higher proportion than more elderly demographics). Further, not all those who are older have opinions set in stone. Particular events significantly effect opinions on the matter, and consequently the willingness to take action. I expect future temperature increases, and key events such as the first year with zero ice at the North Pole (for instance) to result in significant changes in acceptance of the science. Within 20 to 30 years, due to the change of generations, and increasing warming, AGW denial will become as popular as flat earthism. The only problem is that may be 5 to 25 years too late.
Regardless, it is definitely worthwhile to continue making the case for AGW because:
1) We need to have the case out their for those just coming into adulthood to have a chance to learn;
2) The better we present the case, the more rapidly trigger events will shift the range of opinions; and (perhaps most importantly)
3) If we stop presenting the case for AGW science, that will not stop the deniers from presenting the case for AGW pseudoscience. As a result, if we stop, we can expect acceptance of the science to decline over time, not increase.
-
Tom Curtis at 07:48 AM on 29 January 2017Joint Statements on Climate Change from National Academies of Science Around the World
Richard @5, with regard to point 1, the IPCC AR4 stated:
"An assessment based on AOGCM projections, probabilistic methods, EMICs, a simple model tuned to the AOGCM responses, as well as coupled climate carbon cycle models, suggests that for non-mitigation scenarios, the future increase in global mean SAT is likely to fall within –40 to +60% of the multi-model AOGCM mean warming simulated for a given scenario. The greater uncertainty at higher values results in part from uncertainties in the carbon cycle feedbacks. The multi-model mean SAT warming and associated uncertainty ranges for 2090 to 2099 relative to 1980 to 1999 are B1: +1.8°C (1.1°C to 2.9°C), B2: +2.4°C (1.4°C to 3.8°C), A1B: +2.8°C (1.7°C to 4.4°C), A1T: 2.4°C (1.4°C to 3.8°C), A2: +3.4°C (2.0°C to 5.4°C) and A1FI: +4.0°C (2.4°C to 6.4°C). It is not appropriate to compare the lowest and highest values across these ranges against the single range given in the TAR, because the TAR range resulted only from projections using an SCM and covered all SRES scenarios, whereas here a number of different and independent modelling approaches are combined to estimate ranges for the six illustrative scenarios separately. Additionally, in contrast to the TAR, carbon cycle uncertainties are now included in these ranges. These uncertainty ranges include only anthropogenically forced changes."
Since then the IPCC AR5 has stated:
"Global mean temperatures will continue to rise over the 21st
century if greenhouse gas (GHG) emissions continue unabated.
Under the assumptions of the concentration-driven RCPs, global mean surface temperatures for 2081–2100, relative to 1986–2005 will likely1 be in the 5 to 95% range of the CMIP5 models; 0.3°C to 1.7°C (RCP2.6), 1.1°C to 2.6°C (RCP4.5), 1.4°C to 3.1°C (RCP6.0), 2.6°C to 4.8°C (RCP8.5). Global temperatures averaged over the period 2081– 2100 are projected to likely exceed 1.5°C above 1850-1900 for RCP4.5,
RCP6.0 and RCP8.5 (high confidence), are likely to exceed 2°C above 1850-1900 for RCP6.0 and RCP8.5 (high confidence) and are more likely than not to exceed 2°C for RCP4.5 (medium confidence). Temperature change above 2°C under RCP2.6 is unlikely (medium confidence). Warming above 4°C by 2081–2100 is unlikely in all RCPs (high confidence) except for RCP8.5, where it is about as likely as not (medium confidence)."So, the 1.1 C has support as the lower end of the range of the low emission scenario in both reports, but the AR4 assessement has a higher upper end projection for at least one scenario, while the AR5 upper end projection for its highest emmission scenario is only 4.8 C.
With regard to 2, the increase in atmospheric CO2 due to CO2 emissions falls to about 25% of total emissions over a couple of centuries, and then very slowly declines to zero over hundreds of thousands of years. Given that the atmospheric component currently represents about 45% of emitted CO2 (including from Land Use Change), that means we could expect a further 55% reduction from the current atmospheric increase (ie, from 400 to 330 ppmv) over the next couple of hundred years if we ceased all emissions now. The 25% figure is a rough estimate, and varies depending on the total CO2 emissions, with a greater increase with greater total emissions. If we were to continue to emit at BAU rates for a century or too, it would climb towards 40%.

With regard to point 3, Matthews and Caldiera (2008), Matthews and Solomon (2013) have shown that on the cessation of all emissions, Global Mean Surface Temperature remains approximately constant over time. This is shown in a graph from Steve Easterbrook's blog (which appears to come from a talk by Matthews, but Easterbrook is not specific):

As can be seen, to have a reasonable chance at keeping temperatures below a 1.5C limit, we need to reduce emissions sufficiently fast to keep a constant concentration. We would need almost as fast a reduction to keep it below 2C. But whenever we achieve zero emissions, temperatures thereafter will remain near constant for centuries as the draw down in emissions approximately cancels the slow increase to equilibrium temperatures.
As a side note, while global means surface temperatures will remain approximately constant, global mean land temperatures will cool slightly while ocean surface temperatures will increase.
I take the above to also answer your other two points.
-
scaddenp at 05:52 AM on 29 January 2017Joint Statements on Climate Change from National Academies of Science Around the World
Richard, try this post which discussed Hare and Meinshausen 2006.
-
Richard13791 at 04:24 AM on 29 January 2017Joint Statements on Climate Change from National Academies of Science Around the World
Some observations:
1. Average global temperatures are predicted to rise by 2100 by from 1.1 to 5.4 deg C. (Is this accurate?)2. Once CO2 gets into the atmosphere most of it stays there for a very long time (perhaps centuries), and presumably continues to contribute to rising temperatures while it is there.
3. To set a lower boundary on the problem, let’s say that ALL new human-produced CO2 and methane added to the atmosphere is reduced to ZERO starting tomorrow. Using current models, what is then the predicted change in average global temperature in 2100?
4. Are my statements/assumptions accurate?
5. Has anyone run the simulation I describe in (3)?
-
DrivingBy at 03:02 AM on 29 January 2017Joint Statements on Climate Change from National Academies of Science Around the World
More typos... An edit function would be much appreciated!
-
DrivingBy at 03:00 AM on 29 January 2017Joint Statements on Climate Change from National Academies of Science Around the World
Durn, posted before completing the first paragraph... the next sentence was to the effect that the public will notice when they are forced to do something, but will still believe what they want to believe.
Rising seas will be considered caused by CO2 driven warming by some, by the Evil Americans to others, by 'natural cycles' to consumers of internet wisdom, by 'depravity and Somomites' to a few, and by "the Infidel angering Allah" by a larger group.
-
DrivingBy at 02:49 AM on 29 January 2017Joint Statements on Climate Change from National Academies of Science Around the World
Science has done all it can to communicate on this issue. If the public does not want to listen, they will not, and shouting will only make them angry. If nothing changes, expensive, unpleasant adjustments such as moving coastal structures inland will have to be made ... in 75 years.
A project to record who said what denying or obfuscating the issue will have some historical value, it can be referred to when dealing with further such issues. Most people rather dislike science, although they're happy to use the end products, which they assume are obvious. Nobody (as a % of the population) thinks about how electricity was discovered, less than nobody uses their phone and thanks Maxwell's equations.
Quite recently, an airplane hit terrain, killing all on board. To prevent another crash, the airline slaughtered a goat. Not a joke: https://mobile.twitter.com/asimusafzai/status/810516110890172416
-
Tom Curtis at 00:20 AM on 29 January 2017CO2 lags temperature
poncholarpez @515:
1) Greenhouse gases account for 46%, and CO2 changes for around 30%, of the temperature change between glacial and interglacial, as shown in the following graph:
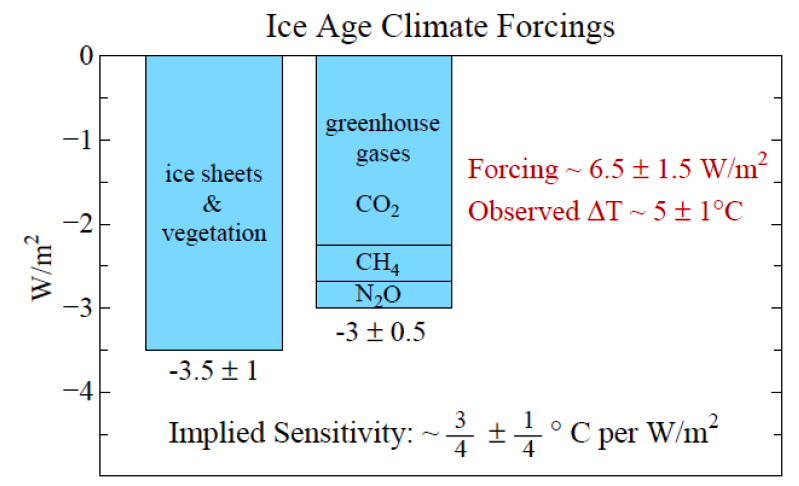
Based on that, the presumption would be that a 125 ppmv increase in CO2 would drive not a 9 C increase, but a 3 C increase, assuming linearity. Of course, there is not point in assuming linearity because it is known that temperature responds to the log of CO2 concentration, not linearly. Factoring that in, the expected equilibrium response (ECS) of the current increase over the preindustrial is about 1.5 C. To reach the equilibrium response, however, takes decades. The expected current response is better mapped by the Transient Climate Response (TCR) of about two thirds of the ECS, or about 1 C for the current CO2 concentration. Of course, the temperature response over the glacial cycle has time for a full equilibrium response rather than just the transient response.
The upshot is that your entire premise is wrong.
2) Moving on from that, because the CO2 response represents only about a third of the total response, it is quite possible that a decline in one of the other factors could lead to a gradual decline in temperature, which leads to a decline in CO2 concentration. In particular, albedo is likely to increase gradually as NH summer insolation declines as a result of Milankovitch cycles.
The upshot is that you have simply demonstrated once again that, as is so often the case, arguments premised on scientists being too stupid to see the obvious merely show the person making the argument to be too ill informed to see what is obvious to those scientists all along.
-
poncholarpez at 23:45 PM on 28 January 2017CO2 lags temperature
Based off the carbon dioxide v temp change over 400,000 years graph, it shows for a 80ppm rise in carbon dioxide that the temp increase is 6 degrees C. If you then take Tom Curtis's graph showing todays carbon dioxide level spike which is an increase of 125ppm you can roughly interpolate a future temp rise of around 9 degrees C assuming its linear. This is without even starting to reduce overall global emsiions. This is all assuming co2 causes temp increases(and if it does, humanity has already gone past the point of no return and all this arguing is a waste of time). But it doesnt and I can prove why. If you look at the backsides of the spikes of co2 v temp, you will notice as the suns effect reduces and temp falls, co2 still stays high. If co2 was the driving factor, temp wouldnt suddenly decline, it would plateau(as its a greenhouse remember) and both co2 and temp would come to an equalibrium and fall together. This is not showen to be true based off the historical data.
-
Eclectic at 23:31 PM on 28 January 2017Temp record is unreliable
Tom Curtis @401
Thank you for the correction on CO2/albedo contributions to the episodic cooling process producing a (modern) glacial age. The diagram you supplied indicates a (roughly) one-third contribution coming from CO2 changes alone, for the cooling phase.
May I ask you whether the warming-phase figures are similar — or whether the CO2/albedo relationship is asymmetric regarding the actual causation of progressive warming as the planet exits a glacial age (i.e. whether CO2 plays a larger role in the ultimate root cause of the rapid 3-degree warming which terminates the typical glacial age) ?
My error in #400, came from mis-remembering your recent statement [which I have checked as being: 11 January 2017, Comment #513, in "CO2 Lags Temperature"] that "90% of the temperature increase lags the CO2 increase". Which (on reflection!!) certainly is not equivalent to saying that only 10% of glacial-to-interglacial warming is caused by the (Milankovitch) orbital variation and its arctic albedo effects .... with the rest being a direct consequence of CO2 and other GHG's. !
I had concentrated more on the final question from Bulthompsn @399, where he had made an irritable (off-topic) question, which would have been better made separately on the "CO2 Lags Temperature" thread. But since his @399 comments had a tone/manner suspiciously suggestive of a "drive-by" venting, I thought it pardonable to answer him entirely in this thread.
If you can spare the time, Tom, please reply on the "CO2 Lags Temperature" thread. I consider the "90%" figure a very useful one, in countering the frequent denier meme that the "lag" must mean that CO2 is a trivially unimportant tail of the climate dog.
-
michael sweet at 22:36 PM on 28 January 20172017 SkS Weekly Climate Change & Global Warming Digest #3
The New York Times had an interesting article on climate change attitudes in Kansas. Farmers there all know that the climate is changing but it is politically incorrect to talk about it. They discusss the "strange weather" instead. From the article it appears that a completely different approach is needed to reach these very important people.
The Times says that some of the big agriculture enterprises are starting to raise climate change as an issue since it is obviously so important to farmers. The farmers are resistant to any discussion of the IPCC or the words "Climate Change". How can the data be reframed to reach these people? They know that they plant crops three weeks earlier than they did 30 years ago, it must be possible to get them on board. They know rain patterns have changed and more extreme weather is happening.
They do not want the government or environmentalists to tell them what to do. Perhaps working with the busines leaders would be a way to approach them. Their income stream is threatened by climate change. If the data were presented to them correctly they will take action to protect their future income.
-
Tom Curtis at 16:08 PM on 28 January 2017Temp record is unreliable
Bulthompsn @399, I am not aware of anybody here "blowing off" human error when discussing Global Mean Surface Temperature (GMST). Certainly the scientists who analyze it do not. Indeed, the take great care to analyze potential sources of error, and to quantify the resulting uncertainty in their estimate of GMST, as shown in this graph from the Berkely Earth Surfact Temperature project (BEST):
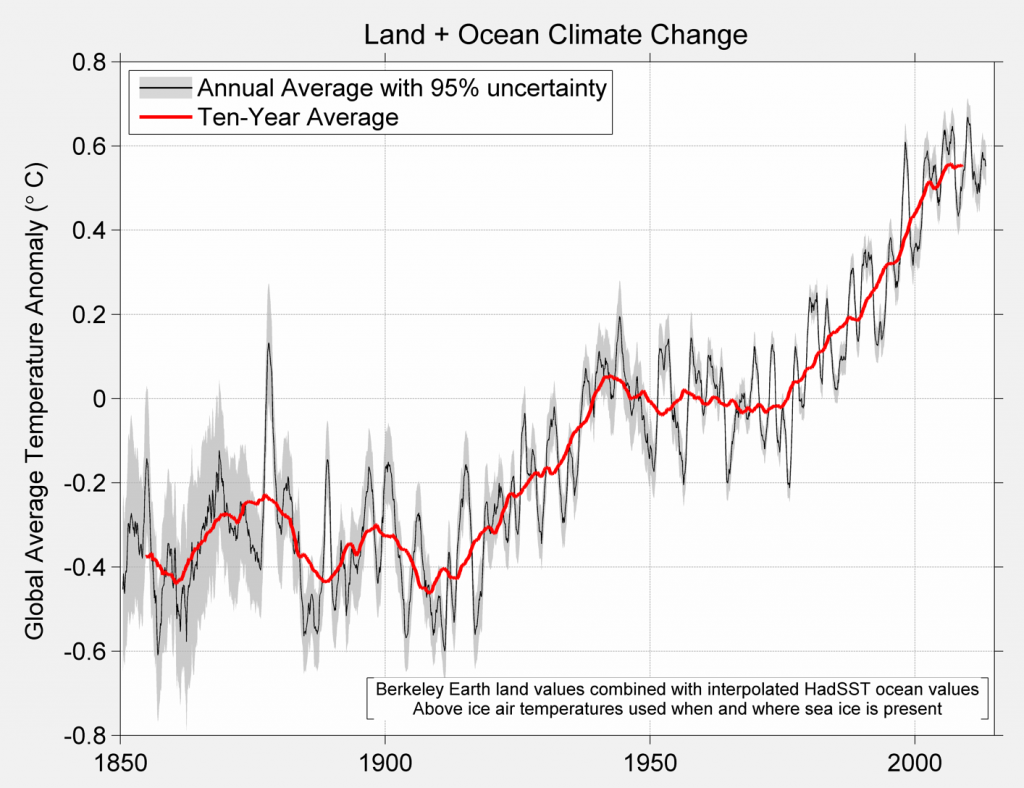
Note, that the grey shaded zone (the 95% confidence interval of the annual GMST estimate) shrinks rapidly from 1850 to 1880, and that post 1950 is very small relative to the decadal change in GMST. Other teams do not typically show uncertainty on the graphs, but do publish the uncertainty with the data and in scientific papers discussing methodology.
Nor are the satellite records more accurate than the surface records. That is not just my opinion, but that of Carl Meares, head of the team that produces the RSS satellite temperature records, who said:
"A similar, but stronger case [regarding trends] can be made using surface temperature datasets, which I consider to be more reliable than satellite datasets (they certainly agree with each other better than the various satellite datasets do!)."
(My emphasis, source)
This can be seen by comparing the size of the error in the trend estimate for RSS TLT vs HadCRUT4 for the period 1979-2012:
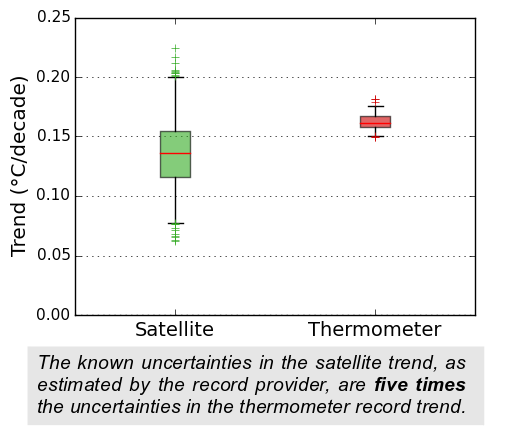
Indeed, the satellite record requires more adjustments from a more disparate original data set than is required for the surface record. This is something people pushing the accuracy of the satellite record never see fit to mention, but that it is the case is obvious when you have a look at (already partially adjusted) satellite data (top panel):

For further information see here, here, here, and here (the start of a four part series).
Finally, IMO, anybody who subscribes to a conspiracy theory of science ("This presumes that these current results are not being doctored") has thereby invalidated any claim they may have made to be informed, or rational on the topic.
-
Tom Curtis at 15:11 PM on 28 January 2017Temp record is unreliable
Eclectic @400, the change in radiation due to changes in the Earth's orbit (Milankovitch cycles) has mostly a regional effect, with almost no net effect on globally averaged radiative forcing. The regional effect, however, can be quite large, and is sufficient to cause feedbacks which in turn are responsible for nearly 100% of the change in the energy balance between glacial and interglacial. Those feedbacks can be changes in albedo (ice sheet, sea ice, and snow extent, along with changes to vegetation) and changes in greenhouse gas concentration (mostly CO2 and CH4). According to a well known figure from Hansen, the greenhouse gases represent about 46% of the total effect, with the rest being from changes in albedo:
(Source)
-
Eclectic at 14:36 PM on 28 January 2017Temp record is unreliable
Bulthompson @399 :-
The warm up since the ice age [the most recent Glacial Age] was caused about 90% by CO2 and more minor Greenhouse Gasses (and the initial 10% by temporary Earth orbit changes).
Funnily enough, Bulthompson, you can learn some of these very basic things by reading the very first of the "Most Used Climate Myths". Yes, that's right : Climate Myth Number 1 , which you will find on the Home Page, top left corner.
You will also benefit yourself by reading Myth Number 12 . . . as well as many of the others.
You seem to be suffering from a (misplaced) belief in Alternative Facts.
Also please note that the "weather satellites" [as you have misnamed them] don't really measure world surface at all, but rather measure air temperature in the upper atmosphere (mid and upper troposphere, predominantly) miles above where humans, plants and animals do live. Bulthompson, you will be falling into a trap for fools, if you take the "satellite temperatures" as a replacement for plain straightforward thermometers at ground level & ocean level.
There seems to be a lot of science that you don't understand. Best for you, would be a long course of reading and thinking, as you work your way down the Climate Myths — starting of course at the Number One .
That will help you avoid making embarrassing assertions based on false ideas.
-
bulthompsn at 13:36 PM on 28 January 2017Temp record is unreliable
I love how you guys blow off human error in discussing the accuracy of historical global temperature records. Wars, revolutions, empty government coffers all existed for centuries prior to weather satellites giving us accurate temps. This presumes that these current results are not being doctored. What caused the warm up after the ice age?
Moderator Response:[PS]
Thank you for taking the time to share with us. Skeptical Science is a user forum wherein the science of climate change can be discussed from the standpoint of the science itself. Ideology and politics get checked at the keyboard.
Please take the time to review the Comments Policy and ensure future comments are in full compliance with it. Thanks for your understanding and compliance in this matter. Note the prohibition of accusations of fraud and the requirement to be on topic. If you dont like how records are adjusted for station shift, TOB bias, instument change etc, then state where the methodology is flawed and back your argument with data/references.
In particular please take the time to investigate what science really does say rather than repeating long-debunked myths. The Search function at the top is great place to start. Questions are welcome (when on topic) so long as you want to hear the answer.
-
Digby Scorgie at 11:52 AM on 28 January 2017Joint Statements on Climate Change from National Academies of Science Around the World
Um, the blue poster at the top should say "Science tells us so".
-
sjames0101 at 06:19 AM on 28 January 2017How much does animal agriculture and eating meat contribute to global warming?
Its always easy to discard evidence like Teague by appealing to unkowns and the impact of poorly studied modifiers. But I would rather trust robust studies like I cited that looked at hundreds of sites rather than aneqdotes or the fag packet calculations of people with so much vested interest that they are willing throw away all the evidence that disagrees with their point of view because of there own bias. Industry funded studies are so open to bias that they are often not worth the paper they are writen on.
-
David Kirtley at 03:01 AM on 28 January 2017From the eMail Bag: Abrupt Climate Change in Greenland's Past?
Ubrew12,
Your scenario is one of the possible causes of the beginning of the Younger Dryas. See this post: Catching up with the Younger Dryas
There was a recent paper on this: Overlooked possibility of a collapsed Atlantic Meridional Overturning Circulation in warming climate, Liu, et al DOI: 10.1126/sciadv.1601666 And a write-up on it at Real Climate: The underestimated danger of a breakdown of the Gulf Stream System.
Yes, definite repercussions for our future.
-
Lachlan at 12:39 PM on 27 January 2017We may be closer than we thought to dangerous climate thresholds
The main thing that concerns me about this articl is that it ignores climate intertia. It seems to be quibbling about a few tenths of a degree, whereas the equilibrium temperature for our current GHG concentrations is much higher than the current temperature. (I have no idea how much higher — that is what I would have hoped the article would tell us :)
-
Digby Scorgie at 09:48 AM on 27 January 2017We may be closer than we thought to dangerous climate thresholds
What was the zero point that the experts used in arriving at their judgement that warming should not exceed 1.5 to 2 degrees?
-
ianw01 at 09:41 AM on 27 January 2017We may be closer than we thought to dangerous climate thresholds
[Within the portion here at SkS, there is a paragraph missing compared to the the Guardian site. It is right before the para "Prior to this publication,..."]
On the substance of the article, I'm uneasy with the logic presented. It seems we have a carefully considered limit to warming determined by experts, and then quite independently, and after the fact, we need to go about determining the pre-industrial baseline to discover how we are doing. That seems to imply that the limits are based on relative changes from an (initially) unknown value, and not based on absolute temperatures nor based relative to known data points in the last few decades.
Is that really the correct logic? Perhaps the nature of the changes requires that we benchmark against an uncertain past, but it also seems to imply the expert-set limits do not include an assessment of impacts connected to known temperatures.
-
FrankShann at 08:58 AM on 27 January 2017We may be closer than we thought to dangerous climate thresholds
For "A Better Graph" with 1880-1920 base period by James Hansen and Makiko Sato, see A Better Graph.
To convert NASA GISS anomaly base 1951-1980 to base 1880-1920, add 0.27 degrees C.
-
william5331 at 05:16 AM on 27 January 2017From the eMail Bag: Abrupt Climate Change in Greenland's Past?
If we were to take all the necessary measures and avoid a disastrous climate change, the denialists would say it was all nonsense and revive business as usual. If we let things go, we will likely cause ourselves a series of serious disasters. We almost need some mid level disaster that is sufficient to get the attention of the deniers. I wonder if one will occur before it is too late.
-
ubrew12 at 04:49 AM on 27 January 2017From the eMail Bag: Abrupt Climate Change in Greenland's Past?
Is is possible during the warming period, so much fresh water suddenly entered the North Atlantic it shut down the AMOC? Perhaps this would plunge the Northern Hemisphere back into an mini-glacial period until such time as all the fresh water was discharged, and the AMOC could rebuild itself. If this is the scenario, it could have repercussions for our future.
-
John Hartz at 04:16 AM on 27 January 2017We may be closer than we thought to dangerous climate thresholds
Recommended supplemental reading:
How the World Passed a Carbon Threshold and Why It Matters by Nicola Jones, Yale Environment 360. Jan 26, 2017
-
alan cannell at 23:57 PM on 26 January 2017So what did-in the dinosaurs? An update.
An overlooked factor in this late K extinction event is the loss of atmospheric pressure that began at the end of the K superchron and would have been enhanced with the Chicxulub event. The isotope data from amber (Tappert 2013) indictes that the air pressure in the Upper K was about 1.7 times the present - N15 records also indicate a loss of N2 during the geomagnetic reversals. Certainly all proxy CO2 values that relate to temperature should be quoted as "ppm equivalent at 1 bar" and not simply ppm, as molecular pressure is, of course, a function of air density.
This is presented at length on Researchgate under "Giant Bugs, Martian Air, Pterosaurs and Ice Ages" .
BTW
The Deccan traps pale incomparison to the basalt flows in the pacific plateuax during the K and Eocene/Miocene periods: a probable source for the apparent increase in N2 and possibly for CO2.
Moderator Response:[PS] It really helps discussion if you provide a proper citation for papers (like Tappert 2013) or better still, use the link tool to access a public copy. Is this the one you mean? I have added a link to the researchgate paper, but please learn how to do this yourself with the link tool in the comment editor.
-
scaddenp at 09:38 AM on 26 January 2017We’re now breaking global temperature records once every three years
I think that is really the wrong question. Year to year it is just weather. What matters is trend, and trend over a 20-30 year period if you are talking about surface temperatures. That is what the climate models really predict. If you want to talk about shorter time periods, then need to look at something less noisy that surface temperature. Ocean Heat Content for instance.
-
Richard McGuire at 09:32 AM on 26 January 2017We’re now breaking global temperature records once every three years
I have no scientific qualifications, but have keenly followed the debate over many years, from the hockey stick to the hiatus debate. Have watched and engaged climate change deniers who have cherry picked temperature data, especially UHA and RSS satellite data. The climate change debate remains highly politically charged. Which is why temperature data that is comprehensible to the media and public at large is so critical. So 2016 was warmer than 2015. The next obvious question is by how much ? Debates about margins of error and which of half a dozen temperature data sets is closer to the mark is unlikely to cut through in the wider world.
-
Daniel Mocsny at 06:35 AM on 26 January 2017We’re now breaking global temperature records once every three years
Richard McGuire @7: in terms of what the average person needs to know, consider the analogy of investing for retirement. Some investment advisors tell their clients not to check the value of their portfolios every day, but rather to trust in the market fundamentals that guide an advisor's long-term investment strategy for the client. Stock prices fluctuate randomly from day to day and year to year, but all that really matters for the buy-and-hold investor is the long-term performance.
Our present response to the future threat of climate change does not depend on knowing precisely how much hotter the global average surface temperature was in 2016 over 2015. In the year 2050 nobody will care about that. Since we only have one available planet to inhabit, we are all long-term investors in its future. The average person needs to focus on the fundamentals, not the noise.
The challenge is to persuade people to give up something that gives them real, tangible value now, to avoid causing abstract harm to other people and other species in the future. For example, if someone takes a holiday flight to Cancun or Tahiti, s/he experiences undeniable and immediate hedonic rewards. The several tonnes of carbon dioxide equivalent s/he dumps into the atmosphere to get those rewards will go on incrementally heating the climate system for centuries.
It's similar to smoking cigarettes for short-term hedonic reward, except that with greenhouse gas pollution, it's like smokers giving cancer to someone else they've never met.
There's no way to mask this moral quandary with any combination of policies or rhetoric. To avoid wrecking the future, people today must change their values drastically, to get the average per capita carbon footprint below the globally equitable emission allowance. The rise of Trump reflects the average person's refusal to do this. Trump represents the interests of everyone who wants to keep flying to Cancun - or to a scientific conference, for that matter (instead of figuring out how to virtualize the conference).
Even in the liberal enclaves of California, Oregon, etc. nobody is shutting down the highways and airports. Given that a single long return flight causes a whole year's worth of allowed emissions for one person (leaving nothing for other activities such as eating), we can't have any flying if we want to stabilize the climate. We need many other equally drastic adjustments, but I focus on flying because it is one of the most egregious, least necessary, and least equal ways in which humans assault the climate. Flying is a good test case of our seriousness about mitigating climate change. It will be much harder to cut emissions from things everybody needs, such as agriculture.
The level of response we need isn't going to be motivated by figuring out whether last year was 0.12°C or 0.04°C hotter than the year before. By analogy, imagine trying to abolish lynchings or stonings by determining whether the victim dies in 345.4 seconds or 345.7 seconds. The only way to durably eliminate lynchings and stonings is to persuade people that participating in them is morally unacceptable. As Trump is showing, merely passing laws accomplishes nothing that the next election cycle can't destroy.
-
Tom Curtis at 13:06 PM on 25 January 2017We’re now breaking global temperature records once every three years
Richard McGuire @14, you are being inconsistent. You point to an article which claims that uncertainties are important (they are), and that consequently 2014 was not the hottest year todate as of the end of 2014, but a statistical tie with two other years for that title. But then you insist that the four observed 2016 values from my post @6 are different, even though they are within uncertainty of each other, and will within uncertainty of the mean value. If Walker's article on 2014 has merit, as you suggest, then the four records are effective replications of each other.
This is more obvious when the full overlapping record is shown:

(Source)
Indeed, quite independent of the merit's or Walker's article, replication cannot achieve an accuracy greater than measurement error. It may happen by coincidence that two values from different observations are identical, but that is no more significant than if they were further appart, but within error. That is because we do not know the observed value any more accurately than the limits of measurement error, so exact coincidence my be pure coincidence. But two values falling within measurement error of each other counts as a replication because, with the information to hand the real, underlying value may well coincide, with the difference between observations being down to error. Indeed, as examples from other sciences show, particular obserations may lie outside measurement error, and still count as a replication provided they are one of a set of observations that progressively (but not monotonically) close on a particular value. That is because we can also be in error about the magnitude of the measurement error.
So, with that in mind, I will note that while Walker's more general point about the need for more scientifically accurate reporting is correct, it is not correct to claim that 2014 did not hold the temperature record as of Jan 2015. That is because records, in all fields of endeavour, are based on nominal values, without concern about uncertainties. Put simply, 2014 was the warmest year on the record, but the record is known to be slightly inaccurate due to uncertainty, so that the warmest year on record may not be the actual warmest year.
-
RedBaron at 12:04 PM on 25 January 2017How much does animal agriculture and eating meat contribute to global warming?
Unfortunately seems Trump may be also shutting down research in this promising area as well. It was part of the same gag order imposed on the EPA.
Trump silences government scientists with gag orders
Employees at Environmental Protection Agency and Department of Agriculture are affected"After this story went to press, the department disavowed the memo sent to employees in the Agricultural Research Service — the USDA’s science arm. The USDA’s deputy administrator Michael Young clarified in a follow up memo that the gag order specifically applies to policy-related statements in press releases and interviews, which need to be vetted with the secretary of agriculture."
Hard to believe it actually. Almost like a book burning from ages past. I am still stunned. But at least for now it appears any and all attempts to mitigate AGW in any sector; energy, agriculture, environment, will be squashed by Trump. Considering our best bet is to attack the problem from all three, this looks bad. Really really bad.
-
Richard McGuire at 10:42 AM on 25 January 2017We’re now breaking global temperature records once every three years
Tom Curtis @8 "That four different methods using different (if significantly overlapping) data produce the same results shows the result to be robust" With due respect Tom the only same result produced was that 2016 was warmer than 2015, therefore the warmest year on record. By how much is open to debate. Does this matter ? In some cases, such as in 2014 it does. This article that appeared on the ABC's Drum in 2015 may help explain my point better www.abc.net.au/news/2015-02-13/walker-was-2014-the-hottest-year
-
Tom Curtis at 06:27 AM on 25 January 2017We’re now breaking global temperature records once every three years
jdixon1980 @9, perhaps what you are looking for is something like the World Meteorological Organization's press release on 2016 temperatures. They state:
"The globally averaged temperature in 2016 was about 1.1°C higher than the pre-industrial period. It was approximately 0.83° Celsius above the long term average (14°C) of the WMO 1961-1990 reference period, and about 0.07°C warmer than the previous record set in 2015.
WMO uses data from the US National Oceanic and Atmospheric Administration, NASA’s Goddard Institute for Space Studies and the UK’s Met Office Hadley Centre and the University of East Anglia’s Climatic Research Unit. WMO also draws on reanalysis data from the European Centre for Medium Range Weather Forecasts and the Copernicus Climate Change Service, which use a weather forecasting system to combine many sources of data to provide a more complete picture of global temperatures, including in Polar regions."
And later:
"Notes to Editors
Global temperature anomalies are computed using three global datasets: HadCRUT4, jointly produced by the Met Office Hadley Centre and the Climatic Research Unit at the University of East Anglia, United Kingdom; the GISTEMP analysis (2016 version), produced by the National Aeronautics and Space Administration Goddard Institute for Space Studies (NASA GISS); and the NOAA Merged Land Ocean Global Surface Temperature Analysis Dataset (version 4.0), produced by NCEI. WMO also uses European Centre for Medium Range Weather Forecasting ERA-Interim reanalysis data. Copernicus ECMWF press release available here. Differences between the datasets arise largely from the way that the data-sparse polar regions are handled. There is a margin of uncertainty of +- 0.09 °C in the anomaly value.
A number of definitions exist for the pre-industrial period, the most commonly used being 1850-99 and 1880-99. The value of 1.1 °C is valid (to the nearest 0.1 °C) whichever of these periods is chosen."
For completeness, the ERA (ie, the European Centre for Medium Range Weather Forecasts and the Copernicus Climate Change Service) data is a reanalysis product. That is, it is produced by running a climate values with cell values slaved to observed values were known, which allows a prediction of unobserved values. It showed global temperatures to be nearly 0.2 C greater than 2015.
I am not sure how they derive the 0.07 C figure. It is too high to be the simple mean of the three observationatal values (which rounds up to 0.06 C), and too low to be the simple mean of the three observational plus ERA interim records (0.09 C). For the record, the simple mean of the four observational records including BEST rounds down to 0.06 C.
-
william5331 at 04:46 AM on 25 January 2017We’re now breaking global temperature records once every three years
And now the rich and super rich are trying to buy up bolt holes in New Zealand to escape the chaos they have caused. It would be interesting to research, from the America side, which of these paragons of virtue are trying to prepare a place where they can escape the mess they have caused. They have caused the ship to sink and now they want preference in the life boats.
-
howardlee at 03:18 AM on 25 January 2017So what did-in the dinosaurs? An update.
martin - no that's not a typo. From Clyde et al:
"Using the median sediment accumulation rate of 142 yrs/cm ... indicates that the ∼0.6 cm ... in stratigraphic thickness between the top of the K–Pg boundary layer and the peak in fern spore abundance... represents ∼85 yrs and the ~6cm thick recovery interval after the initial peak in fern abundance lasted ∼850 yrs, suggesting the entire fern spike occurred over ∼1000 yrs."
Theres more detail and discussion of uncertainty in the paper, but no it's not a typo.
-
jdixon1980 at 03:02 AM on 25 January 2017We’re now breaking global temperature records once every three years
My comment @10 is of course not for Dana's benefit, who knows this a lot better than I do, but for visitors to the site.
-
jdixon1980 at 02:59 AM on 25 January 2017We’re now breaking global temperature records once every three years
"The latest IPCC report stated with 95% confidence that humans are the main cause of global warming since 1950, and most likely responsible for 100% of that temperature rise."
I would add here (Dana correct me if I am wrong) that the precise meaning of the statement is that humans are most likely responsible for at least 100% of that temperature rise. As phrased in the article, the average person might interpret 100% as the physical maximum humans could have contributed. However, I understand that not to be the case, as the human contribution would be more than 100% of the temperature rise if the aggregate impact of natural forcings (TSI, ENSO, volcanic activity etc.) would have been a temperature decline, but human activity more than made up for those factors. And if we parse out GHG emissions from other human contributions, we could add aerosols to the list of forcings with a cooling tendency, which were overcome by human GHG emissions and anything else on the warming side.
-
jdixon1980 at 02:42 AM on 25 January 2017We’re now breaking global temperature records once every three years
Richard McGuire @7 and Tom Curtis @8, it seems to me that the spirit of what RM is suggesting is not necessarily to scrap replication, but for someone to distill the conclusions in a way more digestible by the average person.
In that regard, would it be feasible (and meaningful) for the groups' results to be synthesized in some way, to produce a quantitative "best estimate" of average surface temperature derived from the four (or however many) primary estimates, taking into account differences in their respective methodologies when determining how best to combine them? Each of the four independent "products" could still be reported, in addition to an aggregate/synthesized "product".
As I (by no means an expert on climate science, physical measurement, or statistics) write and edit and re-edit this question, feeling the need to pack in more and more parentheticals and qualifiers as I go, I become more and more convinced the answer is surely no. I suspect the task of combining the products in a meaningful way would be monumental, and at the end it would produce a result with no coherent methodology behind it, sort of divorcing the number from the physical quantity it represents. It seems better to keep each curve separate, perhaps presenting them on a single graph and explaining how scientists interpret any apparent differences, as is essentially being done by honest and diligent climate news sources.
Another thing, whatever group took the four temperature curves and synthesized them into one sounds an awful lot like the IPCC, and as such we already know would be looked upon by deniers with great suspicion as part of a massive global conspiracy.
-
Tom Curtis at 18:55 PM on 24 January 2017We’re now breaking global temperature records once every three years
Richard McGuire @7, I disagree. The most important thing in science is replicability. The different temperature products represent four different replications of the same measured quantity. That four different methods, using different (if significantly overlapping) data produce essentially the same result shows the result to be robust. Where they to cooperate by using precisely the same data and precisely the same method, the different "products" might represent audits of each other, but they would not be replications. In scientific terms, they would be of no greater interest than if their were just one team, with no replication.
As to joint press releases, ie, cooperating when they release the data, GISTEMP and NOAA already do hold joint releases, but the other teams are not US government agencies and should not be expected to do so. Further, how far would this cooperation need to extend. Would we need the (very infrequently cited) Japanese version? What about the 5 or 6 odd versions put out by private individuals?
If you actually look at the media statements by the respective groups, they tend already to indicate why there are major divergences between the groups (if there is). They also tend to indicate the uncertainty. What we need is an expectation that the press report those relevant details, rather than that the scientists should self censor.
-
Richard McGuire at 15:06 PM on 24 January 2017We’re now breaking global temperature records once every three years
Thank you for the information Tom Curtis. However given how politically charged the Climate Change issue is, and with the Trump administration poised to set any global progress in mitigation back decades I don't think it is good enough. If the GISSTEMP's, NOAA's and HadCRUT's can't collaborate on their temperature data collection, maybe they could co-operate when it comes to releasing such important information to the media. As things stand it is confusing. Contradictory information gets out there, GISTEMP's 0.12 c verses HadCRUT's 0.013 c. The average person out there has no idea who has the most Arctic weather stations, nor should they need to know. Must somehow do better.
-
RedBaron at 13:53 PM on 24 January 2017How much does animal agriculture and eating meat contribute to global warming?
Moderator,
Well I wrote this: Holistic management (agriculture)
and this: Can we reverse global warming?
And I have many educational videos here:
Red Baron FarmModerator Response:[PS] thanks for those. Please use them.
Prev 415 416 417 418 419 420 421 422 423 424 425 426 427 428 429 430 Next


