


 Arguments


Recent Comments
Prev 417 418 419 420 421 422 423 424 425 426 427 428 429 430 431 432 Next
Comments 21201 to 21250:
-
Tom Curtis at 22:53 PM on 18 January 2017Increasing CO2 has little to no effect
MA Rodger @226, I consider the Downing quote to be a misquotation based on the fact that the selection shown in the search result shows the phrase "one has to free oneself" preceding the phrase "we redistribute", ie, the reverse of order in the actual quote. That may be a coincidence, but that is unlikely. Further, a fuller search string pushes Downing's book much further down the results (if it appears at all), which suggests Downing cannot have quoted the full passage verbatim.
-
MA Rodger at 22:34 PM on 18 January 2017Increasing CO2 has little to no effect
Concerning the fraudulent Ottmar Edenhofer quotation reproduced @211.
The quote appeared to be presented verbatum (bar a "..."?) in Simon Downing (2011) "World Empire and the Return of Jesus Christ." p338? (I note Tom Curtis @212 suggested the quote in this source was not identical to that presented @211. Sadly the google review I link to has limited personal useage so I cannot double-check.) The quote appears in the book as a referenced quote but unfortunately the page setting out this reference #1061 (page 515) is not available in the google review available. Or that was the message I took away before I overstayed my personal welcome in the google review. It would thus take a sight of p515 to be sure this was the source of the fraud, so if anyone has a copy of this book on their bookshelf....
-
Increasing CO2 has little to no effect
Note: My post #224 was a response to #222.
-
Increasing CO2 has little to no effect
"Atmospheric CO2 is relatively constant worldwide, in very dramatic contrast to water vapor. This clearly refutes the "water follows CO2" claim."
Why does the water vapour fluctuate so much while CO2 doesn't?
Because the local temperature sets an upper limit (but not a lower!) to how much water vapour the local atmosphere can hold.
CO2 and other forcings (including the Sun) control the global temperature and therefore the global amount of water vapour, which act as a strong climate feedback. The strong temperature dependency of water vapour also explains why its concentration drops so rapidly with altitude. If it didn't, but was a well-mixed gas like CO2, its warming impact would be so strong that the Earth would be inhabitable to all higher forms of life.BTW, the atmosphere as a whole contains about 4000 ppm of water vapour, not 15,400 as figure 2 in your post #209 claims.
Moderator Response:[PS] RM also fails to notice that most of the planet is covered by water.
-
RenaissanceMan at 12:30 PM on 18 January 2017CO2 is coming from the ocean
Natural sources of carbon dioxide were reported to be 770,000 metric tons by the IPCC in 2001. http://www.eia.gov/oiaf/1605/archive/gg04rpt/pdf/tbl3.pdf
This far surpasses the anthropogenic output.
Moderator Response:[PS] Conveniently ignoring natural sinks as well available from same source. In short, more rhetoric and not addressing pH, isotopic composition of CO2 in atmosphere, O2 changed raised here. Your response is yet another myth debunked here.
-
RenaissanceMan at 12:23 PM on 18 January 2017Increasing CO2 has little to no effect
[PS]@217
"The numerous text books and guides on scientific graphing do not support your argument. Provide a reference which does. Inappropriate scales instead are the common tools of misinformation."
Reference follows:
Population Explosion

Lay public can easily be misled by graphs which appear to show rapid changes, which when subjected to more thoughtful, more professional analysis, are not rapid changes at all. For example, 1.36 parts per million increase in atmospheric carbon dioxide, over the last fifty years, is an extremely small annual change on the basis of 15,500 parts per million of total greenhouse gas.
Moderator Response:[PS] The point of graphing is illustrate the data to maximum effect in the context. What is "insignificant" cannot be read from a graph - it can only be determined in larger context. A doubling of CO2 add nearly 4W/m2 to earth surface radiation and in climate terms that is significant. See myth "CO2 is insignificant trace gas". Please look at water vapour question at the link provided.
We have a large list of myths. See "arguments" on top left. Please read and be prepared to provide evidence in support of arguments before simply mindlessly repeating yet another one.
At moment, your discourse is sloganeering (repeating long debunked myths, assertions without backing), inflammatory tone, and frequently offtopic. Please pickup up your act.
-
RenaissanceMan at 12:05 PM on 18 January 2017Increasing CO2 has little to no effect
HK @218:
#215:
"CO2 is the thermostat that sets where the concentration of water in the atmosphere is. Water follows the CO2."Indeed!
Andrew Lacis et al did a model experiment where they removed all the greenhouse gases in the Earth’s atmosphere except for water vapour."Response: Atmospheric CO2 is relatively constant worldwide, in very dramatic contrast to water vapor. This clearly refutes the "water follows CO2" claim.
The claim of a "model" which spans a fifty year time span must be suspect because past models have done so very poorly at prediction of temperature changes.
The great deserts of our planet are not dry because there is no CO2 present across them. Nor are the wettest parts of the planet located at high CO2 environments. Indeed!
Moderator Response:[JH] Sloganeering snipped. Sloganeering is prohibited by the SkS Comments Policy.
Warning #1
Please note that posting comments here at SkS is a privilege, not a right. This privilege can be rescinded if the posting individual treats adherence to the Comments Policy as optional, rather than the mandatory condition of participating in this online forum.
Please take the time to review the policy and ensure future comments are in full compliance with it. Thanks for your understanding and compliance in this matter.
-
scaddenp at 10:35 AM on 18 January 2017Fact Check: Rex Tillerson on Climate Risks
Paul D There is some evidence of ocean warming weakening the ice shelf from below (eg this paper) with Pine Island and this paper on Larsen ice shelves. I would guess similar situation with Brunt. As to when it will calve, then I think it would be a brave man that made any bets on that.
-
Tom Curtis at 08:02 AM on 18 January 2017Increasing CO2 has little to no effect
RM @210, claims that "Degassification is a primary natural source of carbon dioxide. It leaves the ocean, rather than dissolving in it." That contrasts with the findings Sabine et al (2004) who find that:
"The global ocean inventory estimated here permits us, for the first time, to place observational constraints on the anthropogenic CO2 budget for the anthropocene. In particular, it permits us to estimate the magnitude of the time integrated terrestrial carbon balance which cannot be easily deduced from observations. We first consider the anthropogenic budget terms that are relatively well constrained. Over the anthropocene, about 244±20 Pg C was emitted into the atmosphere as a result of the burning of fossil fuels and cement production. About two thirds of these emissions have remained in the atmosphere, increasing the atmospheric CO2 concentration from about 281±2 ppm in 1800 (20) to 359±0.4 ppm in 1994 (21) translating to an increase of 165 Pg C. Subtracting our ocean inventory estimate of 118±19 Pg C and the atmospheric inventory change from the integrated fossil fuel emissions constrains the net carbon balance of the terrestrial biosphere to be a net source of 39±28 Pg C for the period between 1800 and 1994.Therefore the ocean has constituted the only true net sink for anthropogenic CO2 over the last 200 years. Without this oceanic uptake, atmospheric CO2 would be about 55 ppm higher today than what is currently observed (~370 ppm)."
This is one of a large number of similar studies with similar findings. Against these evidence based, peer reviewed studies, RM provides only the evidence of his own assertion (again).
Moderator Response:[PS] The "CO2 is from the ocean" myth is debunked in this article.
RM - if you disagree with the evidence presented there, then present your evidence on that thread and not here.
-
Tom Curtis at 07:43 AM on 18 January 2017Increasing CO2 has little to no effect
RM @214 objects to my aside about his name. For his information, I have the evidence of his posts on Skeptical Science of a massive incompetence when it comes to climate science that clearly disprove any claim he has to a broad competence across most fields of human intellectual and artistic endeavour, ie, to be a renaissance man. Of course, he can disprove my comment by naming any two academic fields to which he has made a significant contribution - with full citations of at least one peer reviewed paper in each. Or an academic field with citation to peer reviewed paper and refer his notable contribution to one of the arts - with evidence. The purported anonomous endorsement of a person of unknown competence is no evidence to his vaunting claim at all.
A case in point, as regards his incompetence in climate science is his claim @209 regarding the proper usage in scientific graphs, where he says that the Keeling Curve "... is blatantly dishonest ..." in part because "... it does not have a zero base". In fact scientific practise does not require the inclusion of the zero base as is easilly checked by looking at scientific websites such as the Laboratory of Atmospheric and Space Physics (LASP) at the University of Colorado, whose page on Total Solar Irradiance includes three graphs (the first of which is shown below), with lowest values on the y-axis of 1360.7, 1357, and 1360 W/m^2 respectively.

Or at scientific papers such as "Effects of freshwater and saltwater adaptation and dietary salt on fluid compartments, blood pressure, and venous capacitance in trout" which shows as figure 2, a graph with three parts, only one of which shows zero as the lowest value on the y-axis:

The reason for the practice of excluding the origin is simple. Graphs are intended to succintly display data. To do so they must be readable, and often including the origin will make that impossible by so compressing the display of the variation as to make it invisible. (Indeed, making the variation invisible is clearly RM in his second graph @209.)
So, not only is RM wrong about graphs - he is demonstrably wrong. Worse, he would be known to be wrong by anybody familiar with scientific literature (as opposed to the anti AGW pseudoscience sites that are obviously his main source of information). His compelling argument in favour of his view @217 that "No, you [ie, Michael Sweet] are mistaken" carries, in the end, no evidentiary weight.
Moderator Response:[PS] Enough. Stick to the topic
-
michael sweet at 06:19 AM on 18 January 2017Increasing CO2 has little to no effect
Renaissance Man,
The default setting on Excell is to fill the page with the graph and not show the zero. Why would it be the default setting if it were incorrect? Are you suggesting Microsoft programmers do not know how to make a graph? You are obviously not familiar with making graphs of data (I worked in industry for 20 years and had to send graphs to the USFDA. The FDA requires you fill the page with the data.) I used Denial Depot to make my point that your claim that the zero has to be included is incorrect. Dr. Inferno shows what that argument leads to.
If there were no CO2 in the atmosphere it would get colder. That would cause the water to rain out. Less water would make it even colder. In the end all the water would rain out and the Earth would freeze. The CO2 controls how much water evaporates into the atmsphere. The water is not independent of the CO2. Water concentration is controlled by the CO2 concentration.
At the top of the atmosphere, where the greenhouse effect causes it to get warmer, there is very little water vapor. It is too cold and the water rains out. CO2 does not rain out, it is stable as a gas at low temperatures. You need to regraph your data showing the CO2 and water concentrations at about 6km above the surface. You will find that the CO2 determines the amount of heating from the greenhouse effect.
This data is posted elsewhere on Skeptical Science. If you ask for new information I will help you look it up. When you make baseless claims it is not worth the effort.
I will not post again on this thread. Comments like these just gum up the board.
-
Increasing CO2 has little to no effect
#215:
"CO2 is the thermostat that sets where the concentration of water in the atmosphere is. Water follows the CO2."Indeed!
Andrew Lacis et al did a model experiment where they removed all the greenhouse gases in the Earth’s atmosphere except for water vapour.
The end result was something close to snowball Earth conditions, with a global temperature dropping to about -20°C, far colder than any ice age has been since the late Precambrian. Most of this cooling was caused by feedbacks like increased albedo and the loss of 90% of the water vapour.
This figure from the paper shows how the temperature and other parameters changed during the experiment.
-
RenaissanceMan at 06:00 AM on 18 January 2017Increasing CO2 has little to no effect
michael sweet@215:
"Denial Depot has an entire post on how Skeptical Science adjusts graphs like you state. Perhaps you can elaborate on how the CO2 graph should be made. Of course, it is a sham science site, but it has funny stuff."
1. How is it that you can make fun of the opposition here, but nobody is permitted to make fun of your theories and hypotheses? The moderator(s) would quickly come down on anyone daring to call climate change "sham science."
[PS] The moderator would come down quickly on accusation of fraud but not on arguments against arguments that are backed in scientific way.
2. I just posted the proper graph, which of course includes water vapor, the dominant greenhouse gas. The resultant greenhouse gas "curve" is about as flat as a pool table.
"I teach Science in High School and College and if a student were to submit the CO2 graph with zero in the Y axis I would take off points because they did not fill the page with their graph."
Because you teach in such a manner does not remotely make it right. I have never heard of such a trivial argument as "fill(ing) the page" with a graph. How about writing bigger! That should be neat. I repeat, the objective is information and its clear communication. Perspective is an essential component of communication.
"You are mistaken with your assertion that the zero has to be included."
No, you are mistaken when you assert that a page must be filled with a graph, and when you clearly believe that exaggeration is meaningless.
[PS] The numerous text books and guides on scientific graphing do not support your argument. Provide a reference which does. Inappropriate scales instead are the common tools of misinformation. A simple example would be to plot temperature over last 1million years in Kelvin and insist on graph starting at zero. This gives a flat line for all intents and purposes so ice ages arent significant right?
"CO2 is the thermostat that sets where the concentration of water in the atmosphere is. Water follows the CO2."
You should not be teaching science. You don't understand the vapor pressure/temperature relationship at all. Water doesn't "follow" CO2 or air. It really can exist independently, as a function of temperature and pressure.
Prev 1 2 3 4 5
Moderator Response:[PS] This discussion is skirting the edges of comments policy by both sides. Would everyone please read the policy and stick to the science.
The main "substance" of RM's argument is that about water vapour. This myth is addressed in this article. Please read the article and comment there. Followups to RM on water vapour go there too.
RM - please state your arguments in a line scientific way and keep the rhetoric for the public bar. By this, I mean you need to start backing your assertion with references. Starting with "You don't understand the vapor pressure/temperature relationship at all." in the appropriate thread.
Ideally you quote and reference the science paper or IPCC statement you disagree with, why you disagree and provide data/references to back it. Start with why you think the science has it wrong on Clausius-Clapeyron.
-
Tom Dayton at 05:58 AM on 18 January 2017Increasing CO2 has little to no effect
Renaissance Man, you claimed: "As to CO2 being "forcing," infrared radiation is absorbed by water vapor and by carbon dioxide in virtually identical spectra, which I shall not bother to reproduce here."
You were incorrect on two counts:
1. CO2 increase indeed is a forcing, but water vapor increases are a feedback to warming, not a forcing, as Michael Sweet pointed out to you. Read the post "Explaining how the water vapor greenhouse effect works"--first its Basic tabbed pane, then its Intermediate tabbed pane. If you want to argue/discuss/query further on that topic, do so in the comment thread on that post, not this one.
2. CO2 and H2O absorption do not entirely overlap. From physicist and historian Spencer Weart's "Discovery of Global Warming":
The early experiments that sent radiation through gases in a tube, measuring bands of the spectrum at sea-level pressure and temperature, had been misleading. The bands seen at sea level were actually made up of overlapping spectral lines, which in the primitive early instruments had been smeared out into broad bands. Improved physics theory and precise laboratory measurements in the 1940s and after encouraged a new way of looking at the absorption. Scientists were especially struck to find that at low pressure and temperature, each band resolved into a cluster of sharply defined lines, like a picket fence, with gaps between the lines where radiation would get through.(24) As Hulburt and Callendar had claimed, the most important CO2 absorption lines did not lie exactly on top of water vapor lines. Instead of two overlapping bands, there were two sets of narrow lines with spaces for radiation to slip through.
You should read more from that source, after that passage.
-
Paul D at 05:40 AM on 18 January 2017Fact Check: Rex Tillerson on Climate Risks
On the issue of Rex Tillerson, the Channel 4 (UK) Dispatches documentary (link below, although not sure what availability is outside the UK) suggests that the coal industry in the US is a bigger issue. I found the programme disturbing. Tillerson is also discussed in the programme.
President Trump's Dirty Secrets
Can't help thinking there are parrallels between Donald Trump and Damien in The Omen series of movies.
Damien Trump anyone !? -
Paul D at 05:30 AM on 18 January 2017Fact Check: Rex Tillerson on Climate Risks
What is the opinion of commentors of this event?
Ice crack to put UK Antarctic base in shut-down
Is the second crack at the Brunt ice shelf an indication of warming and that the shelf is likely to break up sooner than thought?
The scientists seem to suggest the risks are marginal, but they are not taking any risks just in case. -
Ravenken at 04:10 AM on 18 January 20172017 SkS Weekly Climate Change & Global Warming Digest #2
+Eclectic... got that right... sad part is, we need global dimming or... :-/
-
michael sweet at 04:08 AM on 18 January 2017Increasing CO2 has little to no effect
Renaissance Man,
Denial Depot has an entire post on how Skeptical Science adjusts graphs like you state. Perhaps you can elaborate on how the CO2 graph should be made. Of course, it is a sham science site, but it has funny stuff.
I teach Science in High School and College and if a student were to submit the CO2 graph with zero in the Y axis I would take off points because they did not fill the page with their graph. You are mistaken with your assertion that the zero has to be included. Read the linked post to see how your argument looks carried to its logical conclusion.
CO2 is the thermostat that sets where the concentration of water in the atmosphere is. Water follows the CO2.
-
RenaissanceMan at 03:45 AM on 18 January 2017Increasing CO2 has little to no effect
Tom Curtis@212:
"The misnamed RenaissanceMan...."
I could have sworn I read rules for this forum that ad hominem attacks were forbidden. Obviously that restriction does not apply to the "97%."
Tom Curtis has not the slightest basis for claiming that my good friend, who has known me very well for many years "misnamed" me. Tom has no basis; my good friend has a very broad and familiar basis indeed.
""Basically it's a big mistake to discuss climate policy separately from the major themes of globalization. The climate summit in Cancun at the end of the month is not a climate conference, but one of the largest economic conferences since the Second World War. Why? Because we have 11,000 gigatons of carbon in the coal reserves in the soil under our feet - and we must emit only 400 gigatons in the atmosphere if we want to keep the 2-degree target. 11 000 to 400 - there is no getting around the fact that most of the fossil reserves must remain in the soil."
1. Do conventions at Cancun, and Davos Switzerland, and at expensive resorts all around the world, widely attended at taxpayer expense, with not just dozens, not just scores, but hundreds of private jets arriving to deliver those who claim we must all cut back on fossil fuel useage advance this essential objective of keeping fossil fuels in the ground?
2. Do the habits of such people as Barack Obama, and Al Gore, and all the Hollywood rich and famous flying everywhere in private jets, riding on their large yachts keep fossil fuels in the ground, and advance the demand that we cut back fossil fuel use by some 80%/
3. Why does every conceivable magazine which supports the 97% feature countless advertisements for foreign travel, from Sierra, to National Geographic, to Audubon, to all of them?
4. Increasingly onerous restrictions, fees, cap and trade, and other actions drive up the cost of electricity and travel for even the poorest people worldwide. President Obama even bragged that his policies would double the cost of electricity. How can anyone support these reprehensible actions? People in Haiti resorted to eating dirt pies after the cost of corn skyrocketed due to its demand for ethanol.
5. "Ecotour" - a one-word oxymoron, an indefensible pretense.
-
RenaissanceMan at 03:30 AM on 18 January 2017Increasing CO2 has little to no effect
MARoger@211:
[snip]
"The choice of vertical scale on a graph of CO2 concentrations is hardily science. "
The root word for science is "scientia," Latin for knowledge. An essential component of knowledge is the accurate and honest presentation of such knowledge. The choice of presenting data to skew the slope of a graph can be demonstrated by a graph of a population explosion with a base of 1,000,000 and a top at 1,000,001, sharply sloping upward.
"And the relative position of a red line on a piece of paper does not determine the contribution of CO2 on global climate forcing. The atmospheric levels of CO2 presented on both of your graphs is roughly consistent (you appear to plot CO2 some 50ppm too high on the lower graph) and it is atmospheric levels which determine forcing."
As to CO2 being "forcing," infrared radiation is absorbed by water vapor and by carbon dioxide in virtually identical spectra, which I shall not bother to reproduce here.
"Yet you accuse the Keeling Curve of having an "unscientific nature." Have you any reason for such a claim? Setting out your claims in scientific terms would be the proper thing to do, if you are able."
I explained the etiology of the word "science" above, and for many I suspect this is their first such exposure. Your condescension, "if you are able," was conveniently overlooked by the moderator(s) who seem eager to jump on anyone posting a word contrary to the "97%". Elsewhere I am called a "denier" and the moderator ignored this blatant violation of the "rules" I just read. The moderator also ignored the religious reference by that same poster which I shall address more specifically in another post.
Finally, I am forbidden by the rules here from stating why I believe the Keeling Curve (1) has a steep slope, based on its non-zero base, and (2) based on its failure to include the dominant greenhouse gas, water vapor.
Moderator Response:[RH] Snipped for condescending tone. Trust me. People here know the definition of the word "science." Please, either raise the level of the conversation to one worth of science or risk further deleted comments.
-
jja at 02:59 AM on 18 January 2017Parts of United States are heating faster than globe as a whole
Dr. Bob Kopp led a study for the 'Risky Business' project with an update a few years ago that indicated that extreme heat and humidity impacts in the Unites States was most likely to occur in the Ohio River Valley region. The timelines for these impacts appear to be significantly delayed given the rapid warming we have experienced in the last 3 years. If this trend continues then the likely impacts should be accelerated by several decades.
more information here:
-
boba10960 at 01:01 AM on 18 January 2017Fact Check: Rex Tillerson on Climate Risks
Not to detract from concern about Tillerson, but one needs to be careful not to equate the Gulf Stream with AMOC. The Gulf Stream transports five to ten times more water as it leaves North America off Nova Scotia than the amount of water involved in AMOC. The rest of the water carried by the Gulf Stream constitutes ocean recirculation, including the subtropical North Atlantic Gyre. Consequently, northern Europe would continue to benefit from ocean heat transport even were AMOC to be reduced. Consider, for example, the climate of British Columbia. The Pacific Ocean lacks a PMOC that is equivalent to AMOC, yet the combination of ocean heat capacity and gyre recirculation maintains a mild climate in Vancouver.
Paleoclimate records clearly indicate periods of abrupt cooling in Europe during the last glacial cycle. Many scientists attribute this to a decrease in AMOC, but a competing hypothesis is that expansion of sea ice in the North Atlantic insulated the atmosphere from the ocean heat source in wintertime during these cold intervals (see, for example, Denton, G. H., R. B. Alley, G. C. Comer and W. S. Broecker (2005). "The role of seasonality in abrupt climate change." Quaternary Science Reviews 24(10-11): 1159-1182). Note that Wallace Broecker is also a co-author of the paper that advocates this sea ice hypothesis.
-
Tom Curtis at 00:46 AM on 18 January 2017Increasing CO2 has little to no effect
The misnamed RenaissanceMan (hereafter RM) @210 quotes Ottmar Edenhofer as saying:
"One has to free oneself from the illusion that international climate policy is environmental policy. We redistribute de facto the world’s wealth by climate policy."
The quote is a translation of a comment Edenhoffer made in an interview, where in response to the interviewer saying:
"De facto ist das eine Enteignung der Länder mit den Bodenschätzen. Das führt zu einer ganz anderen Entwicklung als der, die bisher mit Entwicklungspolitik angestossen wurde."
{"De facto, this means an expropriation of the countries with natural resources. This leads to a very different development from that which has been triggered by development policy."}
Edenhoffer replied:
"Zunächst mal haben wir Industrieländer die Atmosphäre der Weltgemeinschaft quasi enteignet. Aber man muss klar sagen: Wir verteilen durch die Klimapolitik de facto das Weltvermögen um. Dass die Besitzer von Kohle und Öl davon nicht begeistert sind, liegt auf der Hand. Man muss sich von der Illusion freimachen, dass internationale Klimapolitik Umweltpolitik ist. Das hat mit Umweltpolitik, mit Problemen wie Waldsterben oder Ozonloch, fast nichts mehr zu tun."
{"First of all, developed countries have basically expropriated the atmosphere of the world community. But one must say clearly that we redistribute de facto the world's wealth by climate policy. Obviously, the owners of coal and oil will not be enthusiastic about this. One has to free oneself from the illusion that international climate policy is environmental policy. This has almost nothing to do with environmental policy anymore, with problems such as deforestation or the ozone hole."}
(Note that the translation is by Philip Mueller, apparently for the Global Warming Policy Foundation. As that organization has repeatedly proven itself an unreliable source, I do not trust the translation, but not speaking German, must relly on it.)
Stating the obvious first, RM, or his source, has reversed the order of the two sentences he does include in the quote, and deleted three of five sentences in the paragraph, one from between the two sentences, and all without any indication of the deleted sentences existence. That sort of manipulation of other peoples words is, in academic situations considers fraud. That is because the meaning of any sentence depends on its context - and RM (or his source) completely butchers the context whilst trying to hide the fact that they have done so. So, at best RM rellies on a fraudulent source without fact checking. I note that Larry Bell similarly butchers the text in an article for Forbes. CFACT also butchers the quote, but again not in an identical form. Simon Downing also has a similar, but distinct butchering. It appears that AGW deniers are almost as bad as creationists when it comes to lying by out of context quotation. But I can find no evidence that RM is not himself an original butcher of the quote; and hence a perpetrator of a deliberate fraud.
So what is the context of the quote, and how does it effect things? Well, to begin with Edenhofer had already stated clearly, in the immediately preceding response that:
"Basically it's a big mistake to discuss climate policy separately from the major themes of globalization. The climate summit in Cancun at the end of the month is not a climate conference, but one of the largest economic conferences since the Second World War. Why? Because we have 11,000 gigatons of carbon in the coal reserves in the soil under our feet - and we must emit only 400 gigatons in the atmosphere if we want to keep the 2-degree target. 11 000 to 400 - there is no getting around the fact that most of the fossil reserves must remain in the soil."
That is, he has clearly acknowledged the objective of climate policy, ie, to keep the increase in Global Means Surface Temperature to 2 degrees celsius or less. But in doing so, he notes that the policy necessarilly will have impacts beyond the environmental, and specifically economic impacts. He clarrifies what that means afterwords. Specifically, the choice of different responses to AGW will de facto result in different consequences for the distribution of global wealth. He has already mentioned one example in the response before that (ie, two responses before the one RM, or source, butchered):
"That will change immediately if global emission rights are distributed. If this happens, on a per capita basis, then Africa will be the big winner, and huge amounts of money will flow there. This will have enormous implications for development policy. And it will raise the question if these countries can deal responsibly with so much money at all."
I might note that the current approach, of limits on emissions as a percentage of a nations current emissions locks in higher living standards for the first world as part of the treaty system well into the future.
No reasonable climate policy can be devised without noting, and negotiating these de facto effects. But they are, as Edenhofer clearly states, even in the butchered version of the quote, de facto effects. That is, consequences that were not the intended consequence of the policy.
Moderator Response:[PS] You know better. Please dont roll in the mud with the pigs.
-
Eclectic at 00:13 AM on 18 January 20172017 SkS Weekly Climate Change & Global Warming Digest #2
So, RenaissanceMan, which do you think is more insufferable: the actual physical global warming which is going on — or the hypocrisy of those who are using jet planes? Or the hypocrisy of those who conflate these two separate concepts?
Do Einstein's personal flaws mean that his Relativity ideas are wrong?
Your argument falls on its face, RenaissanceMan.
-
MA Rodger at 22:27 PM on 17 January 2017Increasing CO2 has little to no effect
RenaissanceMan @209.
The choice of vertical scale on a graph of CO2 concentrations is hardily science. And the relative position of a red line on a piece of paper does not determine the contribution of CO2 on global climate forcing. The atmospheric levels of CO2 presented on both of your graphs is roughly consistent (you appear to plot CO2 some 50ppm too high on the lower graph) and it is atmospheric levels which determine forcing.
Yet you accuse the Keeling Curve of having an "unscientific nature." Have you any reason for such a claim? Setting out your claims in scientific terms would be the proper thing to do, if you are able.
-
RenaissanceMan at 22:07 PM on 17 January 2017Increasing CO2 has little to no effect
Incidentally, the profound effect of water vapor on warming is clearly and demonstrably felt on cloudy nights, where water acts as a powerful blanket, warming local temperatures. The carbon dioxide concentration does not vary remotely as much as humidity, so that on cool, clear nights, the "forcing" argument is out the window, along with heat.
On a side note, another bogus claim is that "increasing ocean acidification" (sic) results from higher carbon dioxide concentrations dissolving in ocean water.
1. The ocean is not "acidic," it is alkaline. In fact, it is 18 times more alkaline than pure water. (The pH scale is logarithmic, and ocean water has a pH of ~8.2)
2. Degassification is a primary natural source of carbon dioxide. It leaves the ocean, rather than dissolving in it.
“One has to free oneself from the illusion that international climate policy is environmental policy. We redistribute de facto the world’s wealth by climate policy.” – Ottmar Edenhofer, who co-chaired the U.N.’s Intergovernmental Panel on Climate Change working group on Mitigation of Climate Change from 2008 to 2015
-
RenaissanceMan at 21:56 PM on 17 January 2017Increasing CO2 has little to no effect
"Radiative forcing" is such a contrived and meaningless term. It is simply an attempt to dismiss water vapor's dominant significance. The infrared spectra for water vapor strongly resembles that of carbon dioxide, and in fact the former is even more powerful at capturing IR radiation. The unscientific nature of the Keeling Curve reflects the author's attempt to instill fear, rather than communicate truth and knowledge. The Keeling Curve is blatantly dishonest [snip]because (1) it does not have a zero base and therefore is strongly skewed as to slope, and (2) does not include the dominant greenhouse gas, water vapor.
Simply making these two adjustments changes it from this:
to this:
 Moderator Response:
[RH] Please keep your images down to 500px in width.
Warnings and snips due to commenter not reading the SkS commenting policies.
-
RenaissanceMan at 21:39 PM on 17 January 2017Russian email hackers keep playing us for fools
Nigelj@1: "Let’s be clear the Clinton and climategate email hacks were theft of people’s private correspondence. The thieves can’t even claim a public interest defence, or whistle blower defence, because there was no wrongdoing found in the documents."
You mean that a Democratic operative at CNN can hand over debate questions to Hillary Clinton and that doesn't represent "wrongdoing"?
Oh please. Bernie Sanders can be ousted by the joint efforts of DNC operatives who want Hillary crowned, and no "wrongdoing" there?
And on and on..
"People I know still quote climategate as if it proves the IPCC wrong. "
Why your ongoing uproar if climategate documents showed no wrongdoing? In fact, it was a major embarrassment which showed inexcusable and indefensible bias by supposed "scientists" with a very profitable "research" axe to grind.
"I don’t like the thought of Trump attempting to appease Putin any more than the way Clinton antagonised him. Both can only create all sorts of obvious problems. It would be better to maintain a sincere, respectful, but slightly detached approach."
How did you like Obama appeasing Putin in 2012: "Tell Putin I'll have more flexibility after the election," Obama said to the Russian diplomat.
And then Hillary giggled as she and a different Russian diplomat hit the little red "Reset Button" she gave him. Democrat appeasement of Russians is just fine, isn't it. But when the other side does it.... ooooo baby. Danger Will Robinson.
-
RenaissanceMan at 20:51 PM on 17 January 20172017 SkS Weekly Climate Change & Global Warming Digest #2
And that "other planet" would be.....?
The absurd pretense of space travel being some sort of answer to any imaginable question flies in the face of reducing carbon emissions. All that space technology consumes tons of fossil fuels all over the globe. How is it that the most ardent supporters of anthropogenic climate change (formerly "global warming") fail so miserably to practice what they preach? Al Gore globe trots the world over. Barack Obama flies Air Force One to Hawaii for every Christmas vacation, with his massive entourage, and takes it to Florida for a round of golf with Tiger Woods. Then he's off to Los Angeles to appear on a late night talk show. Billions of tax dollars, and CO2 pounds for worldwide vacations, all the time.
"Researchers" flie and drive around the world, willy nilly, as if their "work" is so critical to mankind's existence. The Hollywood Glitterati preach one thing and then take limos to their private jets, for getaways on huge yachts or foreign homes. The hypocrisy is insufferable.
-
Haze at 16:41 PM on 17 January 2017Press complaints process is ‘exercise in futility’ for scientists
Is this why "But, overall, majorities of Americans appear skeptical of climate scientists. No more than a third of the public gives climate scientists high marks for their understanding of climate change; even fewer say climate scientists understand the best ways to address climate change. And, while Americans trust information from climate scientists more than they trust that from other groups, fewer than half of Americans have “a lot” of trust in information from climate scientists (39%)." (http://www.pewinternet.org/2016/10/04/public-views-on-climate-change-and-climate-scientists/)
-
One Planet Only Forever at 13:41 PM on 17 January 2017Fact Check: Rex Tillerson on Climate Risks
A proposed better wording for the Global Sea Ice image description:
"Global sea ice extent data from the National Snow and Ice Data Center. The 2016-2017 values shown in red have been significant record lows since September of 2016."
-
John Hartz at 13:02 PM on 17 January 2017It's the sun
Recommended supplemental reading:
The NASA data conspiracy theory and the cold sun by Stefan Rahmstorf, Real Climate, Jan 16, 2017
-
knaugle at 02:36 AM on 17 January 2017Fact Check: Rex Tillerson on Climate Risks
Regarding #1
It's clear I'm thinking in terms of the next 50 years while the discussion on AMOC is thinking in terms of 100 to 300 years. So like the old beer commercial, I guess it's possible we could get both since the time scales don't line up, but neither of these events will be along the lines of "tastes great or less filling" :(
-
knaugle at 02:28 AM on 17 January 2017Fact Check: Rex Tillerson on Climate Risks
I've been following Arctic and Antarctic ice coverage for some time now.
Arctic Sea Ice News and Analysis
and the current trend is impressive, way below the recent average (1980-2000). It seems logical that it is not possible to have both an ice free Arctic and a Svalbard-like climate in Northern Britian / Norway.
Along those lines, Svalbard is approaching the point where it should be mostly iced in, but remains fairly ice free.
-
Tom Curtis at 12:20 PM on 16 January 2017Humans are too insignificant to affect global climate
Denny @21, as the moderator [PS] indicates, the IPCC AR5 found that in the period 1951-2010, more than 100% of warming was due to anthropogenic factors, as shown in this graph derived from AR5 data by Real Climate:
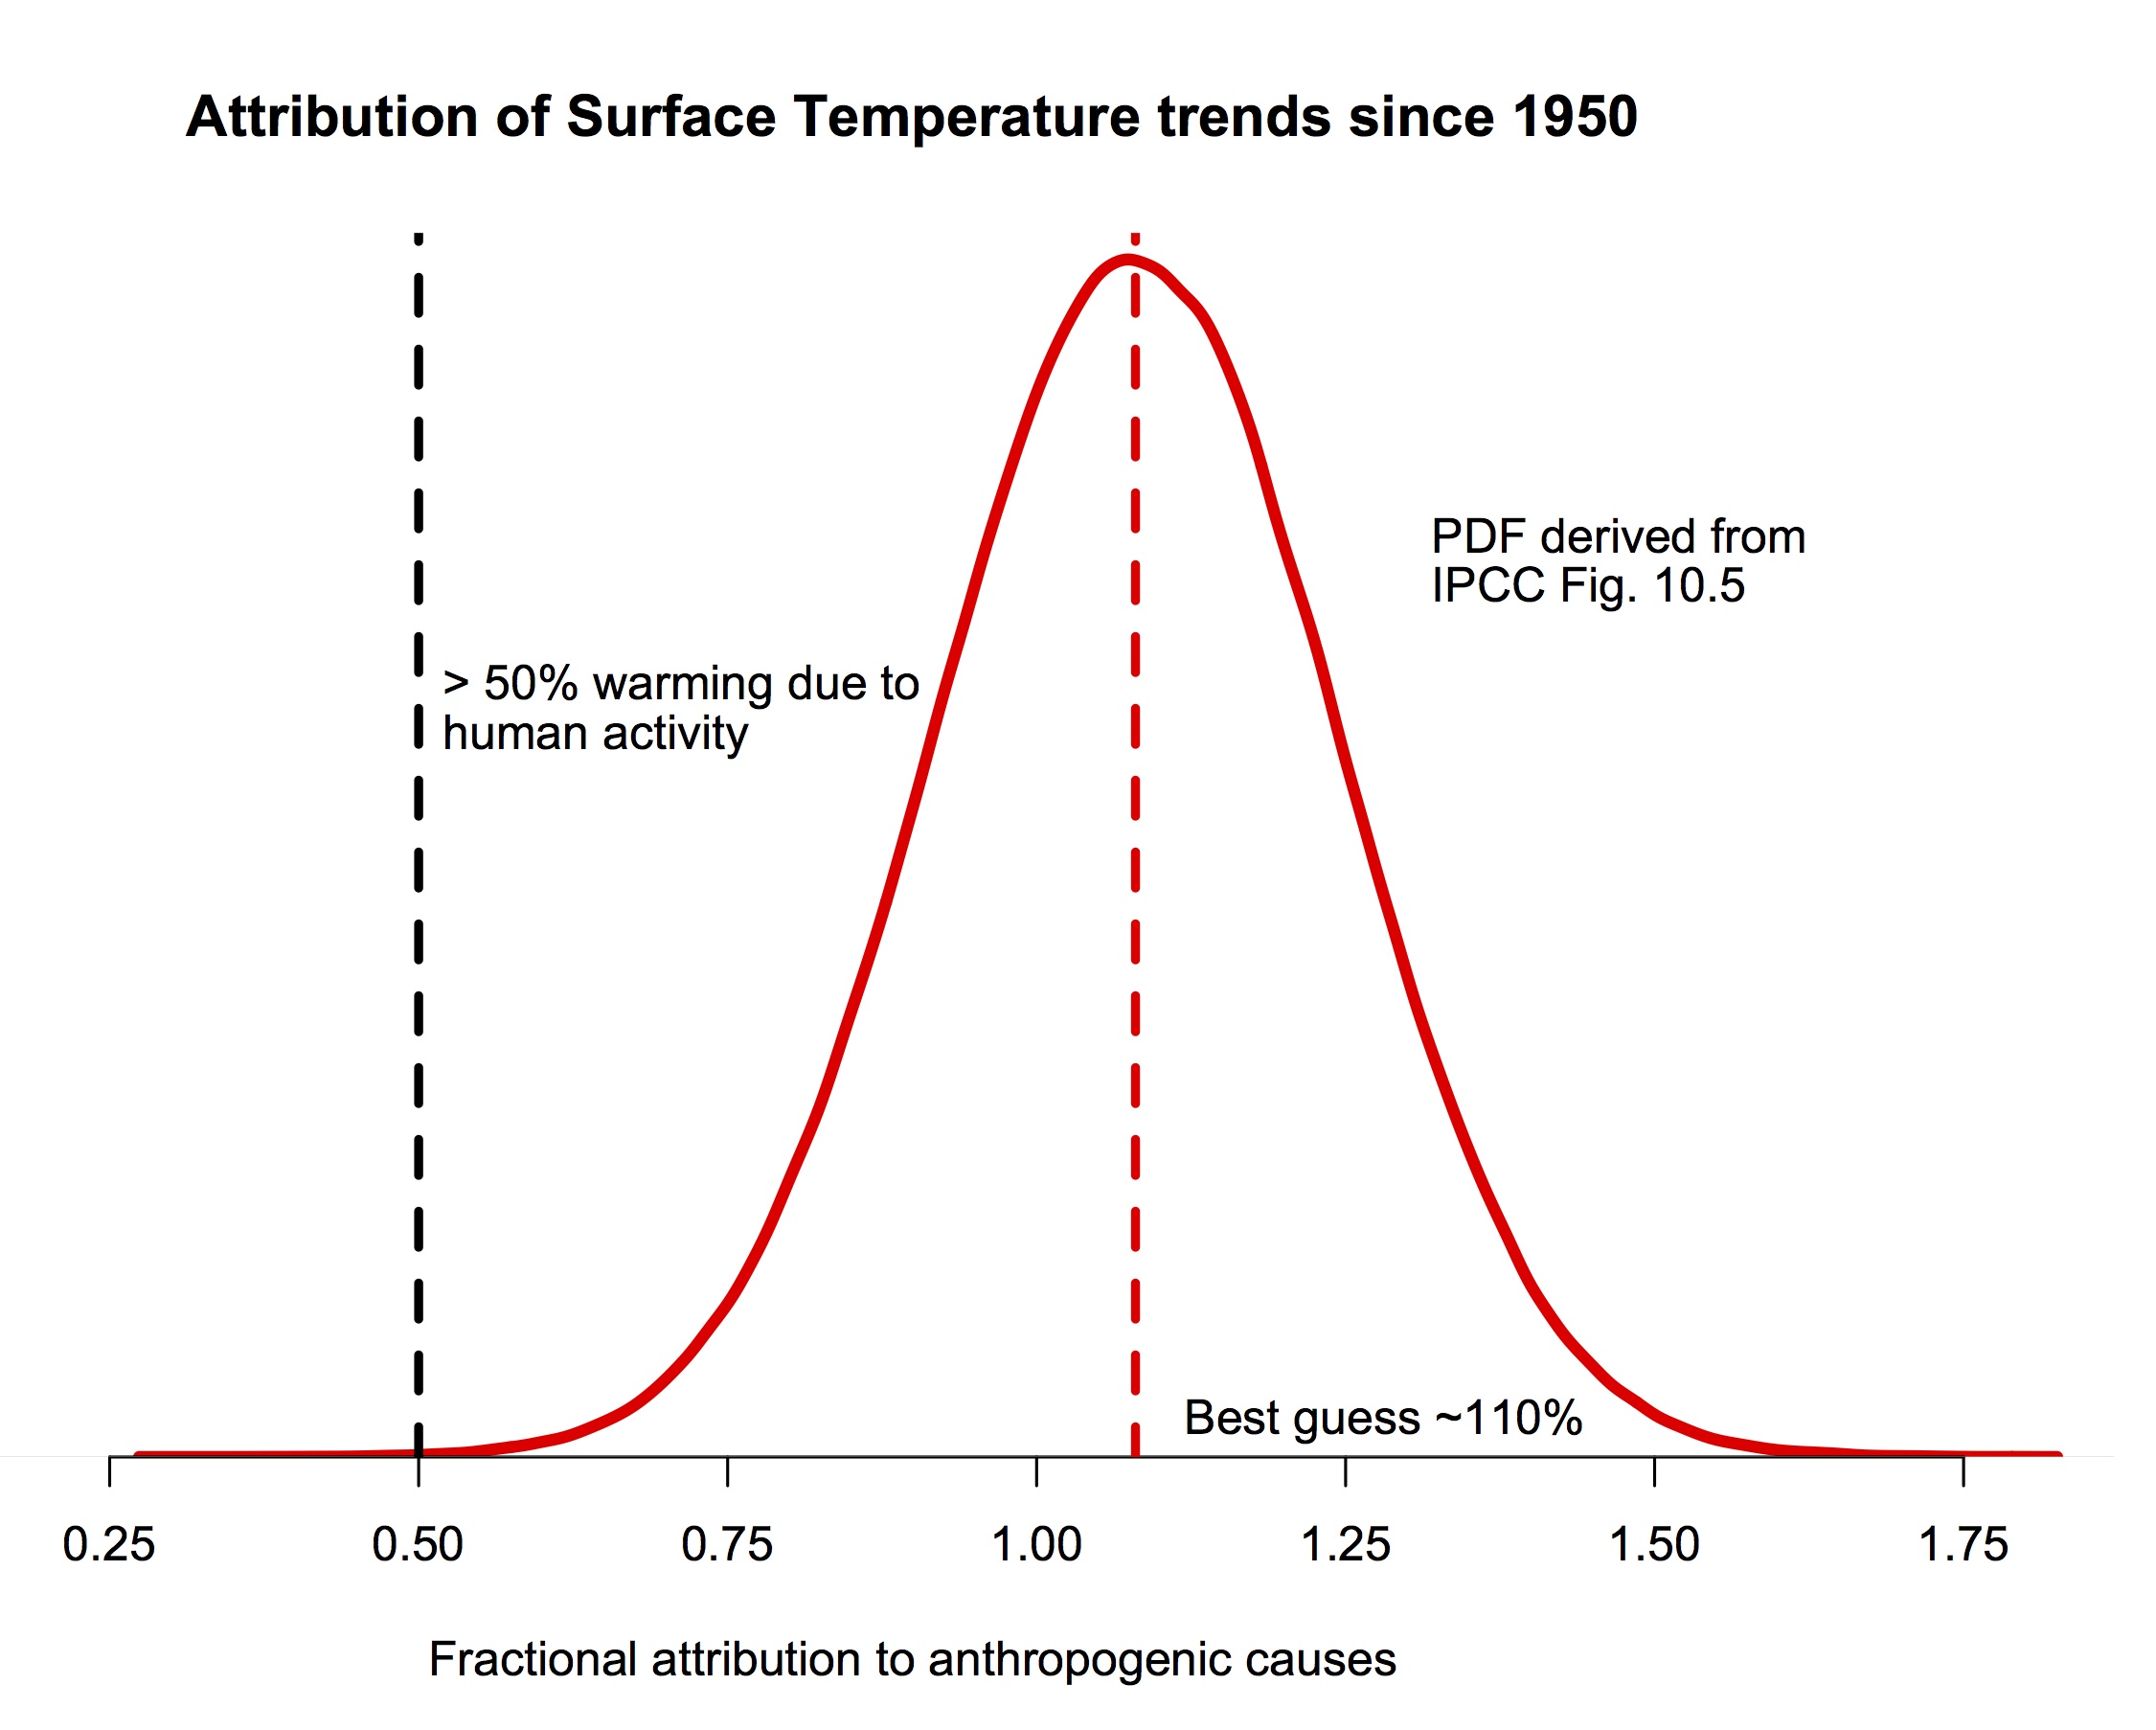
The likelihood that anthropogenic factors caused only 50% or less of the warming is very small (0.06%) based on that graph, while the likelihood that it is less than 100% is only 33.14% - ie, less than one chance in three. The IPCC final statement is more conservative than the graph, allowing a likelihood of not less than 95% ("extremely likely") that the anthropogenic factors caused more than 50% of the warming.
The IPCC can be this confident because the primary natural forcings (solar and volcanic) are known to have had a negative trend over that period; the ENSO influence is known to have been near neutral; and because the sixty year period provides a close coincidence with the period of natural cycles thought by some to have a significant influence on temperaure (AMO, PDO) and hence are neutral, or very nearly so. Other purported natural influences are either also negative because associated with one of the influences above (eg, cosmic rays), or of such poor scientific basis as to be magical thinking. Because of this, denying that the anthropogenic contribution over that period is in the range of (approximately) 75-125% amounts to magical thinking and/or pseudoscience.
What is worse, anthropogenic contribution is not constant over time. It amounted to less than 50% from 1901-1950, and likely around 30%, for example. Taking the 1901-2010 interval, it is closer to 75% than 100%. With ongoing emissions at a Business As Usual rate (RCP8.5), the anthropogenic contribution will become overwhelming. That is, it will still be close to 100%, but the probability of it falling below 75% will become vanishingly small unless something very unusual happens (ie, an increase in solar activity unprecedented in tens of thousands of years (and potentially over the entire life time of Sun to date). Further, because such natural factors are unpredictable, they are not included in the projection, so that if some unprecedented natural warming did occur, so that the anthropogenic contribution fell to 80%, then likely the total warming will have increased to 5 C, not the 4 C projected.
-
Denny at 08:30 AM on 16 January 2017Humans are too insignificant to affect global climate
Everyone seems to agree that if we follow the present trend, by the end of the century the temperture of the planet will increase by 4 degrees. Your article shows that at worst case the human cause is 1%. So 1% of 4 degrees is only 0.04 degrees. When you factor in all of the other variables your article mentions, plus forest fires, volcanos, etc., if all human causes were removed, there would be no noticable affect on the temperature even considering your water vapor loop which is present and obviously included in the 4 degrees change.
Moderator Response:[PS] "Your article shows that at worst case the human cause is 1%" This does not follow from the article at all. Can you please be more explicit where in our article that you get the idea that long term change in temperature (as opposed to short term variations) is only 1% human? We obviously need to improve clarity. AR5 put it at more like 110% (the earth would be cooler without anthropogenic effects). Discussed here.
-
John Hartz at 10:58 AM on 14 January 2017It's the sun
Recommended supplemental reading:
As Earth Warms Up, The Sun Is Remarkably Quiet by Bob Henson, WunderBlog, Weather Underground, Jan 11, 2017
-
ldibart at 10:05 AM on 14 January 2017It's the sun
The earth has been cooling down its dropped over 1 degree since the 90s not sure why the graph above stops and does not show this cooling down since the article was posted later than the highest heating point.
Now this cooling down is still continuing even though methane gas was released roughly ten times the amount more than normal. the sun has been less active as well before the earth began to cool a bit .the earth is still .36 degrees warmer however but again this cooling was done a bit after 2000 so that decrease happened relatively fast and I am sure will cause weather changes as the earth adjusts ..
They are trying to put the blame on man for the methane .however since 2007 Methane levels went on the rise and again the past 2 years released 10x (was the quote) that amount .. so unless rice paddies and cows and other man made products which is supposed to be 60 percent of the methane I dont see that had anything to do with this huge release at all as they stated having risen some monstrous amounts this can not be man made methane .
They admit that its hard to know where it came from ..but they will indeed blame man make up stats and charge people for it even though this much methane release has to come world wide and from other sources .IMOModerator Response:[JH] Sloganeering snipped.
Please note that posting comments here at SkS is a privilege, not a right. This privilege can be rescinded if the posting individual treats adherence to the Comments Policy as optional, rather than the mandatory condition of participating in this online forum.
Please take the time to review the policy and ensure future comments are in full compliance with it. Thanks for your understanding and compliance in this matter.
-
Tom Dayton at 05:14 AM on 14 January 2017Conservative media can't stop denying there was no global warming 'pause'
Sean, following up on my reply to you: The climate models do a good job of reproducing the sizes and durations of internal variability of temperature--those large swings above and below the model ensemble mean that I described previously. So changes in short term trends such as those you referred to as "flattening" are expected--projected by the models.
What the climate models do poorly is project the timings of those short term changes--for example, internal variability's oscillations due to ENSO. The sizes and durations of temperature oscillations due to ENSO are projected well, but the phase alignments of those oscillations with the calendar are poorly projected.
That's due to the inherent difficulty of modeling those things, but also to the difference between climate models and weather models. Those two types of models essentially are identical, except that weather models are initialised with current conditions in attempts to project those very details of timings that climate models project poorly. Weather models do well up through at least 5 days into the future, but after about 10 days get really poor. Climate models, in contrast, are not initialized with current conditions. They are initialized with conditions far in the past, the Sun is turned on, and they are run until they stabilize. It turns out that it doesn't matter much what the initialization condition details are, because fundamental physics of energy balance ("boundary conditions") constrain the weather within boundaries that are "climate." You might think of it as the mathematical (not the normal English!) concept of "chaos," with weather being the poorly predictable variations around stable "attractors." (Type "chaos" in the Search field at the top left of this page to see relevant posts.)
Evidence that the models well-project durations and sizes of temperature swings can be seen if you pick out from those model run spaghetti lines, the runs whose timings/phasings of some major internal variability in ocean activity just happen to match (by sheer accident) the actual calendar timings of those. Risbey et al. did that, as described well by Stephen Lewandowski along with several other approaches.
-
Tom Curtis at 04:21 AM on 14 January 2017NOAA was right: we have been underestimating warming
From the Comments Policy:
"No multiple identities. Posting comments at Skeptical Science should use only one registered screen name. Use of more than one account will result in all accounts being banned."
Given that, and given that Echo_Alpha_Zulu/Echo_Alpha_Delta is using at least two accounts, I will not respond to his comments until the moderators have determined to what extent he is violating the comments policy, and the appropriate course of action.
Moderator Response:[JH] All of the comments that Echo_Alpha_Delta has posted have been deleted because he/she is a sock puppet of a person who has been banned from posting on this site. All future posts of Echo_Alpha_Delta will be summarily deleted until his/her new identity is banned.
-
Tom Dayton at 03:24 AM on 14 January 2017Conservative media can't stop denying there was no global warming 'pause'
Sean, your statement that "the measured temperature was falling rapidly down the confidence limits" is incorrect, because those are not "confidence limits" in the usual statistical sense. You are not at all alone in misunderstanding that; climate scientists like most all other scientists (me included!) usually speak and write in shorthand about information that they all know. The "envelope" of model runs in the graph that Rob posted for you is shading to cover the area spanned by all the CMIP5 model runs. The individual model runs can be represented by a spaghetti graph that most people find hard to read, so usually the shading is substituted for the strands of spaghetti. See Rob Painting's post's Figure 2 as a schematic to understand that, and his Figure 3 for all the actual model run spaghetti strands.
The CMIP5 project had multiple models, most produced by different teams. Each model was run at least once, but some were run multiple times with different parameter values. The set of all model runs is a "convenience" sample of the population of all possible model runs. Indeed, it is only a "convenience" sample of all possible models. "Convenience" sampling in science does not have the "casual" or "lazy" implication that the word "convenience" does in lay language. It means that the sample is not a random selection from the population, and not even a stratified random sample. In this case, it is impossible to randomly sample from those populations of all possible model runs and all possible models. Therefore the usual "confidence limits" related concepts of inferential statistics do not apply.
So what does this distribution of model runs mean? It is multiple researchers' attempts to create models and model parameterizations that span the ranges of those researchers' best estimates of a whole bunch of things. So it does represent "confidence" and "uncertainty," but in more of a subjective judgement way than what you probably were thinking. Read Rob's post for more explanation.
Notably, none of the individual model runs has the shape of the multi-model ("model ensemble") mean line. In other words, we expect the global temperature to not follow that multi-model mean line. That's a stronger statement than "we don't expect the global temperature to exactly follow the multi-model mean line." It would be disappointing if any of the individual model runs followed that mean line, because it is quite clear that the global temperature varies a lot more than that. That's because the global temperature in the short term is weather by definition, and only in the long term is climate. So what we expect is for global temperature to vary a lot day to day, month to month, year to year, and even decade to decade, in response to variations in internal variations such as ENSO; and to variations in forcings such as volcanoes, insolation, greenhouse gas emissions, and reflective aerosol emissions.
We do expect that the resulting wavy actual global temperature line will follow the general pattern of all those model runs. That includes expecting the actual temperature line to stay within the range of all those model runs (the bounds of the ensemble). We expect it will not hug the ensemble mean; we expect it will swing up and down across that mean line, sometimes all the way to the edge of the range (not just to the edge of 95% of the range). We expect 10 year actual trends to deviate substantially from that mean line. We expect 20 year actual trends to deviate significantly from that mean line. We expect 30 year trends to deviate somewhat from that mean line. We expect 50 year trends to deviate slightly from that mean line. Beyond 50 years into the future the uncertainty starts increasing again.
Read Rob's post, then with that knowledge as context, re-read Tom Curtis's replies to you.
-
Tom Curtis at 03:05 AM on 14 January 2017Conservative media can't stop denying there was no global warming 'pause'
Sean OConnor @9, what your really saying is that you want a gotcha moment, not actual understanding.
For the record, the running 10 year means in the CMIP5 RCP8.5 from 2011.5 (ie, the period from 2007-2016) to 2020.5 (ie, 2016-2025) is 0.284 +/- 0.278 C/decade. The mean value is meaningless without the uncertainty. It would only be a meaningful value if, contrary to fact, we lived in a world without short term, unpredictable influences on temperature such as ENSO. With that uncertainty, any observed trend during that interval from 0.006 - 0.562 C/decade lies within the predicted model range.
More importantly, the model projection for 2011-2015 was a 10 year trend of 0.255 +/- 0.323 C/decade, with an observed trend of 0.148 C/decade - well within the uncertainty level. Indeed, according to the models, there is a 19-25% chance of a trend that low, or lower. If you conclude from those statistics that the models have been falsified, you are like a person who, seeing a 1 rolled on a six sided dice, conclude that probability theory is bunk because it predicted only a 1 in six (16.67%) chance of such an event occuring in a single roll.
That leaves aside such details as that the models are projections, ie, predictions on the assumption that a particular forcing history has occurred. That is particularly significant because it is known the observed forcing history showed a lower growth than the RCP8.5 forcing scenario; which would lead us to expect the observed trend to be less than the projected trend.
-
Sean OConnor at 03:01 AM on 14 January 2017Conservative media can't stop denying there was no global warming 'pause'
OK, I'll make it easy. If the level of CO2 continues to grow for the next couple of decades as it did for the last couple of decades what will be the projected expected rate of global temperature rise over that time? (and we continue to get similar numbers of volcanos, El Ninos, La Ninas etc...)
-
RedBaron at 02:36 AM on 14 January 2017Conservative media can't stop denying there was no global warming 'pause'
@9 Sean OConnor,
Models don't predict, they project. There is a difference. in other words:
If ABC.... then D +/- an uncertainty factor
ABC... has some factors that are known and some factors that can't be known until they happen. So because all the factors ABC... can't be known ahead of time, they can only be projected as to what range of values they might have in the future, depending on our actions and many events that can't be known ahead of time.
For example, exactly how many new solar panels will be bought next year? Wind generators? Do you know? When will be the next el nino? la nina? The next major volcanic eruption? How large? The average fuel efficiency of next years car and truck models? How many will be sold? How much will they be driven? We can project possible numbers for all of these within ranges, but no one can predict ahead of time those exact figures and hundreds more until they actually happen!
As of yet NO ONE can accurately predict the future. What climate scientists can do with their models is project possible outcomes depending upon how a multitude of future events unfold. Then those projections are tested against the empirical evidence after it happens and is measured, and it gives scientists new knowledge about how our climate system works.
The reason you keep needing to ask over and over and are frustrated at not getting a satisfactory answer, is because you are asking the wrong question.
Maybe this will help:
-
Sean OConnor at 01:23 AM on 14 January 2017Conservative media can't stop denying there was no global warming 'pause'
OK, I'll ask for a third time: What do the models predict that the rate of global warming will be over the next few decades?
The article states that we've been seeing something like 0.16C to 0.18C per decade as measured by scientific instruments.My understanding was that the prediction was 0.3C per decade. So I am surprised to see an article on Skeptical Science giving a figure of about half what was predicted.
-
Tom Curtis at 00:33 AM on 14 January 2017Conservative media can't stop denying there was no global warming 'pause'
Sean OConnor @7, I compared the RCP8.5 model runs for CMIP5 to the Berkeley Earth Surface Temperature Land Ocean Temperature Index (BEST LOTI) from 1861 to 2015 (that being currently the most recently available annual data point for BEST LOTI). Taking runing 10 year means over that interval, the BEST LOTI has a mean difference from the CMIP5 RCP 8.5 ensemble mean of 0.01 Standard Deviations (ie, a normalized error of 0.01), with a standard deviation of the normalized error of 1.11. That is, over that period the historical record shows more variability than the ensemble mean, but the running 10 year trends show no significant bias. Indeed, the trend of the normalized error is -0.004 +/-0.004, so that over time, the mean normalized error has decreased - a trend which is almost but not quite significant.
The greater variability of the historical record is expected. That is because the mean of the CMIP5 RCP8.5 ensemble is the average of 39 different runs, each of which varies in different locations. That is due to different timings of simulated ENSO events, along with other quasiperiodic cycles represented in the model. Consequently the ensemble mean is far smoother than any individual run.
Now you might correctly point out that the majority of that run represents a hindcast. We are more interested in the accuracy of forecasts. However, the proper test of the accuracy of the forecast is that it is not statistically distinguishable from the accuracy of the hindcast. If we apply an absolute test of the accuracy in the forecast, we treat the actual record as though it were an ensemble mean; rather than the logical equivalent to just another ensemble member. We know from the hindcast that the timing of ensemble member ENSO events (and the like) are not coordinated and that those drive the substantial variability from year to year from the ensemble mean. We also know that the historical record exhibits the same behaviour. Therefore we expect in future the variability from ENSO events to result in considerable variability in the short term trend from the ensemble mean, but that overtime that variability will average out.
As it happens, the normalized error in the 10 year trend terminating from 2006 - 2015 is -0.67. That is, it is running two thirds of a standard deviation of the typical error below the ensemble mean. Therefore it does not even hint at a problem in accurate prediction.
Note that the 2006-2015 interval has high values at either end and low values in the middle and so would be expected to have a flat trend. That, from our knowledge of the ENSO record, and that the ensemble mean averages out the effects of ENSO, we would expect a lower than average 10 year trend to 2015.
-
Sean OConnor at 21:58 PM on 13 January 2017Conservative media can't stop denying there was no global warming 'pause'
Thanks Rob P for posting that graph but virtually all that it shows is that models are good at predicting the past and that isn't something I'm terribly interested in. But when the model was actually predicting the future, from say 2000 onwards, your graph clearly shows that actual recorded temperatures were quite flat whereas the prediction was for them to increase (which is ironic as this article is all about there not being a pause when your own graph clearly shows that there was!) and the measured temperature was falling rapidly down the confidence limits. Granted, the recent El Nino has upped the measured temperatures, but my understanding is that this will only be temporary as it was in 1998.
So rather than show a graph of hindcast predictions could you please let me know what the predicted global temperature rise is according to our latest models for the next few decades? Don't show a graph, just write down the number in degrees C per decade that we are expecting for the next 20 or 30 years. My understanding was that it was 0.3C/decade but please correct me if I'm wrong.Moderator Response:[Rob P] ".....your graph clearly shows that actual recorded temperatures....."
The ol' eyecrometer is not a statistical tool. Note what appeared in the post above - from Foster & Abraham [2015]:
"A barrage of statistical tests was applied to global surface temperature time series to search for evidence of any significant departure from a linear increase at a constant rate since 1970. In every case, the analysis not only failed to establish a trend change with statistical significance, it failed by a wide margin."
"My understanding was that it was 0.3C/decade....."
In the IPCC's Second Assessment Report, the projected global annual mean rate of warming for the early 21st century (slightly larger than scenario IS92a), including greenhouse gases and sulfate aerosols, was 0.2°C per decade.
-
bozzza at 15:49 PM on 13 January 2017Conservative media can't stop denying there was no global warming 'pause'
BBHY, would you therefore agree that the pattern markets need to see before a consolidatory approach toward self imposed carbon intensity efficiency would be: <b>a temperature trend of la ninas above that of el ninos?</b>
-
bozzza at 15:44 PM on 13 January 2017Global weirding with Katharine Hayhoe: Episode 8
..well, maybe not exactly: nah, good maps actually- I hereby stand corrected!
-
bozzza at 15:41 PM on 13 January 2017Global weirding with Katharine Hayhoe: Episode 8
The Middle East is the exact antithesis, however. Interesting maps.....
Prev 417 418 419 420 421 422 423 424 425 426 427 428 429 430 431 432 Next


