


 Arguments


Recent Comments
Prev 454 455 456 457 458 459 460 461 462 463 464 465 466 467 468 469 Next
Comments 23051 to 23100:
-
Bob Loblaw at 10:19 AM on 25 August 2016Naïve empiricism and what theory suggests about errors in observed global warming
Over at Victor Venema's blog, the comment I liked best was the one that said:
"As Einstein himself noted, "I never said half the crap they say I did on the Internet."
-
gws at 09:11 AM on 25 August 2016Katharine Hayhoe on Climate and our Choices
Dr. Hayhoe will also be interviewed highly publicly in September during the Texas Tribune "Tribfest", Sat., Sept. 24, 3 pm. Unfortunately, they named the session The Gospel of Climate, playing straight into the "climate change science is a religion" crowd ... no doubt a provocative title. On top of that, Dr. Hayhoe will be one of only two scientists/intellectuals (Dr. Webber from UT the other) in the whole field of speakers in the Energy and Environment sessions ... good luck!
-
nigelj at 09:06 AM on 25 August 2016State of the Climate 2015: global warming and El Niño sent records tumbling
Jonbo @ 4.
Good article in your link. The PDO is swinging positive to a warming phase, and the AMO could be swinging to a cooling phase, all over the next decade or so. Remember neither of these drives global warming from greenhouse gases, and can only influence that trend to some extent.
However the Pacific ocean is larger, so would be the dominant force globally and is entering a warming phase. We are heading for warming globally as a whole, but some north atlantic coastal areas could maybe cool or warm more slowly, or have associated dry periods.
-
VictorVenema at 08:48 AM on 25 August 2016Naïve empiricism and what theory suggests about errors in observed global warming
Also at my blog the main discussion was about the sources for the Einstein quotes. It does not matter much for the story, but I will be more careful next time.
-
ubrew12 at 07:30 AM on 25 August 20162016 SkS Weekly News Roundup #34
Reposting here Mary Ellen Harte's semi-weekly compilation of Climate Change and Green-Energy links in Huffington Post for interested parties.
-
Tom Curtis at 07:19 AM on 25 August 2016Naïve empiricism and what theory suggests about errors in observed global warming
I have always been a bit suspicious of the quote, "No amount of experimentation can ever prove me right; a single experiment can prove me wrong" often attributed to Einstein. That quote espouses a naive falsificationism which is inconsistent with the subtle thought of Einstein on the philosophy of science. It turns out the quote appears in none of Einstein's writtings, and though attributed to Einstein by several sources in print, none of those attributions specify at time, place or person to whom it was said. Therefore, the quote must be considered dubious at best.
Einstein has written similar things. In "Induction and Deduction in Physics" he wrote:
"A theory can thus be recognized as erroneous if there is a logical error in its deductions, or as inadequate if a fact is not in agreement with its consequences. But the truth of a theory can never be proven. For one never knows that even in the future no experience will be encountered which contradicts its consequences; and still other systems of thought are always conceivable which are capable of joining together the same given facts."
And in an unpublished note he wrote:
"The scientific theorist is not to be envied. For Nature, or more precisely experiment, is an inexorable and not very friendly judge of his work. It never says "Yes" to a theory. In the most favorable cases it says "Maybe," and in the great majority of cases simply "No." If an experiment agrees with a theory it means for the latter "Maybe," and if it does not agree it means "No." Probably every theory will someday experience its "No"—most theories, soon after conception."
-
gorm raabo larsen at 07:03 AM on 25 August 2016Katharine Hayhoe on Climate and our Choices
Thanks - Brief and Excellent !
-
John Hartz at 06:59 AM on 25 August 2016There's no correlation between CO2 and temperature
MA Rodger & Tom Curtis:
Because Victor cannot abide by the SkS Comments Policy, he has relinquished his privilege of posting comments on this site. Therefore, please do no post any new responses to him.
Thank you.
-
victorag@verizon.net at 06:42 AM on 25 August 2016There's no correlation between CO2 and temperature
#121 MARodger:
What Lovejoy's Figure 3a represents to me is how easily data can be distorted to support just about any theory, providing one is clever enough to adroitly juggle the statistics. And of course Lovejoy is not alone. I see this sort of distortion everywhere in the cli. sci. literature.
For some examples see the following list.
It wouldn't be so bad if the various attempts reinforced one another or were even consistent with one another, but in most cases they are not. Extraordinary claims require extraordinary evidence. It's not enough to pull a few rabbits out of a hat. The evidence must be there, it must be clear and it must be objective. While highly complex and even convoluted technical discussions are appropriate in a purely scientific paper, it should be possible to boil all that down into a clear and simple explanation that any educated person can understand. And no, simply reiterating over and over that "climate change is real" won't do.
Moderator Response:[JH] Sloganeering snipped.
[DB] This participant has recused themselves from further participation in this venue, finding the burden of complying with this venue's Comments Policy too onerous.
-
victorag@verizon.net at 06:17 AM on 25 August 2016IPCC admits global warming has paused
#10 Tom Curtis: "Further, your argument against the temperature effect of CO2 is entirely statistical."
I never said I rejected statistics. My point, in agreement with Fyfe's point, is that it is not always the best tool in all circumstances and can sometimes distort the physical reality behind the raw data.
-
Jonbo69 at 06:00 AM on 25 August 2016State of the Climate 2015: global warming and El Niño sent records tumbling
Thanks for the replies. I read the post article, which looks like we will experience warming from the PDO but then I read that we are entering a cooling period in the AMO. https://theconversation.com/the-atlantic-is-entering-a-cool-phase-that-will-change-the-worlds-weather-42497. Whether these two effects will balance each other out regarding overall surface tempeature, I haven't a clue.
-
John Hartz at 03:39 AM on 25 August 2016Water vapor is the most powerful greenhouse gas
Old Sage: Your most recent comment was deleted itn its entirety because it violated a number of prohibitions set forth in the SkS Comments Policy.
You are now on the cusp of relinquishing your privilege of posting comments on this site.
Moderator Response:[PS] Old sage needs to answer the question above. He instead asks questions readily answered in a text book and by people here (see Postive feedback = runaway greenhouse) but seems utterly incapable of understanding the answer. Answering how he understands the temperature of a surface to be determined is best way to sort out misunderstanding/misapplications of physics.
-
victorag@verizon.net at 01:39 AM on 25 August 2016There's no correlation between CO2 and temperature
#130 MARodger. Thanks very much for going to all this trouble, MA. I won't respond in detail for the usual reason, so all I'll say at this point is:
I see what Wolfe sees.
Moderator Response:[JH] The discussion of scatter plots has now run its course. It's time to move on to other topics.
-
RedBaron at 01:27 AM on 25 August 2016Climate-related disasters raise conflict risk, study says
Haze,
What you are refering to is called CO2 fertilization, a stabilizing feedback. This stabilizing feedback, all else equal, should be large enough to counter emissions, given a healthy environment. But the environment is not healthy, and this stabilizing feedback is far too small to counteract fossil fuel emissions. Second factor often neglected is that leaves are not all created equal. While C4 plants (mostly grasses) represent only 3 % of species, they represent a disproportionately large % by more than an order of magnitude of photosynthesis due to higher efficiency. They also do better at lower atmospheric CO2 levels. Those same grasses while temporarily fixing more CO2 also have a mature phase with highly increased albedo. (amber waves of grain?) And the 4th factor is instead of producing a woody trunk, c4 grasses put 30% or more of those increased products of photosynthesis directly into the soil in what is called the "liquid carbon pathway". Not only is a higher rate of carbon fixed, but a much higher % is directed into the stable carbon pool as opposed to the labile carbon pool. This "greening" is actually part of a transition to lower efficiency plant species in some areas and part of the long slow process of desertification in some areas as well. (less soil carbon holds less water in the soil to hold plants over through a drought)
So while you can claim that "seems to fly in the face" if you wish, but digging deeper into the highly nuanced interactions actually brings a different result.
-
John Hartz at 23:01 PM on 24 August 2016Climate-related disasters raise conflict risk, study says
Speaking of envronmental degredataion, check out the recently created website:
The human footprint map measures the cumulative impact of direct pressures on nature from human activities. It includes eight inputs:
- the extent of built environments,
- crop land,
- pasture land,
- human population density,
- night-time lights,
- railways,
- roads, and
- navigable waterways.
-
Tom Curtis at 20:47 PM on 24 August 2016These are the best arguments from the 3% of climate scientist 'skeptics.' Really.
eljoris @13, any "current flow" in space is in the form of the passage of positive (typically protons or ionized helium nuclei) or negative particles (typically electrons). As such, in the vicinity of the Earth, such currents are experienced as components of the solar wind, or galactic cosmic rays; and the energy of the "electrical current" is just part of the energy contributed by those sources. Both have been quantified, with cosmic rays contributing approximately 0.0000032 W/m^2, and the solar wind contributing a relatively "massive" 0.00035 W/m^2. These figures include the energy from the particles physical impact, along with that from any current they carry. For comparison, the total anthropogenic forcing increased by about 1.8 W/m^2 from 1880 to 2010, ie, approximately 560,000 times the energy recieved from cosmic rays, and 5000 times the energy received from the solar wind. Because these energy sources are so small relative to the normal forings (changes in solar output, volcanism, anthropogenic forcings) they are neglected by climate scientists.
Cosmic rays may have a secondary effect in which they influence cloud albedo and cloud greenhouse effect. Current evidence suggest that any such effect is small, but potentially much larger than any direct energy effect. Climate scientists certainly pay attention to this possibility.
-
KingInYellow at 19:15 PM on 24 August 2016Naïve empiricism and what theory suggests about errors in observed global warming
When theory and observations do not match, the theory can be wrong, the observations can be wrong and the comparison can be wrong. What is called observations is nearly always something that was computed from observations and also that computation can be imperfect. Only when we understand the reason, can we say what it was.
This is a really good comment and one the deniers don't get. All their hot air about the pause/hiatus and the "excuses" examining the internal variables that could result in such periods is a good example.
Tx
All the best.
-
eljoris at 19:11 PM on 24 August 2016These are the best arguments from the 3% of climate scientist 'skeptics.' Really.
As a layman, and non native English speaker, I have a question for the well read to which I haven't yet found an answer on this site: The Earth with its magnetic field is a giant electric dynamo floating in the open electric environment of the solar system which is not separated from the electrical environment of the galaxy. Furthermore, the vacuum of space is a plasma filled environment with loose electrons and electric potentials do generate current flows over intergalactic distances. (This is not even controversial.)
The physical parts of the Dynamo heat up depending on the intensity of this flux, and science does already know that voltage potentials in the sun-earth space vary with time. Wouldn't it be scientifically prudent to atleast send probes out to verify how this variable changes over time at various points in the solar system and outside of the solar system in our small branch of the galaxy?
Compared to this large potential for external forcing (pun intended), and various interacting cycles -which might depend on the relative position and movement of our earth within and through this field of electric potentials-, CO2 and for that matter all other earth based variables might just be overqualified and overweighted.
Is this potential mechanism actively being researched? I would like to know how climate science has refutiated that hypothesis because it just 'feels' like something you would need a well researched answer to, taking into account various cycles. Do they even keep an open mind to that possibility or just turn a blind eye to it?
Kind regards.
-
MA Rodger at 19:08 PM on 24 August 2016There's no correlation between CO2 and temperature
Concerning the bogus nature of the Danley Wolfe graphic introduced into this discussion by Victor Gauer (but on the wrong thread).
May I introduce my own graphic of three panels that illustrates the bogus nature of Wolfe's analysis, my graphic linked here (usualy 2 clicks to 'download your attachment')
The top panel reproduces Wolfe's data plot, LOTI (I actually use LOTI as published in May 2014 - what should have been the Wolfe data - it is very close to Wolfe's data and indestinguishable for the data most recent to May 2014) plotted against MLO CO2. Note Wolfe repeatedly says he uses GISTEMP Met Station data but he is obviously wrong. He uses LOTI but adds 14ºC to the values. He calls this "absolute" rather than an anomaly although it is simply the anomaly shifted by 14ºC so not the monthly "absolute" values.
Added to the Wolfe data is the LOTI data for June 2014-to-date as published today. The annual CO2 cycle (unlike the annual LOTI cycle) remains as per Wolfe's plot. Its inclusion has no physical justification, just as retaining the annual LOTI cycle would have no physical justifictaion. Its inclusion is patently wrong.
The central panel plots the same data but adds a trace using 12-month averages for MLO CO2 and a red trace that additionally uses the 12-month averages for temperature. As the rate of increase in CO2 has been rising over the decades, the red trace is effectively the LOTI time series but with the early years squished up and the later years stretched out. The ratio of most-squished:most-stretched is about 1:3. So conpared with the more normal time series plot of LOTI, this CO2-series plot will markedly eccentuate any slowdown in the LOTI record during the later years.
The third panel introduces the trend lines drawn on by Wolfe (the black trace). The flat part of the trend for the later years is not calculated as Wolfe describes. Wolfe's "1998-2014" result can be reproduced (down to the "158 observations") using May 2014 published data and the period 4/2001-5/2014. The other flat trend for the earlier years is undescribed by Wolfe. Importantly, the sloping trend Wolfe shows joining the flat eary section to the flat later section cannot be the result of any analysis. It is probably drawn fancifully simply to connect the top and bottom flat trends. It is entirely bogus.
The yellow trend is the OLS trend for Wolfe's data through the middle part of the data with the narrower yellow lines extending that trend to the ends of the data. The OLS trend for the entirety of Wolfe's data is represented by the white plot and is very little different from the full-length yellow trend plot. It is thus evidently bogus to attempt to argue that there are any periods either at the start or at the end of this data with significantly lower trends. Yet Wolfe does just that!!!
-
victorag@verizon.net at 14:19 PM on 24 August 2016There's no correlation between CO2 and temperature
#127 P.S.
Tom, if you go to the SkSc trend calculator, setting the start date to 1960, the end date to 2016, and the moving average to 0 — and select HadCrut4, you'll see a more up-to-date representation that's even closer to your scattergram.
-
victorag@verizon.net at 13:52 PM on 24 August 2016There's no correlation between CO2 and temperature


(from this site www.walkersands.com/Blog/climate-change-in-the-age-of-google/)
#127 So, Tom, what you are saying is that the congruence I see between these two graphs is a meaningless optical illusion?
One other thing. Your correltion of 0.857 covers the entire scattergram, which was not the point. The claim is that three different scattergrams are represented, the first showing little to no correlation, the middle showing significant correlation and the last also showing no significant correlation. That's what I see in both Wolfe's graph and yours. And if there's a problem assigning a statistically derived value to each of these because they're too short, then as I see that's a problem with the statistical methodology, not with our ability to evaluate the data per se.
-
Eclectic at 13:30 PM on 24 August 2016Climate-related disasters raise conflict risk, study says
Haze @5 . More greening [leaf area] in recent decades is evident from the satellite images. This is good for herbivores and livestock. However, higher average temperatures, storms, and heat-waves have a deleterious effect on maize, rice and wheat crops (but especially the maize). Overall crop yields decline . . . and greater extension of croplands is needed.
Arguably, that produces an environmental degradation - it depends on what definition is used !
-
Haze at 08:22 AM on 24 August 2016Climate-related disasters raise conflict risk, study says
RedBaron@4. Your comment "Why would AGW, whose major component is environmental degradation, be any different?" seems to fly in the face of the many reports noting the increased greening and decreased browning of the planet due to the effects of CO2.
For example, Zhu et al note from satellite measurements of leaf area index (LAI) "a persistent and widespread increase of growing season integrated LAI (greening) over 25% to 50% of the global vegetated area, whereas less than 4% of the globe shows decreasing LAI (browning). Factorial simulations with multiple global ecosystem models suggest that CO2 fertilization effects explain 70% of the observed greening trend, followed by nitrogen deposition (9%), climate change (8%) and land cover change (LCC) (4%).
-
michael sweet at 07:14 AM on 24 August 20162016 SkS Weekly Digest #34
At a recent auction of electricity in Chile, an un-subsidized solar farm was the lowest bidder with a bid of 2.72 cents per kilowatt hour. Joe Romm discusses the auction here. People who say renewable energy is too expensive will have to explain why coal was almost twice as expensive in this auction. The Atacama desert has a very high sun resource but they need more long distance transmission lines to bring the power to their cities.
Hopefully solar will continue to decrease in price so that buisinesses install solar to save money. Already, according to Forbes, ""Wal-Mart [is] the single biggest commercial solar generator in the country (United States)." (in November 2015 they had about 105 megawatts of solar installed. They save money by installing solar arrays on their roofs. Other commercial real estate owners are starting to install solar, it is cheaper than the grid.
-
Tom Curtis at 07:05 AM on 24 August 2016There's no correlation between CO2 and temperature
victorag @126, for any scatter plot where the data has a correlation less than 1, and conforms approximately to a linear trend, if you take a small section of the total data measured by distance along the x-axis, the subsection of the data will look like it has a much smaller correlation. That only indicates that by using a small section of the data you are maximizing the noise to signal ratio. Because the temperature noise is autocorrelated, the small subsection may give the appearance of a very different trend, but again that is just a product of cherry picking.
If you want to find a genuine divergence from the scatter plot, you need to find a significant body of data that lies more than two standard deviations from the trend line. In this case, that means +/- 0.3 C relative to the line 0.0094X - 3.05. For the demarcated x values, this gives parameters of:
X value Mean -2 SD +2 SD
300 -0.23 -0.52 0.06
320 -0.05 -0.34 0.24
340 0.14 -0.15 0.43
360 0.33 0.04 0.62
380 0.52 0.23 0.81
400 0.71 0.42 1
420 0.89 0.6 1.18A quick check shows that there are no major clusters of points lying outside the +/- 2 SD limits, and hence no reason to assume a break point in the trend.
We can take this further by extending the data using that from Law Dome. Unfortunately when we do so we are limited to annual values generated by a 20 year spline smooth for CO2, and hence annual values for temperature. That artificially inflates correlation, but not by much given the small variance of CO2 to begin with. It has no effect on trends. So, having done so we find the trend is 0.0097 X - 3.13. The values are within two standard errors of the predicted trend and intercept based on the Mauna Loa data, and are minimally divergent in absolute values. That indicates the observed trend in the Mauna Loa/Temp scatter plot is robust, and has been in effect since 1850 at least. Given that, looking to subdivide the Mauna Loa data is clearly not justified (and not justified on two distinct tests).
There are reasons for a slight visual distinctiveness in the two regions you point out. Specifically, both the rate of increase in CO2 concentration and in temperature have tended to increase over time. This results in the points being more densely scattered on the left of the graph than on the right. This is even more apparent on the Law Dome scatter plot. As it happens there was an acceleration in the increase in CO2 concentration about when CO2 concentration reached 340 ppmv, which accounts for the denser plot below that level. Near 400 ppmv the distinctive appearance results from the reduced linear least squared error fit for temperature (ie, not the underlying trend, but the superficial trend) followed by the spike in temperatures starting around 2013. That reduced superficial trend, however, does not carry the temperature values outside 2 standard deviations of the y estimate, however, and therefore is irrelevant unless it were to continue and carry the values outside that range. Of course, with the recent spike in temperatures it has patently not done so.
-
victorag@verizon.net at 05:58 AM on 24 August 2016IPCC admits global warming has paused
#9 Tom Curtis
I responded to your last post, with the new scattergram, on the other thread. To my eyes your result isn't that different from Wolfe's.
-
victorag@verizon.net at 05:56 AM on 24 August 2016There's no correlation between CO2 and temperature
#125 Thanks so much, Tom, for the very thorough explanation, and the corrected scatterplot. Maybe my eyeballs are deceiving me, but I see more or less the same picture as in Wolfe's scatterplot. Random until roughly 340 ppm, correlated until roughly 380, and then random again — with a bit of a spike after 400. What do you see?
-
Tom Curtis at 05:45 AM on 24 August 2016IPCC admits global warming has paused
victorag @6, I quite agree that:
"Statistical analysis is a vital tool in any climate scientist’s toolbox. However, even the application of sophisticated statistical tools can shed more heat than light, particularly in arguments that focus on limited aspects of statistical significance rather than on broader physical understanding. . ."
You, however, cannot consistently do so. First, that is because it means Fyfe et al's acceptance of evidence of a change in forcing leading to a slow down logically precedes their acceptance of the existance of a slow down. Logically, therefore, it is not an attempt to plug up a theory and make it resistant to contrary observations (as you have elsewhere suggested). Either the evidence of reduced forcing that justify belief in a slow down is sound (in which case your attempt to impugn it is ill motivated), or it is not (in which case it cannot be relied on to infer the existence of a slowdown, where the statistical evidence is inadequate to justify that inference).
Further, your argument against the temperature effect of CO2 is entirely statistical. (Bad, and cherry picked statistics, but statistical never-the-less). But if you accept the principle above, you cannot rely on entirely statistical arguments in judging the effect of CO2.
In short, your defence of Fyfe et al based on that quote is, for you, a matter of tactical convenience only as there is no evidence you apply that principle more generally.
-
victorag@verizon.net at 05:40 AM on 24 August 2016IPCC admits global warming has paused
Here's another study, dating from 2014, thus prior to Fyfe et al., in which the "hiatus" is taken seriously — only in this case the authors are unable to account for it: Application of the Singular Spectrum Analysis Technique to Study the Recent Hiatus on the Global Surface Temperature Record
Some excerpts:
From the abstract:
Global surface temperature has been increasing since the beginning of the 20th century but with a highly variable warming rate, and the alternation of rapid warming periods with ‘hiatus’ decades is a constant throughout the series. . .
Henceforth, MDV [multidecadal variability] seems to be the main cause of the different hiatus periods shown by the global surface temperature records. However, and contrary to the two previous events, during the current hiatus period, the ST [secular trend] shows a strong fluctuation on the warming rate, with a large acceleration (0.0085°C year−1 to 0.017°C year−1) during 1992–2001 and a sharp deceleration (0.017°C year−1 to 0.003°C year−1) from 2002 onwards. This is the first time in the observational record that the ST shows such variability, so determining the causes and consequences of this change of behavior needs to be addressed by the scientific community.
From the Discussion section:
After the maximum warming rate associated with MDV was reached by approximately 1990, ST showed a distinct peak from 1992–2001, with an unprecedented increase of its warming rate from 0.0085°C year−1 to 0.017°C year−1, almost doubling in one decade. After this warming rate peak, the ST shows a pronounced decline, 0.017°C year−1 in 2001 to 0.003°C year−1, in 2013. This type of quick fluctuations in the ST warming rate has no precedent in the observational record (Fig. 3a). . .
Therefore, the very recent strong changes observed in the warming rate associated with the ST appear to be a global phenomenon that had not occurred before (at least not during the last 160 years). It could not be attributable to MDV or any other form of climatic variability (such as solar cycles), as the different contributions are effectively separated by the SSA analysis (Fig. 2). This unprecedented modification of the ST behavior should be more deeply studied by the scientific community in order to address whether a change in the global climate sensitivity [21] has recently occurred.
Here's an article on these findings from the European Commission's website: Last decade's slow-down in global warming enhanced by an unusual climate anomaly
-
Tom Curtis at 05:37 AM on 24 August 2016IPCC admits global warming has paused
victorag @8, I have responded to your comments on CO2 correlation on the original (and appropriate) thread. In the comment I have shown that:
Using the data as downloaded (Mauna Loa monthly plus BEST LOTI) increases the correlation fractionally.
And that Wolfe cherry picks a restricted temperature data set which artificially deflates the correlation.
I have also shown a new scatter plot satisfying your stricture that the data as downloaded be used (except for interpolation of missing months).
MA Rodger, regardless of Briggs merits or otherwise, correlation is covariance divided by the product of the standard deviations of the data. Smoothing reduces the standard deviation, and therefore must increase the correlation. This was something I was quite aware of which was why my primary analysis used monthly data to obviate any issue of inflating the correlation by smoothing. As I went out of my way to avoid artificially inflating the correlations, I take exception to Victor's suggestions that my mathematics has been manipulation rather than analysis.
-
Tom Curtis at 05:28 AM on 24 August 2016There's no correlation between CO2 and temperature
victorag has mistakenly posted a response to my post @119 on the incorrect thread. As the comments are off topic on the other thread, I will reply here.
Victor wrote:
"Regarding the difference between "eyeballing" and statistical analysis: there are many ways to manipulate results using statistics, whereas one's eye sees the data directly. Sorry, but where the picture is clearly there for all to see, I'll trust my eye, thank you."
First, and most obviously, it is as easy to distort with graphs as it is with statistics. Indeed, in some respects easier. Second, I find the imputation that my statistical analysis, which I fully described, were designed to manipulate the data, still less to "modfied [the data] to produce the desired result". For the full Mauna Loa comparison I used the same Mauna Loa data that was used by Danley Wolf, with the sole exception that I used anomaly data because the temperature data was anomaly data, and I wanted to compare like to like, and that I interpolated missing values. I deliberately used monthly data to avoid artificially smoothing the data. Over the full interval of Mauna Loa data, had I instead used the raw montly values (with interpolation for missing months), ie, used the data essentially as downloaded, it would have increased the calculated correlation from 0.855 to 0.857, a negligible difference. That clearly demonstrates that my high calculated correlation was not an artifact of using anomaly data for CO2 concentration. It should be noted that Mauna Loa, because of its location in the northern hemisphere, experiences a larger seasonal cycle in CO2 concentration than does the global average, so that using the raw data with no seasonal cycle adjustment itself represents an artificial deflation of the correlation.
"Smoothing creates artificially high correlations between any two smoothed series."
This is an obvious consequence from the formula for correlation, which is the covarriance divided by the product of the standard deviations. Smoothing reduces the size of the standard deviation and thereby increases the correlation. But, just as it is possible to artificially inflate correlations by reducing the standard deviations of the data, so it is possible to artificially deflate increasing the standard deviation (of which more later).
"Regarding scattergrams: the scattergram offered by Tom lacks sufficient detail to be very useful. Here's another that does, compiled by Danley Wolfe from raw data available to all at:
Mauna Loa: ftp://aftp.cmdl.noaa.gov/products/trends/co2/co2_mm_mlo.txt
NASA GISS: http://data.giss.nasa.gov/gistemp/tabledata_v3/GLB.Ts.txt
Wolfe does nothing to "massage" his data, it's directly transcribed from the two sites referenced above."
First, Wolfe did not "directly transcribe" the data. Specifically, with regard to temperature he added the mean annual temperature durring the baseline period to all values in the mistaken belief that he would thereby convert them from anomaly values. Anomaly values are calcultated from monthly means, however, so Wolfe's hybrid data represents neither anomaly values or the actual temperatures experienced.
Second, Wolfe cherry picks his data set. Instead of using the GISS Land Ocean Temperature Index, he used the GISS Land (Meteorological Stations only) data. Because that data represents only a third of the globe, and because it largely excludes oceans, the data is far more variable than the GISS LOTI. Thus by cherry picking the meteorological station data, he takes advantage of the fact that inflating the standard deviation of the data artificially deflates correlations (alluded to above). This by itself deflates the correlation by about 20%, and the R-squared by about 36%.
He gains further advantages from his cherry pick. First, because of the limited geographical area covered by his data, temperature variability is more influenced by local factors, and less influenced by global factors - further decreasing the correlation with CO2. Second, the meteorological station data is distinctly flater after 1998 than is the Land/Ocean data, thereby further deflating the correlation in the so called hiatus period. Wolfe is doing well, in that he got three distortions of the data from just one cherry pick.
In any event, here is a scatterplot of the monthly Mauna Loa data as downloaded except for the interpolation of missing values, against the BEST LOTI. The correlation as previously noted is 0.857 (R^2: 0.734):
-
victorag@verizon.net at 04:23 AM on 24 August 2016IPCC admits global warming has paused
#7 MA Rodger
If Wolfe's scattergram doesn't suit you, why not produce one that does? But if you do, please use raw data, not data that's been statistically modfied to produce the desired result.
-
MA Rodger at 03:53 AM on 24 August 2016IPCC admits global warming has paused
Victor Gauer @6.
I was wondering how long you would take to introduce Danley Wolfe's fabrication into SkS. His MLO CO2 data is as stated but is unadjusted for the annual cycle. And the GISTEMP data isn't as Wolfe states. It is not "NASA GISS global mean (absolute) land temperatures" as Wolfe claims. It is the NASA GISS LOTI anomaly with 14ºC added. (In detail, its origins appear to be a 'collection' of LOTI data. It is certainly not the LOTI data as published in May 2014.) The steep slopey line Wolfe draws on to his graph has no basis other than arbitrarily joining up the two flat unslopey lines, which are themselves not the cherry-picked OLS results that Wolfe claims. When I have a moment I shall illustrate graphically how dreadful this nonsense from Mr Danley Wolfe truly is.
And after a quick google, Dr William M Briggs appears not to be a good expert to rely on uncritically. Specifically here, what does he mean by "smoothed"? Is it a concern for anything under discussion here?
-
victorag@verizon.net at 02:35 AM on 24 August 2016IPCC admits global warming has paused
#2 Tom Curtis. I'm not qualfied to distinguish between the claims of Werner and Fyfe, but I do find myself agreeing with Fyfe when he comments on the value of a purely statistical analysis:
Statistical analysis is a vital tool in any climate scientist’s toolbox. However, even the application of sophisticated statistical tools can shed more heat than light, particularly in arguments that focus on limited aspects of statistical significance rather than on broader physical understanding. . .
These results illustrate the dangers of relying solely on a statistical test to tell us whether there is, or is not a physically-based change in warming rates.
Regardless of which view is the correct one, such disputes shed light on the problems faced by climate scientists intent on proving their thesis beyond reasonable doubt. It's all too easy to fall back on the notion that it's now up to skeptics to provide the evidence they themselves have been unable to provide.
-
victorag@verizon.net at 02:10 AM on 24 August 2016IPCC admits global warming has paused
(My apologies again: the links I provided got lost when I re-pasted this post. Please delete post #4. Thank you.)
For reasons already stated, I will be brief, so as not to waste my time with long explanations that might get edited or deleted. Maybe it's better that way anyhow.
Regarding the difference between "eyeballing" and statistical analysis: there are many ways to manipulate results using statistics, whereas one's eye sees the data directly. Sorry, but where the picture is clearly there for all to see, I'll trust my eye, thank you.
Regarding statistical smoothing:
Smoothing creates artificially high correlations between any two smoothed series. Take two randomly generated sets of numbers, pretend they are time series, and then calculate the correlation between the two. Should be close to 0 because, obviously, there is no relation between the two sets. After all, we made them up.
But start smoothing those series and then calculate the correlation between the two smoothed series. You will always find that the correlation between the two smoothed series is larger than between the non-smoothed series. Further, the more smoothing, the higher the correlation. (From the blog of Dr. William M. Briggs (PhD in Mathematical Statistics))
Tom Curtis at #119: Regarding scattergrams: the scattergram offered by Tom lacks sufficient detail to be very useful. Here's another that does, compiled by Danley Wolfe from raw data available to all at:
Mauna Loa: ftp://aftp.cmdl.noaa.gov/products/trends/co2/co2_mm_mlo.txt
NASA GISS: http://data.giss.nasa.gov/gistemp/tabledata_v3/GLB.Ts.txt
Wolfe does nothing to "massage" his data, it's directly transcribed from the two sites referenced above.
-
Tom Curtis at 23:03 PM on 23 August 2016There's no correlation between CO2 and temperature
MA Rodger @123, given how wrong Victor is regarding CO2 concentration/Temp correlation, I think you are being over generous in your interpretation, unless, and until Victor corrects the record.
-
MA Rodger at 22:51 PM on 23 August 2016There's no correlation between CO2 and temperature
Tom Curtis @122,
You are entirely correct except that Victor has been so frequently using the phrase "CO2 emissions" down this thread in place of 'increased atmospheric CO2 levels' or 'anthropogenic CO2 forcing' or whatever, that I ignore the true meaning of it and substitute the sensible intended meaning.
-
Tom Curtis at 22:06 PM on 23 August 2016There's no correlation between CO2 and temperature
MA Rodger @121, Victor's claim that "he evidence I presented concerned the lack of a long-term correlation between global warming and CO2 emissions" assumes a fundamental misrepresentation of climate science. Specifically, if AGW is correct, we expect a strong correlation between global mean surface temperature and CO2 concentration, but CO2 concentration is not expected to be correlated with CO2 emissions. Rather, it is a near linear function of cumulative emissions. Again, there is no necessary correlation between emissions and cumulative emissions. (There is, no doubt a de facto correlation simply because emissions have grown with time, but there is no reason to suppose it is a particularly strong correlation; and it will be much less than the near perfect correlation with cumulative emissions.)
-
MA Rodger at 21:35 PM on 23 August 2016There's no correlation between CO2 and temperature
Victor Gauer @118,
Adding to Tom Curtis @119, I am also concerned that your comment @118 is incorrect.
You tell us:-
"When we examine the data, as presented in any number of graphs representing global temperature since ca. 1880, we see only one period in which both tempertures and CO2 emissions are rising at roughly the same rate at the same time: the last 20 years or so of the 20th century. Aside from that, no correlation is evident."
This is an important comment as it is the bedrock of all this palaver running down this comment thread. In this regard, your obsession with CO2 forcings is quite extraordinary and poorly explained. So perhaps the paper Lovejoy (2014)would be of interest to you. The paper sets out some reasons for atmospheric CO2 being used as a proxy both for all AGHGs and for the sum of anthropogenic forcings. Lovejoy (2014) additionally considers the time lags between forcing & ΔT as well as the lack of linearity in the relationship.
You may find Loyejoy (2014) also interesting because of its Figure 3a, which provides a "graph(s) representing global temperature since ca. 1880" and one which does show significantly more than "20 years or so ... in which both tempertures and CO2 emissions are rising at roughly the same rate at the same time." In truth it demonstrates a convincing correlation over the whole period under analysis 1880-2004, echoing the analysis presented @119.

Of course, you may wish to present your own "evidence" for your absent-but-for-20-years CO2 v GMST correlation. I appreciate that @97 you tell us "The evidence I presented concerned the lack of a long-term correlation between global warming and CO2 emissions. Since I've been told not to repeat myself, I won't get into that again." But you will see up-thread of #97, your presented "evidence" is restricted to almost nothing, indeed absent-but-for-a-bit-of-hand-waving.
-
MA Rodger at 21:17 PM on 23 August 2016There's no correlation between CO2 and temperature
Victor Gauer @116,
As you truncate your comment for fear thet it will be moderated into oblivion, I have no way of knowing whether your selective response to my comment @116 can be addressed at all. Suffice to say, your repeat waving of the abstract of Fyfe et al (2016) @116 is noted by me and that you should be aware that were Fyfe et al to consider the terms "slowdown" and "hiatus" to be "equivalent," it is mighty odd that for the three times the term "hiatus" is used in that context within the paper, one is saying others use the term "hiatus", a second is within a quote of others who use the term and a third is specifically saying Fyde et al object to use of the term "hiatus". You will note that its use in the well-waved abstract has a description appended just to be sure foolish folk know what they mean by "hiatus" and "global warming slowdown." They make quite clear within the paper that they address a slowdown in surface warming and nothing more. Nowhere do they "specifically refer to the terms "hiatus" and "slowdown" as equivalent" and that includes the abstract.
-
Tom Curtis at 20:02 PM on 23 August 2016There's no correlation between CO2 and temperature
victorag @118 wants to look at graphs, apparently because he thinks his eyeball can better detect correlations than maths. For what it is worth, the correlation between CO2 and Temperture from March 1958 to July 2016 (ie, over the full Mauna Loa record) is 0.855 as noted @107 above. Apparently that fact is refuted (in his opinion) by the superior discriminating ability of his eyeball. If that is not enough, using BEST LOTI temperature and the Law Dome CO2 record extended by Cape Grim data, the correlation between CO2 concentration and global mean surface temperature from 1850 to 2013 is 0.903.
Of course, if you are going to insist on eyeballing your correlations, and not use those lying mathematical methods (/sarc), you can always check out a scatterplot of the values:

When compared to a set of sample scatterplots for different correlations, the similarity to that for a correlation of 0.9 is evident:

Perhaps the mathematics isn't lying at all, and there really is a strong correlation between CO2 concentration and temperature.
Given this mathematical, and eyeball evidence, I don't know what to make of victorag's claim that:
"But given the complete lack of long-term correlation in the raw data, it is incumbent on followers of the mainstream view to support the underlying correlation they seek to demonstrate with clear and convincing evidence. Otherwise, skeptics are justified in denying that any such correlation exists."
Well, no doubt, given that a false statement implies everything. But both the maths and a simple scatter plot show clearly that there is a high correlation between CO2 and temperature over the last 160 odd years.
So the more interesting question is, why given the clear evidence of a long term correlation between CO2 and temperature does Victor persist in insisting that no such correlation exists? How he does it is easy. In a mutual plot of concentration and temperature against time, there are periods in which the correlation is not 1. Indeed, if you do not use smoothed data, there is no period in which the correlation is 1. Victor appears to take this as proving the correlation is not high, but "does not have perfect correlation" does not imply "does not have high correlation". Therefore the inference from "does not match the slope in all intervals" to "is not highly correlated" a garbage inference.
As an aside, Victor also seems to think the ratio of scales of a mutual plot of CO2 concentration and Temperature against time is a given. How else can we make sense of his claim that "we see only one period in which both tempertures and CO2 emissions are rising at roughly the same rate at the same time: the last 20 years or so of the 20th century". In fact, the rate of increase of CO2 will be in ppmv per annum, and that of temperature will be in degrees Centigrade (or Kelvin, etc) per annum; so that at no time will they rise at the same rate. Given that the rates are not commensurate, they can be arbitrarilly varied, and doing so can make any period of approximate linear rise by both graphically coincide. Victor may be assuming the normal convention of standardizing by the standard deviation of both, but where the short term variability of both is very dissimilar (as is the case for CO2 and temperature), this can lead to deceptive results. Using the BEST/Law dome data, for example, it leads to a predicted transient response of 1 C per 100 ppmv increase. On the forcing data derived from the same data set it predicts a Transient Climate Response of 0.59 C/(W/m^2), or 2.2 C per doubling of CO2, which is likely too high.
-
Tom Curtis at 14:27 PM on 23 August 2016Richard Milne separates skepticism from denial
SteveAplin @68:
1) A general shift in the Republican party position on climate change has been obervable over the last few decades, from a position indistinguishable from that of the Democrats in the presidency of George H Bush, to a position where the nominee and the runner up of the 2016 presidential race are avowed climate skeptics. In this context, a shift towards a more "skeptical" position by senior Republicans who has previously backed significant anti-global warming legislation is significant. Further, a shift in order to win the votes in the primaries (where Republican voters are the dominant part of those appealed to) is more indicative of the Republican party position than any later trimming to not scare away centrist and Democrat leaning voters.
More importantly, the choice of Rick Perry as an example of the Galileo gambit probably owes most to his being the most prominent and recognisable user of the gambit that was likely to be recognized by students in a Scottish university in 2011. I will revise that opinion if you can provide me with a list of equally prominent users of the Gambit around 2011. If you cannot, you need look no further for a reason and your view of the choice of example as being a shot at the Republican party is unjustified.
2) As it happens, arsenic is present in small quantities in all human diets, and hence in all humans. We cannot thereby conclude that arsenic is safe. At higher dosage it is a deadly poison. Likewise, radiation at low levels in present in all human living environments, as you point out. At higher levels, it greatly increases the risk of cancer, and at higher levels still it can cause a debilitating disease, or even death. As it happens, 27 people died from the Chernobyl incident from Acute Radiation Syndrom (ACS). A further two died from cancer tied to ACS, one died of "external and internal radiation burns, blistered heart", one died of "thermal and radiation burns, trauma", and one of trauma. I take it that blistering of the heart comes from penetrating radiation, not thermal radiation so that at least thirty of the associated deaths are attributable directly to radiation. This excludes discussion of any deaths due to the increase of radiation from fallout from the accident, because Milne restricts his discussion to those who were "there when Chernobyl exploded". From the figures above, if you were present at the power station at the time of the explosion, you were more likely to die of radiation than of trauma or thermal burns.
Because Milne talks only about the time of the explosion, no inference can be drawn about his views of the relative risk from radiation from fallout which (I agree) are often overstated.
3) With regard to Blair, it was possible to tell at the time he was mistaken. That was because it was known at the time that UNMOVIC, based on on the ground inspections, was clearly stating that Iraq had no weapons of mass destruction in a deployable condition. That qualification is important because the purported legal justification of the invasion of Iraq was self defence, which required a clear and present danger (ie a danger that could be immediately implimented, and of which you had good reason to think it would be implimented). It was further known that much of intelligence relied on by the US and Blair was unreliable, with the claims that Iraq was purchasing uranium having been publicly rebutted by the person who investigated the claims. At the same time, a US intelligence agency was clearly saying the evidence did not support the administrations case, and and Australian intelligence analyst resigned and publicly declared the reason was the distortion of the evidence to make claims supporting the case for war that was not supported by the evidence.
I paid very carefull attention to all publicly available evidence on this issue at the time; and was outraged (still am outraged) by what I can only see as a deliberate attempt to mistate the quality of the evidence with the intent to decieve the varous electorates of Bush, Blair and Howard (Australia's PM at the time) in order to bring about a war. At best, it was a case of galloping confirmation bias, but for it to be confirmation bias, the intent to go to war must have preceded the evidence in any event. Given that many of Bush's senior staff were associated with a conservative think tank that had been advocating a new war with Iraq prior to Bush's election (and ergo, prior to 911) only supports this analysis.
-
victorag@verizon.net at 14:09 PM on 23 August 2016There's no correlation between CO2 and temperature
#117 When we examine the data, as presented in any number of graphs representing global temperature since ca. 1880, we see only one period in which both tempertures and CO2 emissions are rising at roughly the same rate at the same time: the last 20 years or so of the 20th century. Aside from that, no correlation is evident. That doesn't mean that an underlying correlation might be present that is hidden by other factors. But given the complete lack of long-term correlation in the raw data, it is incumbent on followers of the mainstream view to support the underlying correlation they seek to demonstrate with clear and convincing evidence. Otherwise, skeptics are justified in denying that any such correlation exists.
Once again, I won't waste my time elaborating until I feel sure my comments won't be deleted or censored.
Moderator Response:[JH] All commenters on this site are required to abide by the SkS Comments Policy.
-
There's no correlation between CO2 and temperature
victorag - WRT your links to "The reversed responsibility response", i.e. the reversal of the burden of proof - you have it backwards:
The correlation of CO2 to warming (as one of many forcings, both natural and anthropogenic) has been well established over the last 150 years, starting with Tyndall, Fourier, and Arrhenius and basic spectroscopy, and continuing through theory, observations, and simple empirical evidence to today. That evidence has been accumulated and collated, the case regarding AGW has been made. The burden of proof now rests upon those who disagree, such as you, to present evidence sufficient to overturn that 150 years of data and theory. Armwaving and nitpicking, let alone semantic gaming and your presentations of short term trends without statistical significance (such as since 1998) do not suffice.
The strength of that correlation with CO2 was your initial objection to this thread - and quite frankly your objection has not survived examination. Since then you've done little but dance around trying to change the subject. You've been verbose, and your Gish Gallups extensive, but hardly convincing.
-
victorag@verizon.net at 12:12 PM on 23 August 2016There's no correlation between CO2 and temperature
MARodger: "Victor states @108 that Fyfe el al, by "specifically refer to the terms "hiatus" and "slowdown" as equivalent" but this is untrue."
See the abstract:
"It has been claimed that the early-2000s global warming slowdown or hiatus, characterized by a reduced rate of global surface warming, . . " etc.
As for the rest, I won't be responding further until I am assured that my comments will not be deleted or censored.
Moderator Response:[JH] All commenters on this site are required to abide by the SkS Comments Policy.
-
victorag@verizon.net at 11:49 AM on 23 August 2016IPCC admits global warming has paused
With regard to Fyfe et al., see the very interesting blog post and discussion at Ed Hawkins' blog. See also the Guest Post by Fyfe et al. on the same blog, followed by many very interesting comments as well.
I won't comment further until I receive a reassurance that my comments will not be deleted or censored, as I see no point in wasting my time.
Moderator Response:[JH] All commenters on this site are required to abide by the SkS Comments Policy.
-
Tom Curtis at 10:50 AM on 23 August 2016There's no correlation between CO2 and temperature
I have responded to victorag @108 on a more appropriate thread.
-
Tom Curtis at 10:50 AM on 23 August 2016IPCC admits global warming has paused
Elsewhere, victorag is arguing that a "pause" exists, basing the argument on Fyfe et al (2016). He ignores Werner et al (2015) (discussed here). Werner et al first determine the locations of the break points in the piecewise trends in GMST for a forced number of breakpoints up to eight. Breakpoints only appear around 1998 or later if you force seven or more breakpoints:

They further apply statistical tests to determine the statistical support for each number of breakpoints, finding the best statistical support for three breakpoints, with potential support for two, four, or five breakpoints. There is little statistical support for seven or eight breakpoints, and hence little statistical support for a 21st century slowdown:

Fyfe et al (2016) do not include Werner et al in their references, and therefore ignored this evidence. Further, their rejection of statistical tests showing no change in underlying trend because of their supposedly extended baseline, which is true of the IPCC AR5, but not true of all such statistical tests. Using their preferred intervals for the "big hiatus" and the "slowdown" and updated NOAA (Karl 2015) data, we can see that the Jan 1972- Dec 2000 interval has a trend of 0.171 +/- 0.061 C/decade. The Jan 2001- Dec 2014 interval has a trend of 0.078 +/- 0.140 C/decade. That is, the trend for the second interval includes the trend for the first interval in its uncertainty, and therefore the null hypothesis that the trend has not changed cannot be rejected. (Note that it can be rejected using HadCRUT4, but that is because HadCRUT4 has limited coverage, particularly in the Arctic and North Africa, as can be checked by looking at the HadCRUT4 Krig data.) (See also Cahill et al (2015), also ignored by Fyfe et al.)
In short, Fyfe et al insist on a slowdown because (as they say) their "exploration of an alternative baseline period is motivated by ΔF, the estimate of anthropogenic radiative forcing" rather than because of any statistical evidence of a slowdown. They have either mistated or ignored the statistical evidence that, based on the temperature series, no slowdown exists (Werner et al), or at least that no slowdown has been demonstrated (statistical uncertainty on the trends of their chosen intervals).
Worse for victorag is that even if we accept a slowdown in the trends, it was actually predicted by the CMIP5 computer models. Fyfe et al show the following graph:
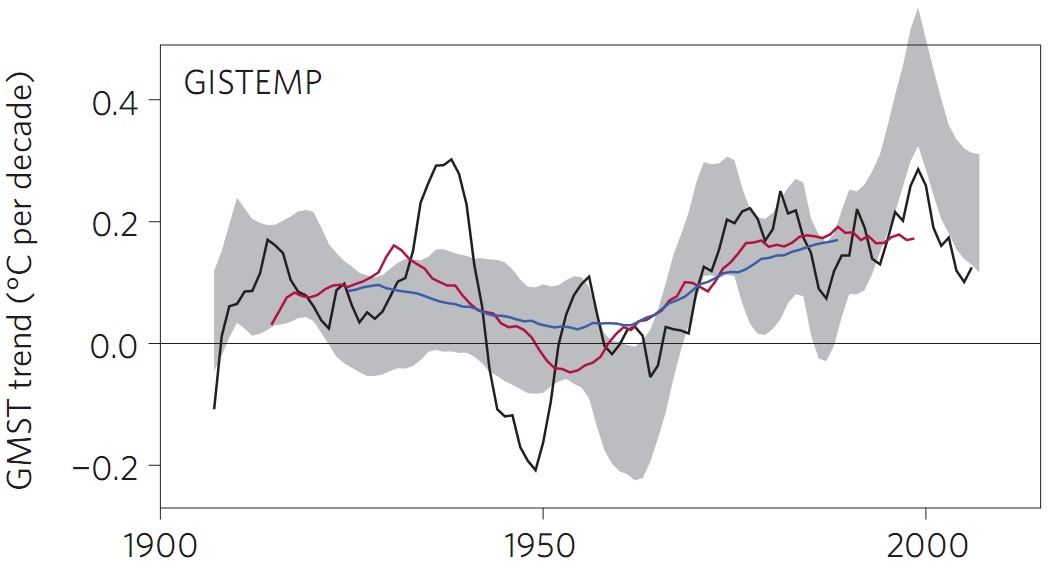
The black line is the running fifteen year trend, while the grey shaded area is one standard deviation from the mean of the CMIP5 running fifteen year trend. The clear dip in the predicted running fifteen year trend is easilly seen. More importantly, the GISTEMP running fifteen year trend skirts the botton of the 1 SD shaded area, showing that it is easilly within the 2 SD prediction zone. And if the data is within the prediction range of the model ensemble, the model ensemble is not falsified by the data. (Further discussion here.)
-
Bob Loblaw at 10:41 AM on 23 August 2016There's no correlation between CO2 and temperature
In post #106, Victor doubles down on his original list that he claims to support his statement that a "great many skeptics are in fact climate scientists" . In #106, he provides an additional list, this time of simply "climate scientists", and argues that many of those are also not "specifically identified as "climate scientists" per se". He seems to feel that this new list represents the same sort of qualifications as his original list.
What do the two Wikipedia pages say when you read them? Victor's original list starts with:
"This is a list of scientists who have made statements that conflict with the scientific consensus on global warming as summarized by the Intergovernmental Panel on Climate Change and endorsed by other scientific bodies.
whereas the new list starts with:
"This list of climate scientists contains famous or otherwise notable persons who have contributed to the study of climate science.
So, Victor's first list doesn't even claim itself that it lists "climate scientists", and his second list only covers "famous or otherwise notable persons who have contributed to climate science". [Note that some of the "skeptic" list names do appear on the second list.]
No wonder that Victor does not want to argue about who can "truly be regarded as a climate scientist". Again, the two links Victor provides do not say what he is implying they say.
The new link also has, near its bottom, a link to a List of Authors of Climate Change 2007: The Physical Science Basis. That Wikipedia entry begins with:
"This is a list of the 620 authors contributing to Climate Change 2007: The Physical Science Basis, which was the 996 page contribution of Working Group I to the IPCC Fourth Assessment Report.
So, just the IPCC report has 620 authors, compared to Victor's original list of 61 (living) skeptics. I think we can safely say that the IPCC report authors can be considered "climate scientists". I think we could also consider the list of authors contained in the references to that IPCC report to be "climate scientists", too, and the number will be far higher than Victor's list of "a great many skeptics".
In fact, we could decide to look at the peer-reviewed scientific literature to find out what "climate scientists" are saying about anthropogenic global warming - but we need not, as this has been done (and published). Skeptical Science has several posts describing such studies:
Consensus confirmed: over 90% of climate scientists believe we're causing global warming
If Victor wishes to argue against the existence of the overwhelming scientific consensus, as described in any of the above posts, then he should continue this discussion on one of those pages. (After reading the posts, of course.) This is increasingly off-topic on this page.
-
Tom Curtis at 10:32 AM on 23 August 2016There's no correlation between CO2 and temperature
victorag @106&111:
1) I excluded the majority of the list of "skeptical" climate scientists as climate scientists not based on their initial discipline, but their singular failure to have written even one peer reviewed paper on climate science, or in a few cases (Rob Carter comes to mind) the fact that their primary discipline and professional activity has been unrelated to climate science and the very few directly related peer reviewed articles they have written have suffered from rooky mistakes. Regardless even if we accept everybody on the list, you have completely ignored the primary thrust of my comment @104, unless your suggestion that "this post strikes me as extremely literal minded and even a bit pedantic" is a tacit acknowledgement that my explanation of the basics of English is correct, and that my orriginal charge that your claim that "a great many skeptics are climate scientists" is therefore literally false on any interpretation, but that you don't want to admit it.
2) Pay attention to the quotation marks. I quoted what you said. The second sentence in your quotation is my comment, and you have not responded to it.
3) Mathematics is a branch of logic (see Russell and Whitehead, Principia Mathematica, and also the Church-Turing thesis). It follows from this that all theories stated in mathematical form are theories by the logical definition. In fact, to not be a theory by the logical definition, a "scientific theory" would have to hold to be false at least some of the logical implications of its axioms/thesis.
I am beginning to note that indeed the "logic" you use in formal discourse is very different from formal logic. Formal logic remains, however, the fundamental principle underlying any rigorous proof; and by underlying probability theory, also any statistical "proof".
4) I don't see any point in going further on this. You are insisting that those "disproving at theory" need not provide any evidence for the positive claims they make in that disproof; and nor need they show that the theory they purport to falsify actually predicts the opposite of their purported falsifying index. Such a claim is nonsense, pure and simple.
Prev 454 455 456 457 458 459 460 461 462 463 464 465 466 467 468 469 Next


