


 Arguments


Recent Comments
Prev 470 471 472 473 474 475 476 477 478 479 480 481 482 483 484 485 Next
Comments 23851 to 23900:
-
Tom Curtis at 01:42 AM on 9 November 2016Watch: Before the Flood
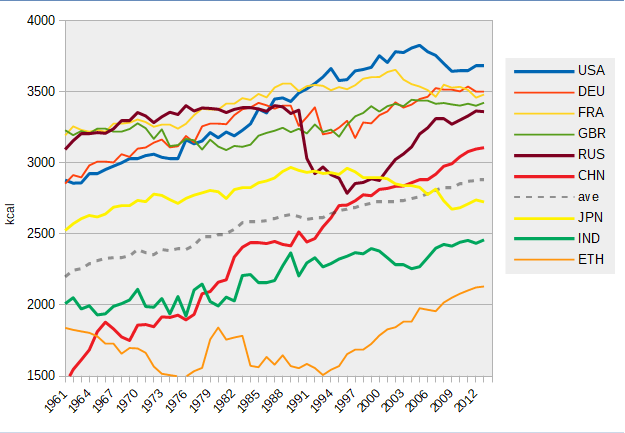
RedBaron @25 and 27, by talking about the potential size of the Soil Organic Carbon (SOC) reservoir as a sink for carbon emissions, you have changed the topic. Your evidence for the existence of a reservoir of that size is the purported loss of SOC to that extent due to agricultural practises, but in that event SOC loss represents have cumulative emissions approximately 4 times those from all other anthropogenic emissions. Worse, it means you need to find an additional 1550 GtC in known surface carbon reservoirs, ie, more than twice the size of the Dissiolved Organic Carbon reserervoir. Apparently over (at least) 800 GtC, having left the soils has "softly and silently vanished away" without going into any reserservoir.
Asked to defend these figures you point to a peer reviewed article which only claims a 50% topsoil loss for Iowa, not globally. That article further asserts that "per capita food supply has been reduced over that last 10 years [ie, 1985-1994] and continues to fall", whereas modern data shows the opposite:
It also claims that arable land is being lost at a rapid rate, but if so it is being gained at an even faster rate, for total arable land increased at a rate of 2 million hectares per annum from 1961-2013, while total agricultural land has increased at a rate of 10.6 million hectares per annum (FAO data). Further, the article does not directly discuss loss of SOC, and while its claimed 75 billion tonnes per annum of top soil lost from agricultural lands represents a problem, that loss is mostly from the 10.5% of the land area under cultivation. Most of that top soil would be deposited as silt in flood plains, or over land (if wind blown) so it does not represent the global loss of soil, still less that of SOC. In short, the paper does not appear to be reliable, and is certainly not directed to the point of discussion; on top of which you overstate its claims.
-
RedBaron at 18:41 PM on 8 November 2016Watch: Before the Flood
Read up on it.
The numbers are 20 years old. It's even worse now.
-
Glenn Tamblyn at 17:20 PM on 8 November 2016Watch: Before the Flood
RedBaron
Your numbers don't seem to add up. If carbon lost from the soils is 10 times what we see in the atmosphere, given that known human emissions from fossil fuels are only about 1/2 of what we can see in the atmosphere, that means that 10.5 times the visible extra in the atmosphere has gone somewhere else. 150 years isn't long enough for significant transport to the deep ocean so where could all that carbon be?- Upper levels of the ocean?
- Surface vegetation?
- Where?
No way the ocean could have taken up that much carbon and not be noticed. Gas exchange balance with the atmosphere would mean that concentrations in the atmosphere should be significantly higher. Or if it was organic carbon in the oceans, it would be visible. The graph Tom highlighted doesn't suggest anything like that level. And there is a balance between dissolved organic carbon in the ocean and marine biota. More DOC would produce huge blooms that metabolise a lot of it, converting it to inorganic carbon, entering the carbonate system and being detectable.
Your argument seems to violate mass balance.
What I would question, though I don't know the details, is the claim of 50% loss of topsoil in the last 150 years. Is that 50% of area or volume? Loss of top soil is certainly an issue - an oft quoted figure is 1/3rd of farmland is losing soil faster than it is created. But 50% already lost? Sounds too high. That would suggest that a reasonable proportion of the planet is back to bedrock.
Do you have a source for that number? -
RedBaron at 15:42 PM on 8 November 2016Watch: Before the Flood
Scaddenp,
Right then basically the same yields per acre but with no inputs and better soil carbon sequestration.
Tom,
Sorry but not sure what you are missing, Of the ~2,700 Gt of C stored in soils worldwide, ~1550 GtC is organic, which is approximately double the current atmospheric C which is ~780 GtC.
This in not counting soil carbon held in peat and wetlands (150 GtC), inorganic C in soils (950GtC) and in plant litter at the soil surface (50 GtC).
~1550 GtC is the current levels but 1/2 of the topsoil on the planet has been lost in the last 150 years. So the size of the sink would be at least ~1550 GtC or greater before we need to worry about saturation, with all the carbon in the atmosphere only ~780 GtC and all we need to remove? What? Maybe 150-200 GtC. So the sink is approximately 10 times larger than it needs to be.
So at this point the main factor is rate of flux out of the atmosphere and into the soil. i am guessing maybe 40 years or so. However, emissions would thwart that time frame, melting cathrates could too. And I am no expert but I am told the ocean which is now a sink would turn into an emissions source should we start drawing down atmospheric carbon.
So maybe we will need all of that spare sink capacity?
Ultimately my statement was not false. We are missing 10 times more carbon from our soils as there is extra in the atmosphere.
-
scaddenp at 13:07 PM on 8 November 2016Watch: Before the Flood
Redbaron, our average was 2.9 cow/ha in 2013 with 1060 kg/ha of milk solids, much of it on podzols. I dont see anything in your resources that doesnt sound like common practise here - except that now they get stocking increase with inputs as well. Irrigators are taking dairy into areas with 18-25" rain pa.
-
Tom Curtis at 12:02 PM on 8 November 2016Watch: Before the Flood
RedBaron @19, I did not assume you meant that all SOC lost had gone into the atmosphere, but it must have gone somewhere. The industrial emissions in CO2 concentratin equivalent since 1870 accounts for 100% of atmospheric increase plus 100% of ocean increase plus 9% of the land sink. Given that, to a first approximation, Land Use Change emmissions, only part of which is SOC, cannot exceed 93% of the Land Sink (or 63% of the atmospheric increase). Given that much of the LUC comes from deforestation, the SOC loss accounts for appreciably less than that.
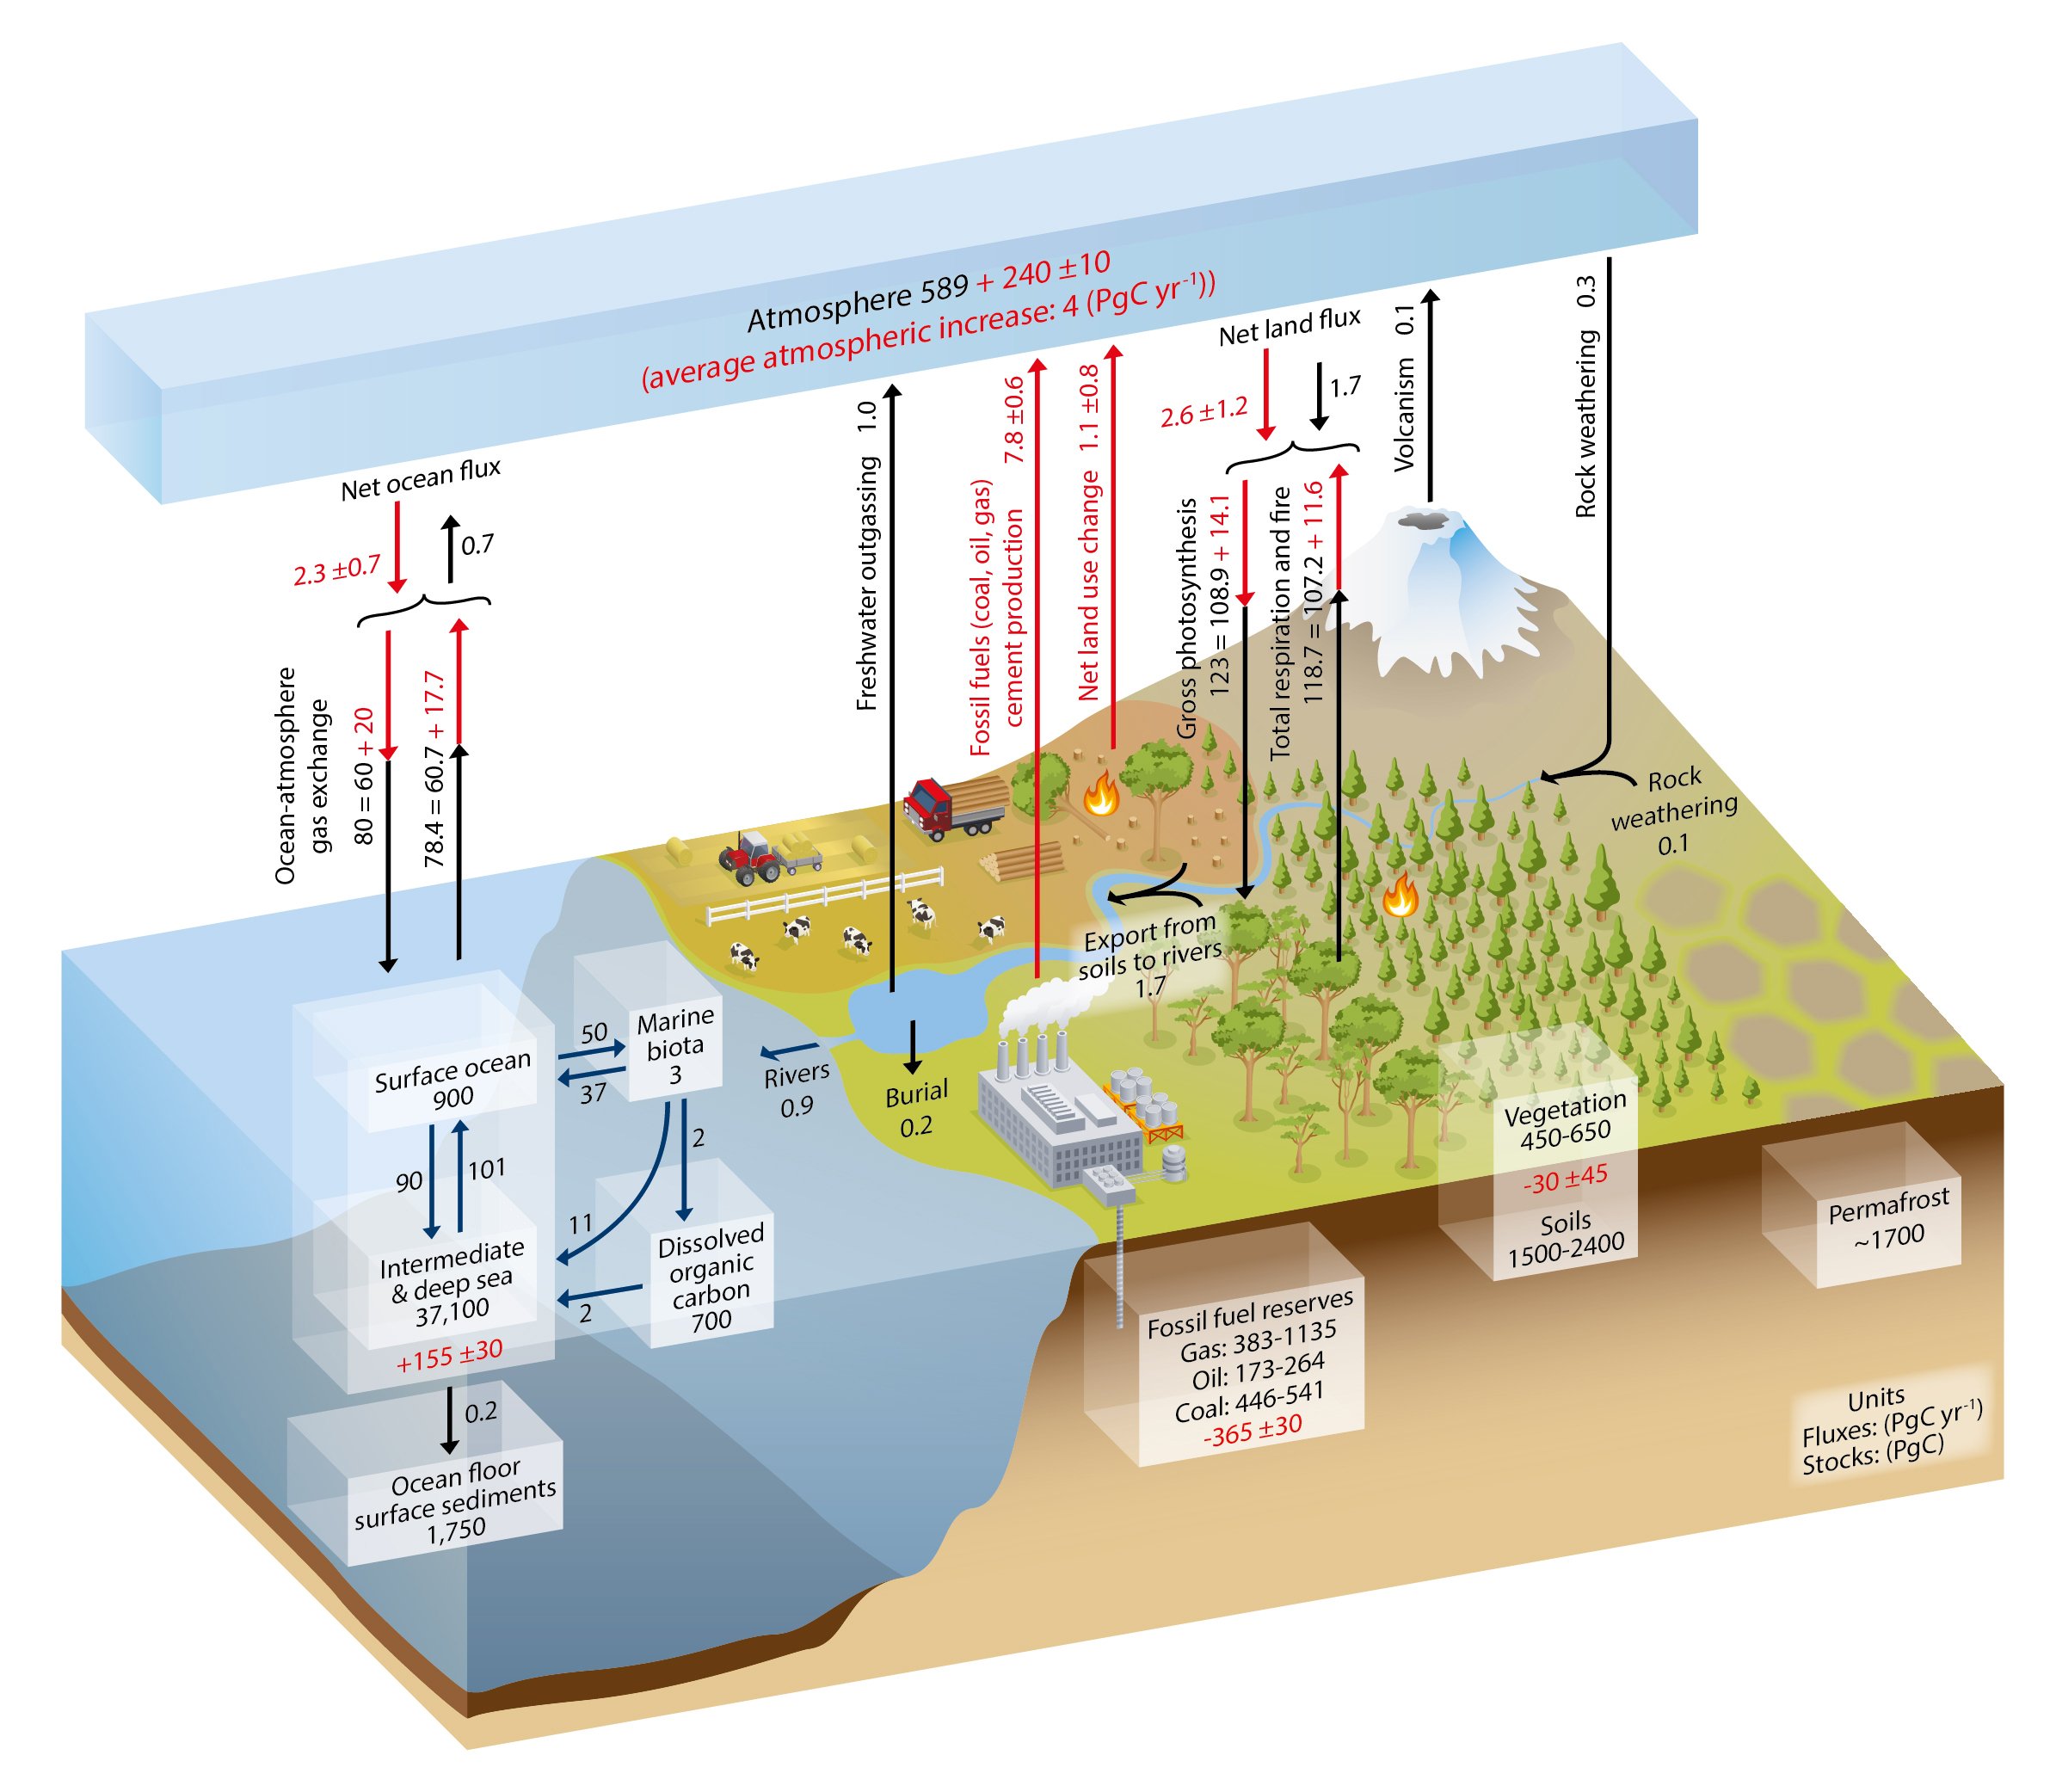
Strictly speaking, the Land Sink, Ocean DIC, and atmospheric CO2 are not the only sinks; and nor are anthropogenic sources the only sources. Allowing for these extra factors as per AR5 Fig 6.1, we can allow for 30 GtC being sequestered as ocean floor sediments and/or buried organic matter (ie, the raw material of future fossil fuels), but that is nowhere sufficient to make up the shortfall. Nor is the 3 GtC of Marine Biota (which is more likely to have declined than increased). The only other reservoir available is dissolved organic carbon, which the IPCC has as unchanged since the preindustrial, but which you require to have increased by 50% over that period for your claim to be true. Well, either that, or allow violations of conservation of mass.
Further, a large influx of dissolved organic carbon (of the order of 100 GtC over 150 years or less) would result in a large increase in DIC, with both showing as a significant change in δ13C; which has been shown to not have occurred by the sponge data. Given this, and absent any paper showing a large increase in dissolved organic carbon, your claim is shown to be false.
-
RedBaron at 11:31 AM on 8 November 2016Watch: Before the Flood
@21 scaddenp,
We are getting about 5X the stocking density using MIRG, than set stock rates. ie 400 cow days per acre in areas that typically get 80 cow days per acre. That's over 2 cows per hectare, almost 3. If you add chickens you get even more cow days plus eggs too. (chickens greatly improve pasture by eating parasites, grasshoppers and spreading manure) They are the clean up squad that follows a few days after the cows are off to another paddock. All this without a drop of nitrogen or irrigation and 30" annual rain.
-
villabolo at 11:00 AM on 8 November 2016President Trump would Make America Deplorable Again
@JonBo69,
If Trump wins the presidencey we know he's going to srew up the climate, but additionally I am also wondering what will happen to the funding of climate science and also the independence of the main scientific institutions and organisations seeing as they are all supposed to be involved in some socialist conspiricy to get people to pay more tax? Are we likely to see climate scientists face prosecution? Any guesses?
It is Republican senators and house members who want to do that and they will be emboldened by Trump who would facilitate them in any way possible. They most definitely will defund as much as they can and continue persecuting climatologists.
Also, as a Uk citizen, I've already started to think about what can be done if Trump wins and goes about implemnenting his denialist policies. I think there should be a call to boycott all American owned businesses - McDonalds, Starbucks etc and to have ongoing demonstrations outside of these places in every town and city.
I don't believe that either the governments of the UK or Europe will have the desire or the will to do those things. They will simply view the horror show from afar and hope it doesn't come their way.
Deities help us all!
-
scaddenp at 10:48 AM on 8 November 2016Watch: Before the Flood
"Do you have a case study where low input intensive was case studied but failed to work?"
I have case studies of low input intensive (and heavily managed grassland) that have been shown to "work" (maintain SOC), but not at the stocking intensities common in dairying here. It seems that in US land values are lower and stocking rates much lower and more emphasis on output per animal. SOC is regularly monitored all over the country in numerous farm management systems. However, increasing SOC is not a priority. Would only become one if it was somehow involved in increasing net$$ per ha beyond what is achieved with high input. With more protection being ordered for groundwater and rivers, that may happen, but present government will not act in way that would reduce farm incomes, particularly when milk prices relatively depressed.
-
RedBaron at 09:26 AM on 8 November 2016Watch: Before the Flood
Ps Addition to post #18
That should read,
I don't even know that this particular strategy of intensification has even been tried on your particular podzol. As far as I know, only extensive and high input intensive have been trialed side by side on your particular podzol. Do you have a case study where low input management intensive was case studied but failed to work on your particular podzol?
-
RedBaron at 09:06 AM on 8 November 2016Watch: Before the Flood
@17 Tom,
I think maybe you read that wrong Tom. I am not claiming that all the soil carbon lost can be found in the atmosphere. It has gone many places, mostly wind and water erosion...and some into the atmosphere as well. The point is to address saturation, not to deny the major influence of fossil fuel emissions. Even though BCCS in the soil doesn't have the same saturation level as industrial ag or biomass sequestration in forests. There would have to be some finite saturation point somewhere. We know that point has to be at least as high or higher than soils' SOC were prior to degradation due to agriculture. So taking those figures we know that before we fill up the soil sink "bucket", we will run out of extra CO2 in the atmosphere "bucket". So far the soil sink is still large enough. But if we keep burning fossil fuels at these ridiculously high rates, eventually even as large as the soil sink, it would no longer be large enough.
-
RedBaron at 08:50 AM on 8 November 2016Watch: Before the Flood
@15 Scaddenp
You said, "Intensification on traditional dairy areas by adding more fertilizer is also bad for SOC."
Exactly my point. There is intensification due to management changes using biomimicry as a model, and intensification with increased inputs of fertilizers. The first should theoretically be able to push through the SOC barrier you describe. The second never can and never will. Goes back to what I was describing above in post #7 where we have two sets of numbers. But to actually give you a case study to prove that? Not sure we have a case study on your type of podzol on the books as of yet, since although common where you are located, it is rare overall, as this is a relatively rare forest soil to find in dairy operations elsewhere in the world. I personally would contact Dr. Christine Jones from Australia, to see if she might know of one.
I know the strategy I would try. I could even set up a side by side case study by splitting your dairy farm into two and try one beside the other. Or even 3. But I simply don't have access to a case study good or bad under the narrowly defined criteria you require. I don't even know that this particular strategy of intensification has even been tried. As far as I know, only extensive and high input intensive have been trialed side by side. Do you have a case study where low input intensive was case studied but failed to work?
-
Tom Curtis at 08:48 AM on 8 November 2016Watch: Before the Flood
Red Baron @4, claims that:
"There is more carbon missing from the soil than extra in the atmosphere."
That claim, however, is inconsistent with actual records of changes in CO2 concentration, as, for example, those documented in the Global Carbon Budget 2015:

As can be seen, combined fossil fuel and cement manufacture contributions(189 ppmv equivalent) exceed the combined increase in ocean Dissolved Inorganic Carbon (DIC) and atmospheric CO2 (182 ppmv equivalent). The land use contribution, including that from plant matter and Soil Organic Carbon is less than the reduction due to reforestation in the northen hemisphere and the greenhouse fertilization effect. Extending the data back to 1850 shows cumulative land use change emissions to be just 68% of the increase in atmospheric CO2, with industrial emissions representing 174% of the atmospheric increase.
Further, measurements of C13 in sponges show there to have been no large influx of carbon into the atmosphere or ocean since 1350, other than that coincident with the rise of industrial emissions:

To clarrify what you are seeing, the atmospheric pCO2 show measurements from icecores and and mauna loa. The Jamaica, Shallow Water show measurements from sponges at a depth of approximately 25 meters, which being in the mixed layer are expected to track atmospheric levels fairly closely. Those from Pedro Bank (approximate depth of 125 meters) are below the mixed layer, and so should track ocean levels of DIC. None show a large perturbation prior to 1850, after which records of fossil fuel use show them conclusively to have been the largest contributor to the increase in atmospheric CO2.
In short, Red Baron's claim is simply inconsistent with what is known about the carbon cycle in recent times.
-
RedBaron at 08:23 AM on 8 November 2016Watch: Before the Flood
@12 John,
Nope I am not familiar with them. I did a quick skim. Seems pretty legit to me. I don't see any red flags.
-
scaddenp at 08:05 AM on 8 November 2016Watch: Before the Flood
Intensive RG has been backbone farm practise here since 1950s (Gallagher electric fence invented here in late 1930s with massive improvement by the Phillips fence in early 1960s), but latterly, world milk prices have given rise to dairy conversion from both crop and lowland sheep, using large-scale irrigation systems on what was dryland agriculture with lots of nitrate as well as RG. We manage very high productivity per ha with low costs (eg see comparison of US with NZ done by Wisconsin here) with these systems. Since yield per ha seems to be driving force, it is going to be hard to get better soil management established, except that this dairying does increase SOC significantly on places that used to be dryland cropping, but not elsewhere. Intensification on traditional dairy areas by adding more fertilizer is also bad for SOC.
-
nigelj at 07:42 AM on 8 November 2016President Trump would Make America Deplorable Again
Excellent article, and I couldn't agree more. Trump is in complete denial about climate change. Lets just hope sanity prevails tomorrow.
How did we get to the current sad state of environmental, political and economic affairs in the western world? I think its historical process that has basically crashed (almost like a computer crash) as follows.
During the post war period from 1945 - 1985 approximately western economies were protectionist and embraced welfare states, and this did work well in many regards. However the post war period became "top heavy" and hit a brick wall.
As a result we had the neoliberal market orientated reforms of the 1980s, financial deregulation, and embrace of free trade and very high levels of immigration. Some of this was definitely wise, but it essentially swung too far in some regards, and became a sort of economic religion that has lost touch with reality and ordinary folk.
Free trade has considerable merit, but has created some big losers in western economies, blue collar workers in particular.
We have failed to look after the casualties of globalisation with sensible government policies, and so people like Trump have tapped into their frustrations. However Trumps policies will just make things even worse. Brexit is a similar phenomenon.
The failure to mitigate the downsides of neoliberalism have allowed the crazy people to gain control, or get close to it.
And crazy people, fascists, demagogues, conspiracy theorists, and haters of liberalism and government programmes will be likely to be climate change sceptics. It goes hand in hand.
-
RedBaron at 07:32 AM on 8 November 2016Watch: Before the Flood
@13 scaddenp
Now that request is much much easier! Not only can you eliminate nitrogen fertilizers in a dairy system, your yields can even go up! Like before I will start with the easy to understand video to let you see the concept, then another like to a dairy manual and case study info at the USDA.
Trantham's Sustainable 12 Aprils Dairy Grazing Program: A Top Farm that Almost Went Under
12 Aprils Grazing Dairy Manual
And there is a different method used that also yields more per acre, but a bit less per cow by pure MIRG that doesn't need nitrogen fertilizers. Useful if you don't have a no-till planter useable for planting into sod.
Pastures for Profit: A guide to rotational grazing.
What a lot of those guys do is raise something else to make up for the increase in forage while the yields per cow slightly drop. Something like sheep or beef. Or in some cases instead they let some go back for a season for wildlife, similar to this:
Grassland birds: Fostering habitat using rotational grazing
One thing for certain though. I am quite confident the issue as to why the dairymen in your area are failing to continue to sequester carbon is the nitrogen they are using. There is absolutely no need for nitrogen ever in a dairy operation. It actually is counter productive as Tom found out only after he was forced to stop using it due to bankruptcy. Same thing Gabe found out too with his beef and corn operation. Same thing I am finding out with my vegetable research.
There is also one more option available for you if you are willing to expand beyond just dairy. You could try pastured eggs. Now this guy raises beef, but some of his graduated intern students use the exact same system, but with dairy and laying hens combined:
-
scaddenp at 06:43 AM on 8 November 2016Watch: Before the Flood
Thank you RedBaron. That goes a long way to explaining the dissonance between what is published and talked about here, and what you claim for US agriculture. Podzols are all we have.
Like Digby, I have got a lot of reading to do just from the reference list of the Savory paper you linked to. Now, how about an approach to dairying that isnt treating the soil as a hydroponic medium while pouring nitrates into river and groundwater...
-
John Hartz at 06:17 AM on 8 November 2016Watch: Before the Flood
Red Baron:
Out of curiousity, are you familiar with the work of the International Center for Biosaline Agriculture (ICBA)?
-
John Hartz at 04:54 AM on 8 November 2016President Trump would Make America Deplorable Again
JonBo69: I personally believe that your questions/concerns about what Trump will do as President on the climate change front will be rendered moot after the votes are tallied tomorrow and Hillary Clinton is declared to be the "President-elect."
-
Jonbo69 at 04:11 AM on 8 November 2016President Trump would Make America Deplorable Again
I have posted the following comment elsewhere but am reposting as this is a more relevent thread. Ireceived a partial reply, but seek further opinions:
If Trump wins the presidencey we know he's going to srew up the climate, but additionally I am also wondering what will happen to the funding of climate science and also the independence of the main scientific institutions and organisations seeing as they are all supposed to be involved in some socialist conspiricy to get people to pay more tax? Are we likely to see climate scientists face prosecution? Any guesses?
Also, as a Uk citizen, I've already started to think about what can be done if Trump wins and goes about implemnenting his denialist policies. I think there should be a call to boycott all American owned businesses - McDonalds, Starbucks etc and to have ongoing demonstrations outside of these places in every town and city.
-
Digby Scorgie at 19:40 PM on 7 November 2016Watch: Before the Flood
RedBaron @9
Cor blimey, mate! You've given me a lot of homework! I'm going to be off the air for quite a few days while I digest this!
-
RedBaron at 15:23 PM on 7 November 2016Watch: Before the Flood
@8 scaddenp,
I think that would be an almost impossible task, since podzols are primarily forest soils. So right off the bat, just being in grass shows it most likely was degraded already when the forest was removed. BCCS would basically use that as pasture only until the topsoil recovered, then reforest it if possible.
Now for years it was thought impossible to ever convert a podzol into a mollic soil. I did hear a soil scientist in a lecture claim almost as an aside that this is no longer the case. But he didn't provide a case study or published paper, so I have no way to pass that along to you.
-
RedBaron at 14:47 PM on 7 November 2016Watch: Before the Flood
@Digby Scorgie,
Agreed with pretty much everything you said! We do have to have a clear vision, and it must use technology available right now! You are absolutely correct. Since you are unfamiliar, let me give you double sets of examples, first to show you what it can look like, and gradually ease into a more scientific analysis.
Lets start with Beef (although it applies equally for all large grazing herbivores)
How to green the world's deserts and reverse climate change | Allan Savory
Restoring The Climate Through Capture and Storage of Soil Carbon ... White Paper
Next lets add wheat and most small grains. Here is what it looks like and analysis of case studies.
Why pasture cropping is such a Big Deal
Liquid carbon pathway unrecognised
Next rice
The System of Rice Intensification (SRI)… … is climate-smart rice production
JOURNAL ARTICLES ABOUT THE SYSTEM OF RICE INTENSIFICATION (SRI)
And even though probably the most significant gain is in NOT growing so much corn, (at least 50-70% less) there still is a need for SOME corn. So to do that requires a kind of integrated hybrid system between the modern industrial and regenerative models.
Gabe Brown: Keys To Building a Healthy Soil
Innovative No-Till: Using Multi-Species Cover Crops to Improve Soil Health
I actually could go on and on for every little crop, but hopefully you have a clear picture of the principles in your mind now, and can see the pathway forward. There are actually a few minor gaps still, but nothing substantial enough to limit the potential of this mitigation strategy. Like the movie correctly stated, things like vegetables are about 1% or so. The big ones covering the majority of land are covered with the posts above.
-
scaddenp at 14:07 PM on 7 November 2016Watch: Before the Flood
Can you point me to a paper showing net SOC from MIRG operating on a podzol that wasnt degraded by cropping before the trial started? Podzols are what we have and no one here can point to any SOC increase from any dairy operation except short term gains on degraded soils.
-
RedBaron at 13:10 PM on 7 November 2016Watch: Before the Flood
@Scaddenp,
Not only am I familiar with both those studies, I happen to agree with them. In fact I was stating that very thing long before the studies came out! As I have stated elsewhere here at this forum, that's why we have two sets of numbers, with very different calculated ranges of mitigation potential. Those two sets of numbers corresponding to the potential for industrial ag to mitigate AGW, and the potential for regenerative ag to mitigate AGW. There are fundamental differences that are profound with regards to ecosystem function.
Industrial ag is based on a net sum zero production model. Regenerative ag is not bound by this, as it is a complex biological model. Just to give an example pertinent to the movie. Methane. In the industrialised production model we have now we can improve methane emissions by careful manure handling and collecting methane as a biogas fuel. But at the absolute MAX the best we could even even theorectically do is collect 100% of the methane cows emit. Grass fed beef in a properly managed MIRG system has the potential to offset 100% of all cow emissions plus a substantial % of emissions from other sources due to increased biological oxidation of methanotrophs in the soil that grow and maintain themselves at concentrations lower than atmospheric. That's just one example to iilustrate the point.
The subsurface location of methanotrophs means that energy
requirements for maintenance and growth are obtained from
CH4 concentrations that are lower than atmospheric Soil Microorganisms as Controllers of Atmospheric Trace Gases (H2, CO, CH4, OCS, N2O, and NO) RALF CONRAD* Max-Planck-Institut fu¨r terrestrische Mikrobiologie, D-35043 Marburg, GermanyIn realistic terms that means the best we could ever hope for without fundamental changes in the production models would top out around 18-20%. Although some unrealistically optomistic studies top it out at nearly 60%. I have doubts it could ever reach that high. Maybe.
But change the production models and we get very different numbers starting at 62% min and going all the way up to 250%+. BCCS is just a completely different approach that doesn't function in the same way as the systems those links you posted function.
-
scaddenp at 11:17 AM on 7 November 2016Watch: Before the Flood
I dont want to knock good farming practises and advantages to climate from that but I am still skeptical about claims being made. Are you aware of these Powlson paper RedBaron?
and
"Limited potential of no-till agriculture for climate
change mitigation"Both suggest the advantages are being oversold. Perhaps we need some food labelling to indicate whether the farm source is managing to increase SOC?
-
Digby Scorgie at 10:59 AM on 7 November 2016Watch: Before the Flood
RedBaron @4
That's an interesting way of putting it. However, for someone like me who is ignorant of agricultural practices, it might be more enlightening to read a description of future practices as changed to be indefinitely sustainable and how these differ from current practices.
This reminds me of systems engineering. I worked with systems engineers for part of my career and I learnt a little about the discipline in the process. Regarding the above, two systems-engineering lessons seem to apply:
The first lesson is that one has to have a clear vision of what it is one is attempting to build, or in this case, establish — hence my first point above. As my erstwhile colleagues put it, "If you don't know where you're going, any road will get you there." So describe how the farmers of the future in the various branches of agriculture go about their business. How does this differ from today? One can't get from A to B if you don't know what B is.
The second lesson concerns technology. Whatever one sets out to build, one should only rely on currently available technology. To get from the A of current practice to the B of future practice, one cannot assume use of a technology that has not been shown to work. But I should imagine one would have to exclude any technology that relies on the burning of fossil fuel.
Perhaps what I ask has already been done. If so, I've not seen it in any of the generally available news sources. If not, well, that would be an interesting project for someone with the relevant expertise, would it not?!
-
RedBaron at 06:04 AM on 7 November 2016Watch: Before the Flood
I actually like the movie. However, as expected the "backlash" from getting agricultural science wrong is in fact happening as I predicted. It is much like the backlash on energy fueling denialism. (pardon the pun) So to try and counter in some small way this nuance, I compiled a mock interview will many of the agricultural "giants" that are influencing using regenerative agriculture as a biological carbon capture and sequestration (BCCS) mitigation strategy. Most these viewers are not farmers or scientists, and quoting scientific studies or facts seems to fall on deaf ears. But hopefully this may have an effect. It seems to have in at least some cases.
“As the small trickle of results grows into an avalanche — as is now happening overseas — it will soon be realized that the animal is our farming partner and no practice and no knowledge which ignores this fact will contribute anything to human welfare or indeed will have any chance either of usefulness or of survival.” Sir Albert Howard - father of organic agriculture
So yeah we need those animals on the farm.
But why are they a problem?
“The number one public enemy is the cow. But the number one tool that can save mankind is the cow. We need every cow we can get back out on the range. It is almost criminal to have them in feedlots which are inhumane, antisocial, and environmentally and economically unsound.” Allan Savory
So that is the problem? The feedlots and the vast acres of monoculture corn and soy supplying them. Why are those bad?
"We try to grow things that want to die, and kill things that want to live. That is pretty much how (industrial) agriculture functions." Colin Seis
Oh I get it, pesticides!
But I heard pesticides are safe, why would killing a few weeds and grasses and insects fungi etc. be a problem? Who cares about a few bugs, and worms?
“It may be doubted whether there are many other animals which have played so important a part in the history of the world, as have these lowly organized creatures.”
- Charles Darwin 1881What about weeds?
A flower is an educated weed. -Luther Burbank
OK I get it. We define whether something is a pest or not. In a different context a pest could be beneficial, as flowers are food for bees and pretty too. But wouldn't it be expensive? I like organic foods but the price at the market seems a bit higher.
"Ecosystem function is vastly more valuable than the production and consumption of goods and services." -John D. Liu
So would changing the way we do agriculture help?
“Yes, agriculture done improperly can definitely be a problem, but agriculture done in a proper way is an important solution to environmental issues including climate change, water issues, and biodiversity.”-Rattan Lal
Solution? That's pretty strong words. Even as big a problem as climate change? How can that be?
"The answer lies in the soil." - Fred Streeter
The soil? Really?
To forget how to dig the earth and to tend the soil is to forget ourselves. ~Mahatma Gandhi
Wait! That's philosophy! I mean in practical terms!
"The nation that destroys its soil destroys itself." - Franklin D. Roosevelt
What's so special about the soil besides the worms Darwin talked about?
“When you increase organic matter, good things happen.” -Jay Fuhrer
What good things?
"When farmers view soil health not as an abstract virtue, but as a real asset, it revolutionizes the way they farm and radically reduces their dependence on inputs to produce food and fiber." -USDA
OK, I think I am starting to see how these are connected. Less pesticide inputs and the important creatures survive and can do their job! What would that radical change look like? How is agriculture done differently? Is it just the cow? Or can this work for other animal species?
"The pigs do that work (by rooting in the forest and that creates the temporary disturbance on the ground that allows germination for higher successional species.) And so it allows for those pigs to be not just pork chops, bacon, and that. But now they then become co-conspirators and fellow laborers in this great land healing ministry ... by fully respecting the pigness of the pig." Joel Salatin
That's interesting, the pigness of the pig! So how would we figure out the pigness, cowness, chickeness, or even the tomatoness and wheatness or any other of our agricultural foods?
"Permaculture is a philosophy of working with, rather than against nature; of protracted & thoughtful observation rather than protracted & thoughtless labor; & of looking at plants & animals in all their functions, rather than treating any area as a single-product system." Bill Mollison
I think I get it now! It took the greatest minds in the history of sustainable agriculture. But now I understand what to look for when grocery shopping! Thanks so much everyone!
There is more carbon missing from the soil than extra in the atmosphere.
So forget about the guilt trip. If the meat and vegetables you eat are raised properly on land that is increasing in organic carbon, you'll actually be helping mitigate climate change with every bite!
-
US Passenger Vehicle Emissions Comparable to 1980 Mt. St Helens Eruption Occurring Every 3 Days
Hi William, I like your suggestions and will look into drawing the 2nd. Your first suggestion my be covered already by one of our illustrations here:
Human vs natural CO2 emissions
The first diagram in this post is based on the graphic I've linked to.
-
John Hartz at 03:35 AM on 7 November 20162016 SkS Weekly Climate Change & Global Warming News Roundup #45
Jonbo69:
Check out:
Trump just proposed ending all federal clean energy development
He’d end all research on solar, wind, efficiency, batteries, clean cars, and climate science, too.
by Joe Romm, Think Progress, Nov 4, 2016
-
francis @ uea at 02:32 AM on 7 November 2016New research from last week 11/2012
The original article (not just the summary in Wollny) is at http://www.biodiversitylibrary.org/item/100637#page/367/mode/1up It's 17 pages long, by Andrée as mentioned earlier by Doc Snow at 03:48 AM on 23 March 2012, and in German.
-
Jonbo69 at 02:30 AM on 7 November 20162016 SkS Weekly Climate Change & Global Warming News Roundup #45
If Trump wins the presidencey we know he's going to srew up the climate, but additionally I am also wondering what will happen to the funding of climate science and also the independence of the main scientific institutions and organisations seeing as they are all supposed to be involved in some socialist conspiricy to get people to pay more tax? Are we likely to see climate scientists face prosecution? Any guesses?
-
bozzza at 19:26 PM on 6 November 2016Tracking the 2°C Limit - September 2016
In Leonardo DiCaprios movie he talked about a certain thickness of ice that had melted off Greenland.
That sounded like the scariest part of the movie to me: but was it true?
-
bozzza at 19:24 PM on 6 November 2016Tracking the 2°C Limit - September 2016
PluviAL, in short I agree enitrely: science is heavily political but it always was.
The people lead: Governments follow! This is what we all don't realise yet the media moguls know that our lack of information as a general public is the key to the status quo continuing to buy our representative governments.
-
bozzza at 18:19 PM on 6 November 2016US Passenger Vehicle Emissions Comparable to 1980 Mt. St Helens Eruption Occurring Every 3 Days
All you need is a graph on global sea ice... highlighting 2016 against the sattelite record.
-
Tristan at 17:48 PM on 6 November 20162016 SkS Weekly Climate Change & Global Warming News Roundup #45
You missed the most important news, from Malcolm-Ieuan: Roberts., the living soul.
"I am very proud to have invited Canadian Dr. Tim Ball, Tony Heller (AKA Steve Goddard http://ow.ly/j3rq305NUEP) and Jennifer Marohasy to appear at a climate seminar at Parliament House next Tuesday evening."
Where apparently he'll be "will be announcing his report on the Climate Science evidence of CSIRO".
That'll teach those pesky actual scientists!
-
nigelj at 06:25 AM on 6 November 2016US Passenger Vehicle Emissions Comparable to 1980 Mt. St Helens Eruption Occurring Every 3 Days
William @3, I totally agree. However you can imagine what the deniers will say. "Volcanic emissions of CO2 in recent decades are underestimated, the figures are junk science concocted by people promoting big government (or some other ulterior motive, or grand and completely silly conspiracy theory).
-
PluviAL at 04:34 AM on 6 November 2016Tracking the 2°C Limit - September 2016
I see it more dire: Science is documenting frightening trends, scientific professionalism depending on sustention of credibility, must systematically emphasis prudent conservative interpretations, especially in light of ruthless backlash, and backstabbing, by economic interests leveraged in politics; the result is constant error on the conservative side. What this means is that we will always find surprises on the negative side, because science would not err on the pessimistic side on this issue; we see it in IPCC reports every time.
My pessimistic interpretation, is that we will find strange extremes, like that tectonic motivation is affected, maybe primarily motivated by ice, and water loads choreographed by lunar gravitation. I know I am being the lone-deranger on this lightly held hypothetical-theory, but it’s an illustration of the strange surprises to expect.
-
william5331 at 03:59 AM on 6 November 2016US Passenger Vehicle Emissions Comparable to 1980 Mt. St Helens Eruption Occurring Every 3 Days
The graphic was great. None of the deniers will read the text and few would understand if they did. How about two more graphics. a) The total yearly emissions from all geological sources vs the total yearly emissions of us and b) Our yearly rate of emissions vs the rate of emissions during the laying down of the Siberian traps. Then we can send this to our denier friends in a form they can comprehend.
-
PluviAL at 03:14 AM on 6 November 2016Watch: Before the Flood
Mired in desperation, while buoyed by tears of joy in the hope in the heroic efforts and achievements, this video is a delicious way to welcome one more day in which contribute my little bit to help, especially as my 3 year-old worked herself into my lap to watch the saving of, or destruction of her world. Thanks for finding this, and for all the effort SkSc contributors make toward this critical comunal effort; this is what all the statistics and arguments offered in SkSc really mean.
-
Tom Curtis at 01:43 AM on 6 November 2016US Passenger Vehicle Emissions Comparable to 1980 Mt. St Helens Eruption Occurring Every 3 Days
Joel_Huberman @1, your source suggests the Siberian Traps released 30,000 GtC of CO2 over the period of its erruption, ie, over a period of over a million years, representing an annual emission rate of around 0.03 GtC per annum. In contrast, since 1850 humans have emitted 560 GtC at a mean annual rate of 3.4 GtC. Since 1965 (ie, over the last 50 years for which we have published data), we have emitted 370 GtC at 7.4 GtC per annum. Since 2010 the average annual emission rate has exceeded 10 GtC per annum. In short, we are emitting CO2 at rates that far exceed those during the deposition of large igneous provinces.
-
Joel_Huberman at 00:51 AM on 6 November 2016US Passenger Vehicle Emissions Comparable to 1980 Mt. St Helens Eruption Occurring Every 3 Days
Interestingly, the Large Igneous Provinces (LIPs; massive, long-time volcanic activity) that have been associated with major extinction events in our planet's geologic/biologic history have released multiple thousands of gigatons of CO2 over their lifetimes. If we humans are releasing 46 gigatons per year, I suspect that we're emitting CO2 at a rate comparable to that of LIPs--natural events that wiped out large portions of extant species.
-
roc2ud at 00:30 AM on 5 November 2016Watch: Before the Flood
Just finished this up last night. The weather station in Greenland is possibly the most disturbing.
It reminded me of when my parents and I vacationed in the Northwest and we visited Glacier National Park. At the time (I don't know if they still do this 20 years later) they had a series of signs that posted were the glacier extent ended. So of course, the signs just kept going back farther and farther. I don't think I appreciated at the time that the glacier was disappearing; I probably thought it would come back eventually (within my lifetime), but that clearly was my young ignorance.
-
Digby Scorgie at 16:11 PM on 4 November 2016Watch: Before the Flood
My wife and I watched the film together. Afterwards we were musing on the corporations, politicians and media that are complicit in the campaign to sabotage climate action. Her comment was that these guys don't have their heads in the sand, they have their heads in the tar sands! Hmm, I wonder if there's a cartoon in that!
-
sauerj at 14:25 PM on 4 November 2016Barack Obama is the first climate president
Tom @3: Thanks for your feedback. 1) On mandatory %renewable requirements on energy consumed, I still worry that the ratio of btu per capita will simply go up in step w/ reductions in %FF/total consumed energy. We will consume energy with whatever money we have available; as prices drop, we will use more. Net effect: no reduction in carbon emissions, until higher prices drive industry & markets to lower cost solutions. 2) Cap & Trade is a viable solution (Shi-Ling Hsu rates it as #2 best option in Case for Carbon Tax), but he & Hansen's complaints seem logical, a) not as effective as free market cost, leakage likely, b) arbitrary carbon ceiling limits likely lower industry's cessation potential, c) middle-man economic burdens. 3) Agree that 100% fee & dividend may be hard to pass, and sadly the end result may instead be some sort of payroll tax offset (like mentioned on Dicaprio's recent BTF video). Yes, this would not have the broad reaching efficacy as the full CCL CFD proposal. But, what is missing is not getting congress to act, what is missing is political will from the public (but I would be naive to think that is an easy nut to break, but the growing Climate Solutions Causcas, with 20 & growing congress members, gives one hope).
Lastly, it is likely that I believe in CFD so much because Hansen gave such a convincing argument for it (& its simple logic) in his Storms book, which was my first indepth introduction to AGW science.
John @4&5: Thanks for your feedback. 1) Pre Mar-2016 (when I joined CCL), 18 hits came up for 'Citizens Climate Lobby', but only 6 of these 18 articles had any real mention of CCL (others were only CCL authors or the word 'Citizens' separately or no mention of CCL at all, not sure why they were hits). What I was thinking about was an article with CFD and CCL blaringly in the title. 2) But, alas, I admit, I was wrong! One of these 18 articles (HERE, dated 6-18-2013, by Dana) was all about CFD and CCL. A very good promotional article, with CFD and CCL blaringly in the title! Thanks SkS for promoting CCL at that time; I am sorely sorry that I missed the opportunity it gave me then. Although, at that time, there was no CCL chapter in my town. Now, there are chapters in almost every district. Maybe it would be good to occasionaly re-run this article as it is very good, and may help other people like me to connect the dots & get involved. 2) Dana's concluding paragraph was so apropos to my situation. Here is how I think many the average reader (like me) feels: Struggles for some way to help, some way to get involved. Extremely depressed because he/she has come to realize that everything he/she has ever done their whole life (30+ years, in my case, of engineering over $100 million of manufacturing expansions) was all based on wrong economics and therefore was all wrong! And, more so, realizes that he/she can't do any real good now because they are enslaved by the status quo, as their family's subsistence depends on abiding with the status quo. There really isn't much a person like this can do but lie to their colleagues thru-out the work day and feel, deep down, that all they are really doing is screwing the people of the future. 3) I am sure that the SkS vision includes empowering individuals like this to get involved in as effective ways as possible; after all, it all boils down to getting carbon emissions down, using any good means possible. Now, based on my readings, I had assumed that all would have agreed that CFD is king, and that everything else is less effective, hence my frustation why CFD and CCL isn't promoted more. (My error, as I see now that there was in fact one such good article). Maybe I'm not so right on CFD being king, but one thing is true, the CCL organization is extremely talented, organized and wise. And, it gives a person, like me, something (powerful I think) to finally work for, and that makes all the difference. Now my life is not a complete contradiction of my morals. For this reason of citizen empowerment, I would hope that SkS would repeatedly rally to promote CCL, and its effective vision of CFD, its depth of talent & passion, its deep organization and the grace of its spirit. There may be many a person, like me, still out there that may need a smack over the head, i.e. an article that connects the dots and says in blaring letters: 'Go Here to Help!'
-
nigelj at 13:27 PM on 4 November 2016Barack Obama is the first climate president
Tom Curtis @3, I can't fault your logic and cap and trade makes a lot of sense in theory, however I have one reservation related to the politics. Firstly my understanding is cap and trade involves globally trading emissions permits and forestry credits, etc. You do realise that the integrity of those permits etc would be very suspect given the nature of many of the countries in this world and their institutions?
If it all goes wrong by the time we work out what's really happened, global warming will be well beyond 2 degrees. Global cap and trade seems a bit idealistic. Other systems to reduce emissions just seem more transparent to me.
By the way I was a fan of cap and trade when it was first proposed in my country, as it seems to push some responsibility back onto markets. It's just doubts have crept in and markets sometimes work in sub optimal ways.
-
amhartley at 11:30 AM on 4 November 2016Debunking climate myths with Leonardo DiCaprio's Before The Flood
https://www.beforetheflood.com/ says the film will be available for free on Natl Geog channels until 7 Nov.
-
John Hartz at 08:26 AM on 4 November 2016Barack Obama is the first climate president
Recommended supplemental reading:
5-4-3-2-1: Counting Down Obama’s Legacy on Climate Resilience by Christina DeConcini & C Forbes Tompkins, World Resouces Instittue (WRI), Nov 2, 2016
-
John Hartz at 08:20 AM on 4 November 2016Barack Obama is the first climate president
sauerj: You are critical of SkS for not promoting the Carbon Fee & Dividend (CFD) advocated by the Citizens' Climate Lobby. Doing so would not be consistent with the stated purpose of SkS as set forth in the "About" section of this website. You can access the SkS purpose statement by clicking on the "About Us" button located on the bottom of this webpage.
Prev 470 471 472 473 474 475 476 477 478 479 480 481 482 483 484 485 Next


