


 Arguments


Recent Comments
Prev 474 475 476 477 478 479 480 481 482 483 484 485 486 487 488 489 Next
Comments 24051 to 24100:
-
John Hartz at 03:12 AM on 18 September 2016BBC climate coverage is evolving, but too slowly
Art Vandelay:
Pronouncements of psuedo-science poppycock by climate science deniers does not constitute news!
-
Art Vandelay at 23:37 PM on 17 September 2016BBC climate coverage is evolving, but too slowly
In fairness to BBC, what needs to be considered is that the BBC is constrained by charter to present news with impartiality, and the examples above by Dana181 all appear to be in compliance with the charter. The BBC is not offering 'opinion' here but rather is presenting 'news'.
If Dana is arguing that the BBC should be an arbiter or censor of news, it would likely be in violation of the charter.
-
C.Sheen at 22:16 PM on 17 September 2016Greenhouse effect has been falsified
https://scienceofdoom.com/156. Tom Curtis at 07:01 AM on 25 July, 2016
You are right, it is correct to divide by four for an approximation of earth temperature as a blackbody. If one uses the irradiation combined with albedo, you get a correct energy balance.
That´s how we calculate what a body radiates to space. But I agree with fake reality that it should not be used as a surface temperature for solid mass. It is the temperature that a blackbody had when it is totally isentropic, the same temperature throughout it´s whole body, It should also be absorbing and emitting all radiation at it´s surface, which would be at the top of the atmosphere, or the point where 1370W-albedo is the mean flux.
Since we are dealing with a sphere, and it is only irradiated on half the surface area, and we know that convection and conduction dominates the surface exchange, we should use radiant energy density instead. It has the units J/m^3 and for a sphere we get that by dividing the fluxdensity with 4/3pi*r^2 instead of 4pi*r^2. It is done for all volumes in contact via surfaces, so for the earth surface it is done twice, once for the atmosphere and once for the solid surface.
In wikipedia we can read:This article is about energy per unit volume.
Energy density is the amount of energy stored in a given system or region of space per unit volume or mass, though the latter is more accurately termed specific energy. Often only the useful or extractable energy is measured, which is to say that chemically inaccessible energy such as rest mass energy is ignored.[1] In cosmological and other general relativistic contexts, however, the energy densities considered are those that correspond to the elements of the stress–energy tensor and therefore do include mass energy as well as energy densities associated with the pressures described in the next paragraph.
Energy per unit volume has the same physical units as pressure, and in many circumstances is a synonym: for example, the energy density of a magnetic field may be expressed as (and behaves as) a physical pressure, and the energy required to compress a compressed gas a little more may be determined by multiplying the difference between the gas pressure and the external pressure by the change in volume. In short, pressure is a measure of the enthalpy per unit volume of a system. A pressure gradient has a potential to perform work on the surroundings by converting enthalpy until equilibrium is reached."
https://en.wikipedia.org/wiki/Energy_density
When circumstances is that the energy exchange is dominated by conduction and convection at a surface, this is the preferred way to address the energycontent of the solid surface, which is the cause of the surface temperature.When dividing 1370W by 4/3 two times we get an absorbed amount of 770W/m^3. Like I pointed out earlier, earth only gets energy on half the surface, we need to distribute the energy absorbed to twice the volume of the sphere. That can be done in several ways, but dividing by two works good. Half the surfacemass is excited to a level equal to the mean total surface mass constantly. 2m^3 will radiate what is absorbed in 1m^3. That gives us 385W/m^3 radiated through 1m^2. Which is in line with observations.
Then we can find out what earth radiate to it´s outer shell from dividing by four, then we get the atmospheric window of 96W/m^2.
The effective temperature, the energy balance, is then 342W/m^2 for TOA-radiation. And the balance for the surface and atmosphere is 256W/m^2. The TOA-temperature we get from substracting 256W/m^2 from 385W/m^2, which becomes 128W/m^2. This is all done with simple geometry and such a simple solution seems to be correct. Especially considering what my wiki-link says, that it can be connected easily to pressure, magnetic field, enhtalpy etc. as well as W/m^2 and Kelvin. It accounts for mass, volume and the relative energy.
It seems that weather and climate are only products of geometrical functions and solar radiation.
I think your model of radiation, energy and the earth is lacking quite a bit.Moderator Response:[DB] For those wishing to do so, one can also delve into the nitty-gritty details of the mathematics of the physics and chemistry of climate change at the website, The Science of Doom.
-
BBHY at 21:55 PM on 17 September 2016BBC climate coverage is evolving, but too slowly
Personally, I would be fairly happy if they just made this one simple change:
" It releases carbon dioxide, which is blamed for global warming because it readily absorbs infrared heat energy."
That way the reader does't just write-off the statement as, oh well, some blame CO2 and some don't. The reader understands immediately that there is an established physical link between CO2 and heat. If it absorbs heat, then even the most casual reader can see right away that it is entirely reasonable to expect CO2 to cause warming.
It also makes the reader question; if it absorbs heat then why does Trump think it doesn't cause warming? It puts the doubt on Trump's (and the other deniers) position, since they offer no explaination as why something that absorbs heat would not have the obvious effect of causing heating.
-
Tom Curtis at 20:34 PM on 17 September 2016Welcome to Skeptical Science
Richard @18:
1) In the words of the IPCC AR5:
"Global mean temperatures will continue to rise over the 21st century if greenhouse gas (GHG) emissions continue unabated. Under the assumptions of the concentration-driven RCPs, global mean surface temperatures for 2081–2100, relative to 1986–2005 will likely1 be in the 5 to 95% range of the CMIP5 models; 0.3°C to 1.7°C (RCP2.6), 1.1°C to 2.6°C (RCP4.5), 1.4°C to 3.1°C (RCP6.0), 2.6°C to
4.8°C (RCP8.5)."So, the projection is for the average over the two final decades of the century, and depends on assumptions about future changes in forcings. For the scenario which has the best claim to be a BAU scenario (RCP 8.5) the projected temperature increase is 2.6 to 4.8 C, but depending no how robustly we reduce emissions it may be a lot less than that.
2) David Archer has said that as a rule of thumb, ""The lifetime of fossil fuel CO2 in the atmosphere is a few centuries, plus 25 percent that lasts essentially forever." The processes are illustrated by this graphic showing the draw down from the addition of a large quantity of CO2 in one pulse:

(Source)
The "few centuries" is represented by the blue shaded portion of the graph, after which comes the long, slow drawn down (extending to about a million years or so to get rid of the last few ppmv increase). The 25% is a rough figure, and depends on how much we emit in total. The greater the amount the greater that value, with a full fledged BAU scenario pushing the value up closer to a third.
3) If we eliminate all anthropogenic emissions, the slow increase of temperature to equilibrium approximately matches in pace the slow draw down in CO2 concentration, with the consequences that temperatures remain approximately at the value to which they had risen when you eliminated all emissions. This is an approximate projection, with mismatches in the paces possibly resulting in small fluctuations on either side of that, and overall uncertatinty meaning it may be a slow rise or slow fall overall. This has been shown in simulations (to anwer your fifth question), but I cannot remember the relevant links at the moment, for which I apologize. Your question (4) also appears redundant.
-
Richard13791 at 14:51 PM on 17 September 2016Welcome to Skeptical Science
I am brand new to this site.
Here are some observations from the current literature, as I understand them, and questions:1. Average global temperatures are predicted to rise by 2100 by from 1.1 to 5.4 deg C. (Is this accurate?)
2. Once CO2 gets into the atmosphere it stays there for a long time (How long?), and presumably continues to contribute to rising temperatures while it is there.
3. To set a lower boundary on the problem, let’s say that ALL new human-produced CO2 and methane added to the atmosphere is reduced to ZERO starting tomorrow. Using current models, what is then the predicted change in average global temperature in 2100?
4. Are my statements/assumptions accurate?
5. Has anyone run the simulation I describe in (3)?
-
Tom Curtis at 13:06 PM on 17 September 2016The Climate Change Authority report: a dissenting view
nigelj @12, your desciption of an ETS is foreign to my experience. As I understand it, in an ETS a government sets a value for the maximum permitted emissions in its territory over a certain period. Permits to emit up to that amount are then auctioned of to the public, being mostly bought by major emitters such as power stations, cement works and the like.
The revenue from the auction is then available to the government for whatever purposes it desires. These should include compensation to low income earners and subsidies of renewables, but in a properly designed scheme, such subsidies are redundant if not counterproductive. Consequently, ideally the revenue will be returned to the population on an equal per capita basis, or a floor plus pro rata on taxable income basis (or some other reasonable, equitable basis). It should not be used for general revenue, as by design the take of am ETS (or carbon tax) will fall to zero within a few decades; and using the income from it as general revenue will build future deficits and probably reduction of services into the budget.
The advantages of an ETS over a Carbon Tax are that companies that can more cheaply reduce their emissions will bid less for emission permits, and buy less permits. That keeps down the cost of emission permits for those for whom the shift is more expensive, so the total economic cost (in reduced GDP growth) for a given reduction in emissions will be less for the ETS than for a Carbon Tax. In addition, an ETS makes it easier to coordinate emission reduction policies internationally than does a Carbon Tax as noted above. The advantages of a Carbon Tax are conceptual simplicity and ease of implimentation, although you still need to document emissions to tax them, so the advantage of a Carbon Tax in that regard is not as large as is often claimed.
In both instances, revenue to the government can potentially be reduced by buying carbon credits from companies or individuals who earn them by negative emissions. That can be avoided in a Carbon Tax by not allowing such credits, but that then means there is no economic advantage in sequestering carbon. In the case of an ETS, the credits generated in this form are more likely to be used to allow more positive emissions by pairing them with negative emissions, thereby maintaining net emissions at the government prescribed level. In Australia's briefly existing scheme, companies making emissions without emission credits from some source were forced to purchase them by law (which transaction because it was mandatory and on a short term, would probably result in a price premium). The credits thus purchased were either subtracted from future total allowable annual emissions, or offset by credits from sequestration from other sources.
I notice that the NZ ETS has an all free allocation, which is bad policy IMO. That requires that allocation to industry be done on the basis of past emissions, and/or bureaucratic decisions, with neither basis likely to be economically efficient. The only way to do an all free allocation is if it is done to all residents on an equal per capita basis; but even then, that requires all residents to become knowledgeable about the emissions market to be efficient (a big ask, IMO).
With regard to subsidies for renewables, in a mature ETS or Carbon Tax system, they are at best redundant, and more likely counterproductive. Any ETS or Carbon Tax should be introduced at a low pricing point (for an ETS that means total credits issued close to current emissions), and then ramped up gradually to minimize economic disruption. Renewable energy subsidies should phased out durring that process such that they are eliminated when the ETS or Carbon Tax imposes a price close to current best estimates of the social cost of carbon.
I agree, however, that further regulation in addition to the ETS or Carbon Tax is desirable. Specifically, the building of new coal fired power stations, and the expansion and/or refitting of new ones should be prohibited unless the employ (or are refitted to employ) CCS that reduces their CO2 emissions per unit energy to the direct CO2 emissions per unit energy of Natural Gas powered plants. Further, the development of new, or expansion of existing coal mines should also be prohibited. Non-conventional oil and gas fields should also be subject to the same limits unless the newly developed fields sequester sufficient carbon to bring total fuel lifetime emissions down to those of conventional natural gas.
Just the burning of currently commercially available coal will put us well past the 2 C limit, and the burning of all currently available and likely exploitable conventional oil and gas reserves will leave us well under. Therefore the regulations above provide a usefull backup to the ETS at minimal economic cost.
-
nigelj at 11:13 AM on 17 September 2016The Climate Change Authority report: a dissenting view
Tom Curtis @12, I have a preference for carbon taxes over emissions trading schemes, but I totally agree it comes down to the detail of a carbon tax versus an emissions trading scheme. I’m not closed minded on the issue.
Carbon taxes are based on very strong evidence that price affects behaviour while the ETS scheme does the same but somewhat indirectly.
Carbon taxes have one advantage that even a modest tax provides money that can be used to subsidise an activity of choice like, electric cars, or compensate low income people. Emissions trading schemes don’t do this or only subsidise forest planting. The problem is encouraging electric cars requires altering public perceptions, providing recharging stations etc and emissions trading schemes are not good at those things or would require a very high carbon price to get movement on these things. For example the ETS in my country has not encouraged electric cars.
Of course you could argue philosophically that an ETS is setting up a “market platform or process” and the market may not see electric cars as the answer, - or not right now. Indeed companies in NZ are tending to purchase units in forests rather than cut emissions or develop new technology. However I just don’t like this market process thinking. It’s obvious to me we need electric cars, so we should just do this.
I’m also a very results orientated person, and carbon taxes seem to be working in places like British Columbia. Emissions trading schemes do not have a great record in Europe or my country of New Zealand. Emissions trading schemes make sense to me in theory, in a textbook, however their record in the real world is not so good.
Carbon taxes are also fully compatible with other measures like energy efficiency measures, and one would not rely just on a carbon tax. That much is commonsense. Emissions trading schemes are in theory stand alone schemes that should not require other measures, yet in reality they seem to require many other measures.
You claim ETS schemes can internationally link up. In theory yes, but we have had problems in New Zealand with imported carbon credits of dubious value (from Eastern Europe) so your international linkages are not without problems.
Of course it all comes back to how the ETS is designed I guess. My country may have a bad version.
I agree with your last two paragraphs on assisting low income people hurt by emissions reductions schemes, etc, etc. However it’s sad that we have to go to such an extent of convoluted policy to persuade the more conservative viewpoint.
-
Tom Curtis at 09:39 AM on 17 September 2016The Climate Change Authority report: a dissenting view
nigelj @2, the majority of the bureacracy required by Emissions Reduction Fund and Emissions Trading Schemes (ETS) needs to exist regardless just to monitor total national greenhouse inventories. The size of that bureacracy is, however, small relative to that required to admister most other government activities.
While ETS are potentially rortable, most carbon taxes allow the purchase of carbon credits to ameliorate the tax, which introduces the most serious potential to be rorted in ETS as a feature of carbon taxes. While that is not a necessary feature of carbon taxes, a carbon tax that lacks it will be far more onerous economically than one with it. In order to avoid that, if emissions credits are not permitted, industries that are high emitters and which face unusual difficulties in reducing emissions are likely to be exempt from the tax, thereby eliminating the price signal to reduce emissions in those industries. Consequently, in practise, the relative simplicity of a carbon tax relative to an ETS is not as great as you supose.
Further, an ETS has the advantage of easilly linking up with other ETS schemes internationally, thereby turning local national solutions into global solutions. (In the US or Canada, the same can be said for a transition between state or province based solutions to national solutions.) Ideally we would be able to move to a situation in which there is a single, global carbon market with tradable national emission quotas determined by a strict, equal per capita allowance for each nation; said quota reducing annually on a clearly laid out trajectory. In contrast, the coordination of carbon taxes in a similar manner is far harder, and necessarilly ad hoc.
Given these to fact, I am in principle in favour of Emission Trading Schemes over Carbon Taxes, although in practise I need to see the details of any particular proposed ETS or carbon tax to determine my preference.
I will note, on this subject that traditionally ETS and carbon taxes have been suggested on a fee and dividend basis with an equal per capita dividend. There is a good argument in favour of this on the basis of equity (ie, that the permissible carbon emissions is a public resource, equally owned by all people in the world, so that all people should be equally compensated for its use), but it is not the only reasonable arrangement and its egalitarian nature, I am sure, is very off putting to more conservative voters and politicians. Consequently a scheme in which there is a base credit sufficient to match in value the cost of the scheme to a person on the poverty line, and with no change in their expenditure patterns (and hence no reduction in emissions), and a second component distributed pro rata based on income tax paid (not taxable income) would have a better chance of being supported by conservative politicians. It would still be equitable in the limited sense of not making the very poor worse of; but would not involve a massive income transfer between the wealthier and poorer sections of the population, and would reduce the economic impact of the scheme.
Other, reasonably equitable schemes are also possible, and should be discussed so that we maximize the chance of getting conservative voters and politicians on board, and therefore doing something rather than remaining in a deadlocked situation.
-
Tom Curtis at 09:11 AM on 17 September 2016The Climate Change Authority report: a dissenting view
Mal Adapted @10, provided the "or port of entry" is included, and carbon taxes are strictly leveled only on internal emissions of a nation (including fuel purchased for international journeys from that nation), I agree. The later requires that the carbon tax not be paid on fuel extracted at the mine or well and exported (or that there be a rebate on exports). Failure to include this provision means that we are taxing the carbon emissions of people whose national per capita emissions are very much below the global average; and making true the currently false skeptical claim that we are impoverishing the third world to salve our first world consciences. It also makes impossible a fee and divident arrangement for importers of the fossil fuels.
-
Mal Adapted at 08:50 AM on 17 September 2016The Climate Change Authority report: a dissenting view
michael sweet:
The point of a carbon tax is to raise retail prices while wholesale prices remain the same.
A carbon tax on fossil-fuel production at the source (mine, well or port-of-entry) make the most sense to me. It would internalize a portion of the hitherto external costs of AGW, in the cost of fossil fuel production. The producers would be forced to pass their increased cost on to their immediate customers, who are the refiners, distributors and other wholesalers. That is, wholesale prices are the first to rise, and are passed on to consumers in higher retail prices.
-
nigelj at 07:54 AM on 17 September 2016The Climate Change Authority report: a dissenting view
Michael Sweet @7
Your justification of carbon taxes does make sense. Carbon taxes do seem the most practical option on the whole, and even a moderate tax would likely encourage electric car use given all the current pricing issues.
Ideally I would see governments passing legislation that keeps fossil fuels in the ground! Of course this is a big move, and unlikely to be popular, or happen in the middle east, so carbon taxes are probably the best next alternative.
We currently have an emissions trading scheme in New Zealand that has achieved almost nothing. We have had issues with imported credits of dubious origin and value.
I suspect one weakness in the emissions trading scheme concept is it would have to be set very high to encourage electric car use. Our modest ETS certainly hasn't encouraged electric car use.
Government oppose subsidies for electric cars, and put all their faith in the ETS as the single mechanism to encourage changes of behaviour and to fight climate change. This doesn’t make much sense to me, because they are relying on just one tool to deal with a very complicated range of issues.
-
ijames at 02:33 AM on 17 September 2016Welcome to Skeptical Science
Apathy and inaction are our greatest enemies. To quote Rachel Carson:
“We stand now where two roads diverge. But unlike the roads in Robert Frost’s familiar poem, they are not equally fair. The road we have long been traveling is deceptively easy, a smooth superhighway on which we progress with great speed, but at its end lies disaster. The other fork of the road—the one “less traveled by”—offers our last, our only chance to reach a destination that assures the preservation of the earth.”
-
denisaf at 23:04 PM on 16 September 2016The Climate Change Authority report: a dissenting view
The discussion relates to Australia's policy with respect to to the carbon budget, that is the release of greenhouse gases. Australia needs to adopt a sound emission reduction policy only to provide evidence that it is reducing the high per capita level. Ironically, what Australia does will have no impact on the rapid climate disruption and ocean acidification and warming that is under way because its emissions are a very small percentage of the global rate. More focus should be on measures to cope with such issues as sea level rise, more floods, storms and droughts.
-
michael sweet at 10:52 AM on 16 September 2016The Climate Change Authority report: a dissenting view
Nigelj,
The point of a carbon tax is to raise retail prices while wholesale prices remain the same. This discourages use while it does not encourage more exploration. It seems to me that your reference is mistaken. It is only a newspaper report, not a peer reviewed source.
In addition, your report assumes that there will be no replacement of current power by any other source. Obviously if carbon is more expensive that makes renewables relatively cheaper and more likely to be deployed. When energy is more expensive people also make more attempts to be more efficient. That lowers demand which lowers profits of fossil fuel producers.
-
scaddenp at 10:34 AM on 16 September 2016The Climate Change Authority report: a dissenting view
I dont think that makes sense. What would encourage more oil exploration is higher profit not higher prices. The oil companies dont pocket the carbon tax. The analysis that article uses is flawed. OPEC raising prices on their oil, raised all oil prices so companies can reap profits. Carbon tax does not do anything for companies. On the other hand, price elasticity for oil is currently low (lack of reasonable alternatives) and it would be more effective against coal (which is where it really counts). Electric vehicles are rapidly changing the picture however, and I think in a few more year, price elasticity on oil might substantially increase.
-
nigelj at 09:42 AM on 16 September 2016The Climate Change Authority report: a dissenting view
Chriskoz @ 4
The following article is a thoughtful, detailed analysis of some of the problems with carbon taxes, and it comes from a Greenie! Im sorry I dont have time to hunt down anything peer reviewed, however the article is something I read a while ago.
www.greenbiz.com/article/why-carbon-taxes-arent-silver-bullet-climate-change
The essential issue is a carbon tax pushes up the price of carbon, so certainly this will reduce use. However higher prices might encourage more oil exploration and so the increased supply of oil pushes the price back down, making the carbon tax self defeating at least to some degree.
I dont know if studies have been done on existing carbon taxes in British Columbia or Canada etc to see if this happens.
Just to be clear, a carbon tax is certainly better than nothing. However carbon really needs to stay in the ground, and I favour more direct regulatory controls on emissions.
-
chriskoz at 09:09 AM on 16 September 2016The Climate Change Authority report: a dissenting view
nigelj@2,
Another approach is carbon taxes, which are simpler to administer. However the problem is they push up the price of carbon, so encourage more oil exploration.
Can you elaborate please (best with a scientific reference that provides evidence of the issue) because it's news for me.
-
chriskoz at 09:05 AM on 16 September 2016The Climate Change Authority report: a dissenting view
Thanks Clive for that important summary.
I want to comment on the the implied politicization of CCA, implicitly blamed here on the actions of Abbott government. However the sentence:
This is all the more regrettable because [the majority report is in opposition to the First Report and a special review] released in April 2015 (before the appointment of six new Members to the Authority in October 2015).
(my emphsis)
states that said politicization started happening under Malcolm Turnbull govenment, who assumed the offices of LNP leader & PM of Australia after defeating Tony Abbott in a leadership spill on 14 September 2015. Clearly, Turnbull with respect to climate mitigation, continues inadequate, if not outright wrong policies of his predecessor (Abbott), who as recently as 4-5years ago was saying that CO2 is nothing but "invisible and odourless trace gas", and as recently as 1y ago was saying that "coal is good to humanity". What was the point of the leadership spill of 14 September 2015, since the new PM continues the line of a disgraced predecessor?
-
nigelj at 08:51 AM on 16 September 2016The Climate Change Authority report: a dissenting view
My understanding is that the Emissions Reduction Fund is essentially a tax payer funded subsidy to encourage things like cleaner electricity generation. I dont totally oppose subsidies on principle, but I agree this one will be very bureaucratic and problematic. This scheme is trying to avoid being too hard on business directly, and so shifts costs onto the public as much as possible, but in a way that subtly hides the costs by giving it a grand, benevolent sounding name. Its laughable really, like a sort of game of hide and seek.
But conventional emissions trading schemes (Cap and trade schemes, etc) also have considerable bureaucracy and complexity of administration, and are very easy to rort. I just haven’t seen these schemes having any real success, other than growing forests, which helps but is not an adequate answer to climate change. And there will be immense pressure to cut these forests down anyway, for the resource.
Another approach is carbon taxes, which are simpler to administer. However the problem is they push up the price of carbon, so encourage more oil exploration.
There are only two viable answers. Firstly direct regulatory control over electricity generation and car manufacturers, although again this has some complexity of rules.
Secondly go to the source of the problem. Force fossil fuel companies to leave carbon in the ground. This is much simpler and stronger and gets to the cause of the problem.
But of course this will lead to big protests from the fossil fuel industry, and also the public. We dare not contemplate this option. So we play silly games instead, that have made no difference, or only a very slight difference of no consequence. We pretend to solve the problem by tinkering.
-
An update on methane emissions from fracking (in the US)
Although some of its contents is outdated, the new paper in PNAS basically confirms the above calculations. For instance, they estimated an increase in annual methane emissions from fossil fuel sources of 21 Tg (terragrams, (same as millions tons per year) over the 2000s, which is at the upper end of the 1-2 million tons of anual increase accumulated over 10 years. Other results differ from the competing isotopic study in Science, so I guess we will have post another update some time next year ...
-
Leto at 08:14 AM on 16 September 2016The Climate Change Authority report: a dissenting view
Thank you for releasing this minority report. The deliberate pursuit of policies destined to reach a crisis within ten years should be front-page news.
I have a some questions.
1) Are any of the majority report authors available for comment, or have they already released comment elsewhere?
2) Does the inadequacy of the majority report indicate that the Climate Change authority has become a sock puppet for Abottesque political forces?
3) Have any of the minority report authors performed similar calculations for the more ambitious target of 1.5 degrees?
-
terrymorse at 08:06 AM on 16 September 2016Extreme weather isn't caused by global warming
I searched for some info on USS storm trends and how they relate to temperature change. But I couldn't find anything pertinent, so I decided to put together something myself that compares storm frequency to temperatures.
The NOAA Storm Database has records of "Thunderstorm Wind" events going back to the 1950s, so I downloaded the years 1975-2015 (380,026 events in total).
For temperature, I chose the NASA GISTEMP annual means for the Northern Hemisphere.
Here's the graph of storm counts and temperatures for the past 35 years, showing a strong correlation between the two (97.35%):
 Moderator Response:
[RH] Adjusted image size. Please limit your images to 500px in width.
-
Tom Curtis at 14:54 PM on 15 September 2016There is no consensus
Hathawad @737:
1) "There definitely is a consensus that CO2 can increase temperature, but nobody knows by how much"
IPCC AR5:
"The equilibrium climate sensitivity quantifies the response of the climate system to constant radiative forcing on multicentury time scales. It is defined as the change in global mean surface temperature at equilibrium that is caused by a doubling of the atmospheric CO2 concentration. Equilibrium climate sensitivity is likely [probability of 66% or more] in the range 1.5°C to 4.5°C [0.41- 1.22 C/(W/m^2))](high confidence), extremely unlikely [probability of 5% or less] less than 1°C [0.27 C/(W/m^2))] (high confidence), and very unlikely [probability of 10% or less] greater than 6°C [1.6 C/(W/m^2))] (medium confidence)."
That is very simple to interpret. If your assessment of the Probability Density Function (PDF) of the Equilibrium Climate Sensitivity (ECS) shows a probability that the ECS lies between 1.5 and 4.5 C less than 66%, you are in disagreement with the IPCC, and your assessment lies outside of the consensus. If your assessment is that the probability that the ECS is less than 1 C is greater than 5%, you are in disagreement with the IPCC, and your assessment lies outside of the consensus. If your assessment is that the probability that the ECS lies above 6 C is greater then you are in disagreement with the IPCC, and your assessment lies outside of the consensus. As a result it is clear that Nick Stokes estimates of the ECS, though low, are clearly within the consensus while those of deniers claiming an ECS of 1 C or less are not.
I included in the quote from the IPCC the values interpreted as a Climate Sensitivity Factor, which allows you to simply multiply out a forcing to see the temperature response to that forcing. Thus, at doubled CO2 the forcing is 3.7 W/m^2 +/- 10%. From the forcing and the Climate Sensitivity Factor, the temperature impact of CO2 at equilibrium is easilly calculated. In short, the temperature impact of CO2 is known within a significantly constrained range that excludes most denier estimates of the impact.
2) "According to believers the icecaps would have been long gone by now..."
No climate scientist of any repute has claimed that the ice caps (ie, kilometers deep layers of ice covering Antarctica and Greenland, and some thinner ones on islands in the Canadian Archipelago) would have melted by now, or even by the end of the century. Wieslaw Maslowski and Peter Wadhams has predicted an early loss of Arctic sea ice (ie, the very thin ice floating on the sea surface) around this decade. The low bracket of their estimate has come and gone. The central value of his estimate falls in the remaining four years of this decade, and are widely considered by sea ice experts to be utterly implausible. The actual consensus position, as given in the IPCC AR5 is:
"Based on the CMIP5 multi-model ensemble, projections of average reductions in Arctic sea ice extent for 2081–2100 compared to 1986–2005 range from 8% for RCP2.6 to 34% for RCP8.5 in February and from 43% for RCP2.6 to 94% for RCP8.5 in September (medium confidence). A nearly ice-free Arctic Ocean (sea ice extent less than 1 × 10⁶ km2 for at least 5 consecutive years) in September before mid-century is likely under RCP8.5 (medium confidence), based on an assessment of a subset of models that most closely reproduce the climatological mean state and 1979–2012 trend of the Arctic sea ice cover. Some climate projections exhibit 5- to 10-year periods of sharp summer Arctic sea ice decline—even steeper than observed over the last decade—and it is likely that such instances of rapid ice loss will occur in the future. There is little evidence in global climate models of a tipping point (or critical threshold) in the transition from a perennially ice-covered to a seasonally ice-free Arctic Ocean beyond which further sea ice loss is unstoppable and irreversible."
(My emphasis)

(See the upper right panel in particular.)
So, the consensus position is for a sea ice free Arctic around mid century, approximately 30 years from now, and that being avoidable if we mitigate climate change.
3) "...and we would be in knee deep water in Florida".
The IPCC AR5 predicts a likely range for sea level rice in 2081-2100 of 0.52 to 0.98 meters (ie, enough to make you shin to knee deep if you stand at the current water level) assuming RCP 8.5 (essentially business as usual. Predictions of knee deep sea level now except as a result of storm surge are figments of your own imagination.
4) "Over the past 11,000 years..."
GISP 2 represents a temperature proxy for only one location on the earths surface, and consequently does not represent Global Mean Surface Temperature (GMST). You should at the minimum use a mean of several long term temperature proxies, such as this one from Global Warming Art:

The recent decadal average is up around 1 C on this scale, and well above the 2004 value indicated in the graph, and hence above the mean across all decades. These proxies do not have a annual time scale so some decades in the past 10,000 years may have been warmer than our current decade - but we do not know that any were and it is likely that very few were. Further, the temperature rise since 1850 is almost certainly unprecedented since the end of the last glacial.
5) "During evolution, the CO2 was many thousands of ppm and man was definitely not around then and yet life was possible during this "catastrophic" CO2 level"
Durring those periods with very high CO2 levels, solar activity was significantly less than it is today. This is known because solar activity increases overtime in a very predictable pattern. The result is that combined forcing of CO2 plus solar was not much greater than preindustrial levels, and less than likely levels of forcing with Business As Usual:
It is interesting to note that up to 65 million years ago, land life was dominated by ectotherms and endotherms, ie, creatures much less vulnerable to heat stress than is the case for humans. Periods of elevated temperatures in the last 65 million years have also see a dominance of smaller animals, with a higher surface to volume ratio and higher basal temperatures (both contributing to more efficient cooling). Neither of these facts is comforting to large, homeothermic animals such as humans when facing similarly elevated temperatures. Rodents, snakes and cockroaches, on the other hand, will do just fine.
In summary, your "points" rely mostly on misrepresenting the claims of climate scientists, or misrepresenting what is actually known. An argument that can only be pressed by such means (as is the case with nearly all denier arguments) are not worth pursuing, or indeed, giving any credence to.
If you surprise me by actually responding, please do so on the appropriate threads as indicated by the moderator.
Moderator Response:[JH] To make it easier for readers to disgest your posts, I suggest that you use italics font for the material you are quoting from the commenter you are responding to. In this particular case, you may also want to put the quotes in bold-face because they essential serve as subject headers.
-
nigelj at 10:49 AM on 15 September 2016BBC climate coverage is evolving, but too slowly
Tom Curtis@13
Yes those seem like sensible media guidelines. I believe freedom of speech is very important, but is only the right to have an opinion without being censored (especially by government), or being assaulted. It is not a right to swear in public, tell lies without consequences, or to promote violence. For example we have defamation suits, and laws against inciting violence.
The media have a special responsibility for what they say as they have such a wide readership and thus influence. They should of course be free to write whatever opinion they want in general principle, but the media should adhere to some basic standards and face censure if they don’t. Many media have codes of practice, but some are only voluntary in my country.
For example the media should take all practical steps to ensure articles are honest, and not misleading, and that claims about research are backed up with sources stated. If the media claim they dont have the expertise to discern whether an opinion article by a guest writer is misleading or not, they should at least publish a contrary point of view for balance, and on the same page on the same day.
However regarding climate change, I think opinion articles by so called sceptics have little value unless its an area of some remaining genuine debate like climate sensitivity. Sceptical opinions should mostly be covered in wider documentary style articles on climate change, that include both the IPCC position and sceptical views (robust points of view rather than the flakey stuff), and in a way that hides nothing and puts all claims in proper context. All the climate sceptical claims I have ever seen fall over once you look at the full context.
-
Bob Loblaw at 09:54 AM on 15 September 2016There is no consensus
Hathawad:
If you want to learn about these things, go to the "View All Arguments" at the bottom of the thermometer image on the upper left of each page (below "Most Used Cliamte Myths"). You wll find nearly 200 links to various myths, of which your brief posts have covered a surprisingly large number for so few words.
Your assertions are completely unsupported, and that counts for nothing at this site.
...and read the comments policy (link just above the box you type your comment in)
-
Bob Loblaw at 09:46 AM on 15 September 2016Ice age predicted in the 70s
No, Kabothpa, it is not an accurate statement. You seem to have neglected "science" in your comment: the '70s predictions were almost entirely media, with little science, while today there is a very strong science foundation reagarding future warming.
You have played "bait and switch" (perhaps not intentionally) by first discussing a general statement about the 1970s ice age predictions, and finishing with a statement about media shaping public opinion. How public opion is shaped is not a discussion about the scientific position, and the 1970s scientific position on cooling (extremely limited support) is not at all like the current scientific position on CO2-caused warming (very strongly supported).
-
kabothpa at 09:25 AM on 15 September 2016Ice age predicted in the 70s
What happens when we take this article's opening statement, "1970s ice age predictions were predominantly media based", and apply it to today's climate debate? Let's see:
"Climate change fears (ice age predictions) of the early 21st century (1970s) were predominantly media based."
Is that not an accurate statement? The public's perception of climate change in the modern era has been shaped by the media, not science. Of the millions of people who think they're saving the planet by driving a Prius, only a tiny fraction, far less than 1%, have actually taken the time to review actual scientific data on the topic. They don't know what the term 'greenhouse gas' actually means, nor do they care to. (They also don't know that the Nickel in their beloved Prius's batteries was extracted though mining operations that are more polluting than almost any other human activity).
The media shaped public opinion on climate in the 1970s just like it does today.
-
nigelj at 08:50 AM on 15 September 2016Trump and the Republican Party are doing Big Oil's bidding
Is big oil influencing the Republicans? Donald Trump does indeed appear to listen closely and surround himself with the fossil fuel lobby, and climate denialism people. Big oil is influential, and is implicated in attempts to discredit science, and this is all so reminiscent of the tobacco wars. The suggestion of an alternative “scientific method” shows how addicted people are to oil, and how desperate they will become.
We have lobby groups and corporations funding election campaigns, so obviously they have huge influence over politicians, and the Republicans in particular seem extremely eager to please. The limits in the past on campaign funding in America have been weakened over the last 20 years, due to constant business lobbying, to give the lobby groups absolute power as below. This is the context that empowers climate change denialism.
www.infoplease.com/us/history/campaign-finance-reform-timeline.html
I came across this recently. Currently Trump claims climate change is just a hoax by the Chinese to damage American industry, which is of course totally ludicrous. However 7 years ago Trump called for urgent action to stop climate change, as below
www.theatlantic.com/science/archive/2016/06/trump-climate-change-new-york-times-letter-ad/486335/
Trump is constantly changing his mind on too many things, and this does not seem like good leadership to me. Trump is possibly making climate change science a sort of expendable tool, to be manipulated or discarded to further his other agendas. This is really dangerous for humanity, and shows his contempt for science.
-
Tom Curtis at 08:36 AM on 15 September 2016BBC climate coverage is evolving, but too slowly
nigelj @12, I would certainly suggest the media treat the public climate science debate like that, whilst also making it very clear what passes as the public debate bears no ressemblance to the actual scientific debates in climate science. Of course, I would also allow simple reporting of the science without bringing in what are clearly minority (in the scientific community) and poorly supported views. I think we should expect nothing less than that standard from public broadcasters including the BBC (and the ABC in Australia).
I also think that reasonably we can go further without risk of violating freedom of speech. As a first step, it should be incumbent on media, by law, to indicate the primary funding source of their sources. So, if they use Joe Bast as a source on the climate change debate, they should introduce him as, "Joe Bast from the fossil fuel funded lobbying organization, the Heritage Foundation". Second, I think any media report claiming to be news or current affairs should meet minimal standards of balance and integrity of the views expressed to be able to make that claim (with a disclaimer that they do not purport to meet those standards if they are unwilling to do so) as a matter of truth in advertising. Further, the special protections journalists recieve in some countries (and ought to recieve) such as the right to protect sources, and a higher standard of proof in defamation proceedings against them should be conditional on their conspicuously attempting to meet those standards of balance and integrity.
-
nigelj at 07:33 AM on 15 September 2016BBC climate coverage is evolving, but too slowly
Tom Curtis @ 8
All true enough. Many sceptical claims are simply outrageous, yet the media let them go uncontested. This is wrong, wrong and wrong.
I gather you are suggesting the media treat climate science somewhat like a Richard Attenborough documentary, and that both sides of the debate are presented, before reaching a conclusion on the more convincing side of the debate (The IPCC position). Climate sceptics would have a chance to explain exactly why they believe climate sensitivity is low, given that most science suggests climate sensitivity is medium to high. Their response would in turn be examined.
This is my kind of television or writing. It absolutely takes things apart in a rational way. In fact a chap named Gareth Morgan has written a book on climate change called "Poles Apart" where he devotes several chapters to the mainstream IPCC position, and then a couple of good chapters on the sceptical position, - and treats this fairly. Gareth then evaluates everything and explains why he thinks the sceptical position is weak.
Gareth is actually an economist in New Zealand, but also an environmentalist, multi millionaire and he employed teams of scientists from both sides of the debate for his book and gave them ample input. I have no connection with the guy, I just mention it as a very balanced account of the whole issue, and a very good read as an introduction to climate change for the general reader.
The trouble is books or media documentaries like this are sophisticated and "nuanced" and may not get the huge crowds, so private sector media aren’t interested. The media have descended into sound bites and desperate attempts to be "noticed" and inflammatory. However I believe the BBC certainly has a duty to treat climate science is this doucumentary way, and it can be made really interesting with some effort.
-
hathawad at 05:39 AM on 15 September 2016There is no consensus
Why do we analyze only a few hundred years back.
We need to look back 11,000 years and you will see that the temperature has been much higher in the past and increased at a much faster rate in many occasions in the past. We focus to much on the recent past and its wron to base conclusions on this tiime period alone.
Moderator Response:[TD] This comment is redundant with your previous one. Don't do that.
-
Nate12674 at 04:25 AM on 15 September 2016BBC climate coverage is evolving, but too slowly
Tom #7,
Agreed, theory often needs to be adjusted or thrown out. But often observations or analysis are wrong or incomplete-throwing out theory that has other supporting evidence can be premature. Example: a recent observation of faster than light particles (neutrinos). Most sensible people took a wait and see attitude rather than throw out relativity, and were proven wise-the experimenters made a mistake.
-
hathawad at 03:08 AM on 15 September 2016There is no consensus
There definitely is a consensus that CO2 can increase temerature,
BUT NOBODY KNOWS BY HOW MUCH, that part is NOT consensus. According to believers the icecaps would have been long gone by now and we would be in knee deep water in Florida.
There is no consensus on CATASTROPHIC climate change.
Over the past 11,000 years the Earth has had temperatures above today's average temperature about 9 times. We are now at average temp according to this data: GISP2 below
During evolution, the CO2 was many thousands of ppm and man was definitely not around then and yet life was possible during this "catastrophic" CO2 level
Moderator Response:[RH] Shortened link. Please note that use of all caps is against our commenting policy.
[TD] Your comments are most appropriate on several other threads. Please read the following, and if you want to comment further on those topics do so on those threads, not this one:
"...the icecaps would have been long gone by now." You need to provide a reference for your claim. I'm unaware of anyone who has claimed that. For actual peer reviewed scientific projections of ice loss, type into the Search field at the top left of any page relevant terms such as ice, sea ice, land ice, and glacier, and choose from among the resulting hits. Here is one of those: Read the Intermediate tabbed pane of "How the IPCC is more likely to underestimate the climate response," scrolling down to the section on Arctic sea ice.
"...we would be in knee deep water in Florida." You need to provide a reference for your claim. I'm unaware of anyone who has claimed that. For actual peer reviewed scientific projections of sea level rise, type "sea level" into the Search field at the top left of any page, and choose from among the resulting hits. Here is one of those: "How much will sea levels rise in the 21st Century?" After you read the Basic tabbed pane there, read the Intermediate one.
"There is no consensus on catastrophic global warming." "Catastrophic" is too ambiguous a term; scientists' projections are much more specific. Read "Positives and negatives of global warming." After you read the Basic tabbed pane, read the Intermediate and then the Advanced.
"Over the past 11,000 years the Earth has had temperatures above today's average temperature about 9 times. We are now at average temp according to this data: GISP2 below." The GISP2 graph you linked has as its most recent data the year 1855. Not even 1955, but 1855. So it does not show anything like "today." Also, it reflects the temperature only from a single spot in Greenland, which is not at all representative of the entire Earth. Read "Most of the last 10,000 years were warmer." To learn about temperature indices that are representative of the entire Earth, and that go up to much closer to today, read "Real skepticism about the Marcott hockey stick." Then use the Search field to look for more posts about Marcott, and posts about PAGES 2K.
-
Tom Curtis at 02:22 AM on 15 September 20162016 SkS Weekly Digest #37
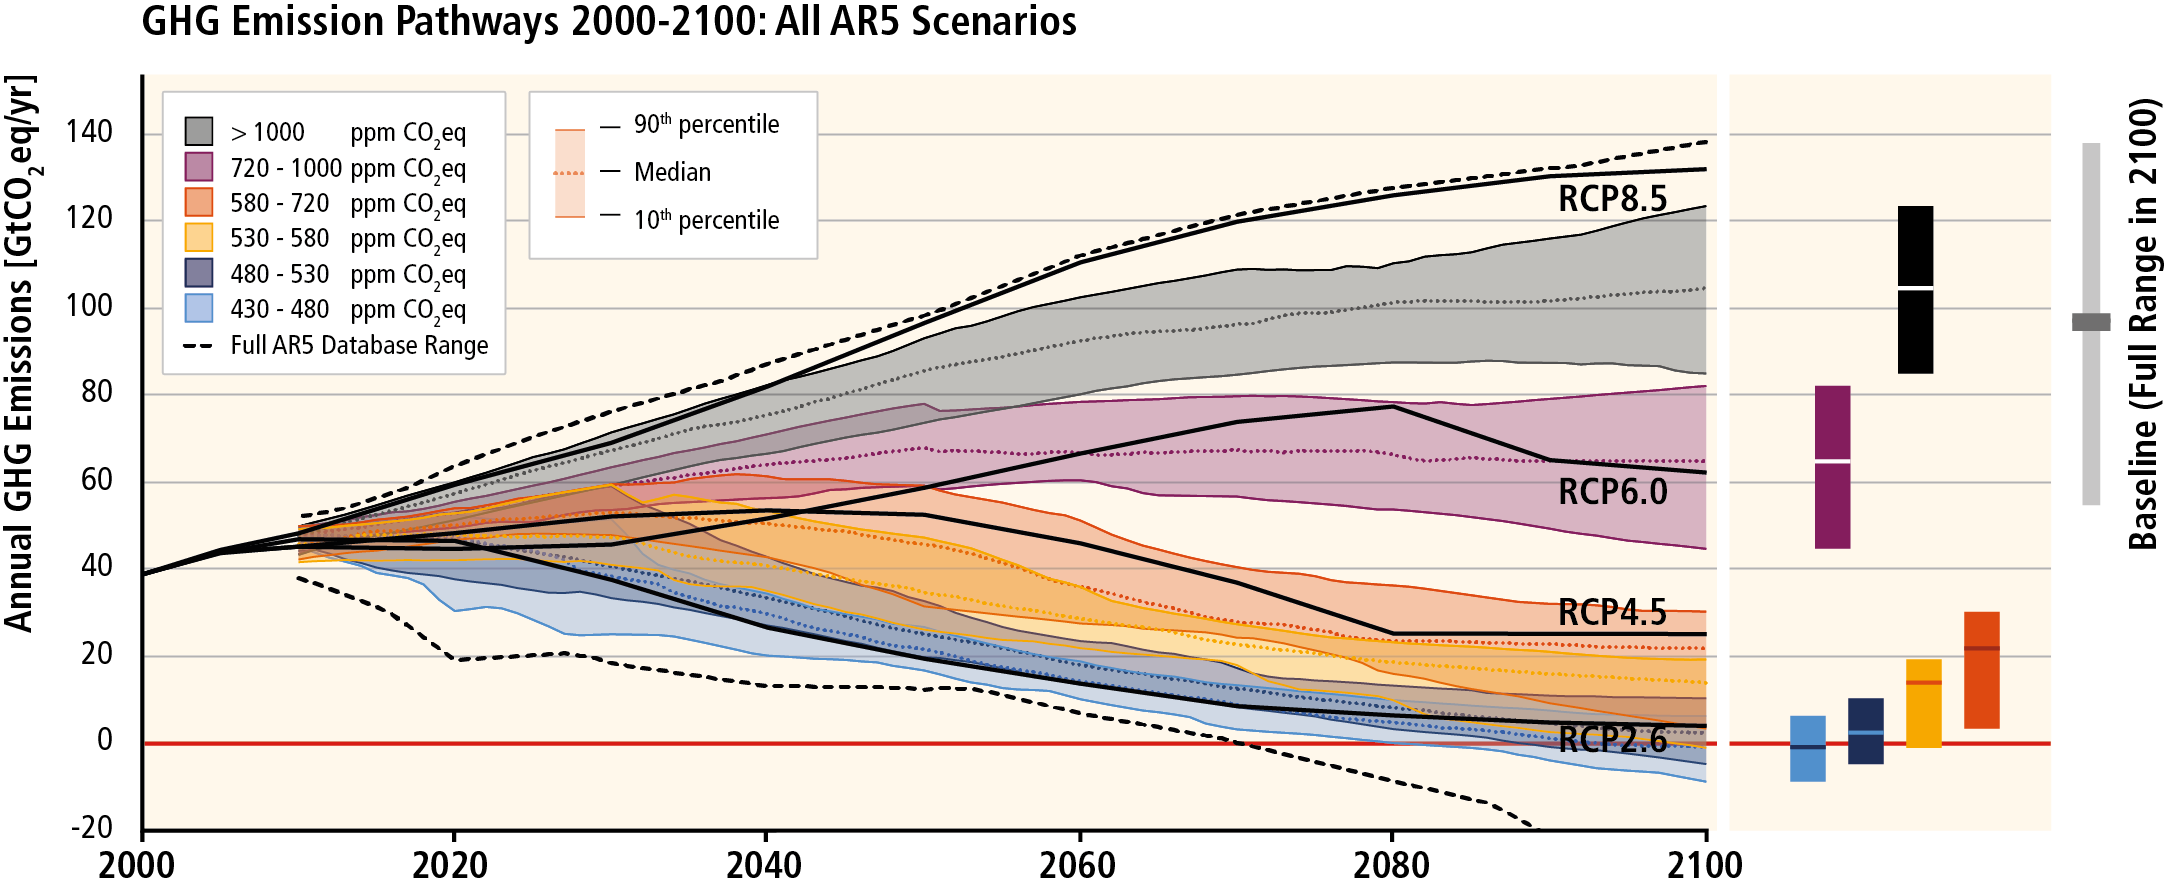
Zoli @24, I don't know how big an issue you thought it to be, but AGW is one of the biggest, indeed probably the biggest policy issue facing humans today. That is because, while there is a reasonable chance of a soft landing* (climate sensitivity in the lower half of the probability range, damages at a given temperature in the lower half of expected range, rapid reduction in net global emisisons), there is a significant risk of absolutely catastrophic outcomes (climate sensitivity in the upper half of the PDF, damages in the upper half, and very limited reductions in net emissions). Thinking that the former makes AGW a non-issue is like thinking that Russian Roullette is safe because there is a five in six chance that you will not blow your brains out.
Second, the IPCC is fully aware of all the factors discussed here. The image you provide an URL for shows the outcomes of specified scenarios with prescribed emissions history, and concentrations calculated from those emissions history using carbon cycle models that take into account all the factors we discuss. Most of those scenarios do not achieve net zero emissions in this century, and hence show ongoing temperature increases. Remember, for CO2 concentrations to be drawn down naturally, CO2 emisions have to fall to less than 10% of their peak values - something that does not even occur in RCP 2.6 until late in the century, and not at all in the other scenarios this century. So, no. The IPCC are not "alarmists". Rather they are realistic and well informed.
(* Note: Even a soft landing will involve many individual climate caused catastrophes - just not a global catastrophe.
-
ubrew12 at 01:53 AM on 15 September 2016BBC climate coverage is evolving, but too slowly
denisaf@9 said: "policies to reduce emissions can only slightly slow down this damaging process". If we managed to hold CO2 at today's 400ppm, by end of century the rise would be 2 C. If instead we get to 560ppm (BAU out to 2050), the rise will be 3 C. But that's the expected mean: there's a one-in-six chance the rise (after 560ppm) will be 4.5 C or higher. A 'roll of the dice' of a global extinction event, if we let CO2 get to 560ppm. So, depending on your tolerance for risk, 'policies to reduce emissions' seem prudent, to me.
-
Zoli at 00:51 AM on 15 September 20162016 SkS Weekly Digest #37
@chriskoz
@Tom Curtis
Thank you. So climate change isn't that big issue as I thought.
And IPCC authors are alarmists because they didn't count the quick CO2 drop.
[img]http://i67.tinypic.com/vddces.jpg[/img]
Long term changes, page 1104
-
chriskoz at 18:50 PM on 14 September 20162016 SkS Weekly Digest #37
scaddenp@21,
A typo crept into my comment@19.
I ment to show, that if you could have PVs that collect 200W peak power per m2 in AL, and jam-pack that site with such PVs, then your peak power output from that site would be (647ha = 6,470,000m2) * 200W = 1.3GW.
Obviously I see now, that 200W peak power is incorrect and not correct metric. With the more reasonable metric you pointed out (5kWh/m2/day) we and up with average insolation of just 200W over 24h. With 10% PV efficiency, the energy yield would then be 0.13GW averaged over 24h - 10 times less than planned nuke yield. Needless to say the yield would be intermittent, unlike nuke. With the best available commercial PVs approaching now 20%, the yield would still be five times less than nuke.
However I did not underestimate the cost of jam-packing that site with PVs. The latest estimate of PV cost is at $0.3 per 1W capacity.

So I the total cost of such project is $0.13Giga*0.30 = $39m
-
chriskoz at 16:15 PM on 14 September 20162016 SkS Weekly Digest #37
Tom@20,
Thanks for your clarifications to what I agree.
Your posts always have very precise meaning, allowing easy and clear discussion, a benchmark of quality blog commenting.
-
denisaf at 16:12 PM on 14 September 2016BBC climate coverage is evolving, but too slowly
I am an Australian physical scientist who has followed the debate about climate change due to emissions of industrial operations for decades. There is very little uncertainty about the hypothesis that irreversible atmospheric climate disruption and ocean acidification and warming is occurring. Comprehensive atmospheric and ocean measurements have backed the arguments of climatologists. The emerging global policies to reduce emissions can only slightly slow down this damaging process even if it these policies can be implemted as rapidly as physically possible. More emphasis should be placed on measures to adapt to the consequences, such as sea level rise, more severe storms, more droughts and more floods.
-
scaddenp at 14:21 PM on 14 September 20162016 SkS Weekly Digest #37
I hectare is 10,000 m2, so I think your area is off by factor 10. Since solar incoming is 1367W/m2, I dont your solar panel is going to give you 200W/m2. NREL puts Alabama available solar input at 5kWh/m2/d
-
Tom Curtis at 14:12 PM on 14 September 2016BBC climate coverage is evolving, but too slowly
nigelj @6, a lot that passes for climate denial consists of straighforward, and often ludicrous pseudo-science and/or conspiracy theories. If we had a news media that actually took seriously their duty to inform, these would not be presented in news and current affairs shows, and only presented in documentaries that fisk them. This is not different to who we would expect new media to treat numerology, astrology, 911 Trutherism and other various nonsenses given air by credulous people on the internet. Scientifically, thes include opinions that:
Humans are not the cause of the current rapid rise in CO2 levels;
CO2 forcing is not in the order of 3 - 4 W/m^2 per doubling;
The climate sensitivity per doubling is not greater than 1 C per doubling of CO2.
Of more interest are theories that the climate sensitivity is in the range of 1-3 C, which are not excluded by the IPCC. Likewise, for theories that increased global temperatures will be net beneficial up to about 2 C. Neither of these possibilities are excluded by the IPCC, given that they represent the lower half of the uncertainty range of IPCC estimates. The question that should be raised is why the proponents of these views are so much more certain about their conclusions; particularly given that they typically exclude large parts of the relevant evidence. In short, if those opinions are to be reasonably discussed, the framing should be an attempt to allow them to defend themselves against a charge of convenient dogmatism.
-
Tom Curtis at 13:59 PM on 14 September 2016BBC climate coverage is evolving, but too slowly
Nate @5, in science, a consensus is commanded by observations. There are significant social aspects involved in how that comes about but science is a self correcting enterprise in which what drives the corrections are a determination to ensure theory matches obvservations by altering the theory where the two differ.
-
Tom Curtis at 13:54 PM on 14 September 20162016 SkS Weekly Digest #37
chriskoz @17, CDIAC (or TJBlassing, at least) gives an exponential time constant for CH4 of 12.4 years, meaning it will take about sixty years for CH4 to drop to natural concentrations, following the cessation of all anthropogenic emissions (and ignoring changes in 'natural' emissions as a result of feedbacks on changes in temperature and/or precipitation). Just saying that it has a lifetime of 12.4 years (or 10 years) may mislead some into believing essentially all CH4 will be gone in about a decade, which is false.
Further, when you use CO2eq, particularly when using all anthropogenic forcings, aerosols also have a low exponential time constant so that the rapid fall in CO2eq concentration will be, at least roughly, balanced by a rise in CO2eq concentration due to the reduction in aerosol concentrations. That is not relevant in discussing Zoli's figure which is based on greenhouse gases only, but it is relevant when discussing the more appopriate European Environment Agency figure I discuss above. The initial relatively rapid fall in CO2 concentration, given zero net anthropogenic emissions still quickly reduces the CO2eq concentration in that scenario, and sustains your very important point.
As a side note, "long lived greenhouse gases" by convention are any greenhouse gas which does not condense out of the atmosphere, ie, any greenhouse gas other than H2O, which has an exponential time constant measured in hours.
r @19, peak generation capacity is probably not the best measure given that mean generation capacity of solar is significantly less than nuclear, and that even peak generation capacity requires cloud and haze free skies on only a few days in the year, and then only around noon. More typically, daily peaks will be 10% or more less than that, and will represent a minority of the days output. Fossil fuel and nuclear power unquestionably require less space than renewables for a given generation capacity. Your example, however, certainly provides andecdotal evidence that economically solar trumps nuclear.
-
chriskoz at 13:09 PM on 14 September 20162016 SkS Weekly Digest #37
Interesting what's going on with nuclear in Alabama:
For sale: Multibillion-dollar, non-working nuclear power plant
I'm posting it here because there were discussions about advantages of nuke over renewables. Now the renewable ulitily company is placing a bid on this nuke site were $6b have been completely wasted.
I'm not going to argue about advantages of renewables over nuke, but I note that this 647ha site was meant to be generating 1.2GW of nuke power. If you covered such are with PV panels (this is what the prospective renewables buyer is likely to do) in the range of 10% efficiency, which is ~200W/m2, you will get 647,000,000*200W = 1.3GW of peak power. The same capacity as the ill-fated nuke, surely at the small fraction of the investment cost ($50m) and essentially free running to some 20y.
-
Tom Curtis at 10:19 AM on 14 September 20162016 SkS Weekly Digest #37
Zoli @16, I will add a few points to Chriskoz's excellent response.
First, the estimate of CO2eq concentration you use is for greenhouse gas concentrations only. It does not incorporate all anthropogenic impacts on Global Mean Surface Temperature. Once you include the impact of other factors, in particular that of aersols, the CO2 eq emissions as of 2014 (ie, the most recent year for which data is available) was 440.6 ppmv CO2eq. For comparison, the 2014 value from your linked source was 481 ppmv CO2eq, with a most recent value (2015) of 485 ppmv CO2eq. I take it your 487 ppmv CO2eq represents an estimate of the additional increase in the half year since the end of 2015. Similarly estimating the approximate trend increase of for all anthropogenic factors gives 446 ppmv CO2eq, or 1.6 times the preindustrial average (compared to the GHG only estimate of 1.74 times the preindustrial average. Therefore the GHG only estimate is a substantial overestimate for estimating future climate impacts.
Second, the IPCC AR5 does not give median or mean estimates of the Equilibrium Climate Sensitivity (ECS). From the estimates they do give, and a reasonable assumption about the shape of the Probability Density Function (PDF) of the ECS, it is possible to estimate that while the mean value is in the order of 3- 3.4 C, the median value (ie, the value such that we have a 50% chance of an ECS less than that) is in the order of 2.4-2.7 C. Therefore, based in the IPCC AR5, even at a CO2eq concentration of 600 ppmv, there is a 50/50 chance that we will not exceed a GMST of 2 C. (Based on mean values of the ECS, we need to keep CO2eq concentrations below 525 ppmv.)
I consider a 50/50 chance to be a "realistic chance", and also consider it a very realistic possibility that we will limit total CO2 emissions to double the 2014 increase over preindustrial values or less, ie, about 600 ppmv CO2eq. That by itself is sufficient to justify my claim.
I should note that this is little comfort to AGW deniers and those wanting a slow reduction in CO2 emissions. That is because, assuming a linear increase in damages with increase in temperure the relevant value of ECS is not the median, but the mean; and damages are likely to increase more than linearly with increased temperatures. That is why estimates of the emissions reduction task are based on values which are likely (66.6% probability) to keep GMST below 2 C, where the value minimum value which is likely to achieve that is just slightly higher than the mean estimate.
Third, based on a current CO2eq concentration of 446 ppmv, and a requirement to stabilize it at no higher than 525 ppmv by 2050, we can increase it by no more than 79 ppmv over 34 years, or in other words to limit the average increase over that period to 2.33 ppmv per annum, and with a current average increase 3.5 ppmv per year (approximately). If we reduce the increase on a linear basis, by 0.1 ppmv per annum, the average emissions over the 34 years will be about 1.8 ppmv, well below the threshold. That is clearly a physically, and technically feasible reduction program, although other reduction programs will probably be better. The reasons for pessimism, and they are reasons for grave pessimism, are entirely political. Will the leaders of the nations of the Earth have the collective will to pursue an emissions reduction program of that magnitude.
Finally, these are not my only reasons for my statement. I think it is more important that the ECS will not be achieved for many years after a stable CO2eq concentration is reached, and that with zero net emissions, the CO2eq concentration will be drawn down by the ocean fairly rapidly up to a limit. That limit is about 25% of the current CO2 concentration, which will be drawn down much more stably. That means if net emissions can be reduced to zero (and certainly not more than 5% of current values), CO2eq concentrations will fall rapidly such that by the time ECS is reached, the CO2eq concentration will result in a temperature rise approximately equal to the Transient Climat Response to the peak CO2eq concentration. That gives us significantly more leeway than calculations based on the ECS allow, as indicated by Chriskoz.
Note, again, the decision to drop down to zero net emissions is a political one, and it is far from clear that the politics will result in that decision. The approach favoured by many economists of putting a social price on CO2eq emissions and then allowing emissions to stabilize where they will will certainly result in ongoing emisisons. Indeed, it will likely result in ongoing emissions greater than 10% of peak emissions which would mean the eventual stable temperature will be in excess of that estimated from ECS, and would continue slowly rising into the future for as long as net emissions were greater than zero. However, if sensible policies are pursued, ie, any policy that secures measured reductions in global emissions, achieving net zero emissions by 2050, or net negative emissions at a slightly later date has a good chance of keeping GMST below 2 C (except in El Nino years), and a reasonable chance of keeping it below 1.5 C above preindustrial levels.
-
nigelj at 08:06 AM on 14 September 2016BBC climate coverage is evolving, but too slowly
Many media including the BBC do indeed have this fake balance issue. I see a similar thing in media in my country of New Zealand, where there is broadly a 50 / 50 split in certain specific media between warmist articles (for want of a better word) and sceptical articles. This may create an impression with some people that climate scientists are equally divided in their views, which is not the case. Over 90% of climate scientists agree we are warming the climate, according to several different carefully conducted polls.
There seems little point having sceptical articles contesting generally well established elements of the science like "the greenhouse effect".
For other sceptical articles that discuss something that is in genuine doubt, perhaps the BBC should have an advisory at the top or bottom of the article that reads basically something like this : “Advisory to readers : The BBC advises that the IPCC has determined we are warming the climate, and over 90% of climate scientists agree we are warming the climate, according to published polls (then a list of the polls).
-
chriskoz at 07:55 AM on 14 September 20162016 SkS Weekly Digest #37
Zoli@16,
You are wrong in thinking that the "GHGs equivalent of 487 ppm CO2" must stay in the atmosphere while Earth is warming in equilibrium (next 40+ years). The GHGs breakdown:

indicate that some 30% of the GHG forcing is from CH4, which increased since 1750 by about 1ppm. But CH4 has the lifetime of only 10y (the image is wrong in labeling CH4 as "long-lived") after which it oxidises to CO2. The forcing of the resulting 1ppm increase in CO2 is negligible compared to the existing CO2 forcing from 400/280 ppm. All we need to do is stop emitting CH4 and that part of forcing quickly goes to essntially zero.
Secondly, if CO2 emissions ceased today, it would not stay at 400 ppm forever but would slowly equilibrate with ocean reservoir over the next few decades or so, while the temperature is, hopefully still reaching the equillibrium. Read e.g. Archer 2005 for details. The bottom line is: current CO2 amount of 400ppm is not "locked". Only about 15-25% of the 400/280 in crease (i.e. 30-40ppm) will stay in the atmosphere for 100s thousand y (essentially forever).
So currently, the amount of "locked CO2" is 310-320 ppm only. Of course realistically, it will be more because of continued emissions and science denial by FF interest groups, but cetainly not yet as high as you claim (487ppm).
-
Nate12674 at 07:42 AM on 14 September 2016BBC climate coverage is evolving, but too slowly
I think part of what Abloke said is worth discussing. He is putting down science consensus about a theory as being inferior to science facts. In my viw all science, whether observations, or theory, become accepted and established by consensus.
-
Nick Palmer at 23:02 PM on 13 September 2016BBC climate coverage is evolving, but too slowly
ABloke. You haven't got a clue about the reality of the situation as you clearly don't know what you are talking about.
Prev 474 475 476 477 478 479 480 481 482 483 484 485 486 487 488 489 Next


