


 Arguments


Recent Comments
Prev 478 479 480 481 482 483 484 485 486 487 488 489 490 491 492 493 Next
Comments 24251 to 24300:
-
Paul D at 18:41 PM on 3 September 2016Coordinator of UK Ocean Acidification Research Attacks The Spectator for 'Willfully Misleading' James Delingpole Column
The likes of Delingpole continually present confusing and contradicting arguments to support a political ideology.
Political ideologies will always lie and contradict their own arguments to support their flawed ideologies (this includes the left and unions).
In Delingpoles case he is contradicting the long held view that 'global warming' sciences can not possibly make predictions because the system being analysed is to complicated. Whilst here he is claiming a few hours science will do the job (to satisfy his ideology).
-
RedBaron at 17:05 PM on 3 September 2016Breathing contributes to CO2 buildup
@ 66 Tom Curtis,
You seem to be mixing science and technology with industrialization. Not all technology is industrial in nature. This is important to remember in agriculture.
The other important thing to remember is that counter intuitively, biological systems yield more when not overused. For example, a fishery that is overfished, yields fewer tons of fish per year than a fishery that is not overfished. Grassland that is overgrazed yields less meat per acre per year than grassland that is properly grazed. Forests that are over timbered yield less wood per acre per year than forests properly managed. We are so wired into net sum zero thinking that people often miss that.
So yes, agriculture (including fisheries) could sustain populations much higher than we currently have, even though the current population already exceeds carrying capacity. We simply need to use holistic systems models of production instead of net sum zero industrial models of production.
Don't get me wrong. Industrial models are very good at some things. But when it comes to biological systems, far from ideal.
-
nigelj at 08:53 AM on 2 September 2016Americans Now More Politically Polarized On Climate Change Than Ever Before, Analysis Finds
The Republicans seem to be taking a very fixed attitude of climate change denial. American conservatives appear to be retreating into very fixed beliefs, and appear afraid of a world that is changing outside of America.
European conservatives are more flexible and receptive to climate change science, probably because two wars on their continent have led to people seeing the need to compromise and cooperate.
Americans emphasise individuality more, and constitutional freedoms. Peoples are shaped by their past histories and America and Europe differ in many regards.
-
ubrew12 at 06:52 AM on 2 September 2016Coordinator of UK Ocean Acidification Research Attacks The Spectator for 'Willfully Misleading' James Delingpole Column
Delingpole: "Does this prove that global warming is not a problem? No it doesn’t. What it does do is lend credence to... sceptics..." Translation: "I have no idea if AGW is a problem or not. However, if you want to know what to do about it, you should listen to me and not those Scientists." It used to be rare to see such public displays of 'the superiority of ignorance', but this is Trump's World, now.
-
Tom Curtis at 10:24 AM on 1 September 2016Breathing contributes to CO2 buildup
MDMonty @65, IMO it is dubious that a preindustrial revolution technology could sustain population levels at even a quarter of current levels. Primarily that is because it would not be able to sustain the vast energy inputs into food production; but also because the much slower transport speeds would necessitate the majority of food consumption to be from local or close (over sea) distances. The UK may be able to source wheat from the US, for instance, but not most vegetables or fruit, and not much in the way of meat; simply due to spoilage. A sustainable population level at those industrial levels would be in the order of half to a billion people.
More interesting is the sustainable population at current, or likely near future technologies. I think the evidence is that we have already exceeded it, though primarilly due to the proportion of land committed to food intake, plus the overfishing of the oceans. Simply as regards global warming, we can sustain the current population on greenhouse free energy and transport system, possibly at a higher standard of living than is currently common in Western Countries. That, however, requires a major effort to transition; as the current population with the current energy mix is clearly unsustainable.
-
MDMonty at 09:43 AM on 1 September 2016Breathing contributes to CO2 buildup
For clarity's sake: it appears the role of human respiration ("Does breathing contribute to CO2 buildup in the atmosphere?") wrt CO2 buildup amounts to a zero sum when including photosynthesis. In essence this describes a natural sort of equilibrium.
I completely agree insofar as the science itself goes (and the provided formulas-thanks)
Pragmatically -somewhat referring to #64 response (Pointfisha) above- the population of humans is increasing alongside deforestation, excluding deforestation where it is a consequence of industrialization.
This seems to indicate that mass consumption of meat (specifically beef & lamb) has a significant impact on climate.
I guess I am asking what an acceptable human population would be, assuming pre-1750 (pre-Industrial Revolution) technology, in keeping with keeping CO2 levels static or reducing them from current levels. Another way of asking this: at what population will human respiration outstrip the capacity of photosynthesis?
I do realize my query is flawed in that is purely theoretical, and perhaps even dumb: excludes other natural sources of CO2 (vulcanism, animal respiration) but those variables seem outside the scope of this article.
-
chriskoz at 08:50 AM on 1 September 20162016 SkS Weekly Digest #35
On the mitigation front in OZ, Turnbull gov seems to be continuing discredited policy of his predecessor:
Climate Change Authority's key report 'neglects to join the dots', critic says
In an unprecedented move, two of the authority's 10 members – climate scientist David Karoly and public ethics professor Clive Hamilton – plan to release a dissent report within days to highlight their disagreements with the final study.
Thank you David & Clive. I'm looking forward to it.
-
bozzza at 20:01 PM on 31 August 2016Global warming is melting the Greenland Ice Sheet, fast
Rates of change is what matters: good question and good answer.
(Shape forms in time....)
-
Bob Loblaw at 10:44 AM on 31 August 2016Temp record is unreliable
I will also mainly let Tom and Glenn respond to DarkMath, only interjecting when I can add a little bit of information.
For the moment, I will comment on Glenn's description of the US cooperative volunteer network and comparisons between manual and automatic measurements.
I am more familair with the Canadian networks, which have a similar history to the US one that Glenn describes. A long time ago, in a galaxy far, far away, all measurements were manual. That isn't to say that the only temperature data that was available was max/min though: human observers - especially at aviation stations (read "airports") - often took much more detailed observations several times per day.
A primary focus has been what are called "synoptic observations", suitable for weather forecasting. There are four main times each day for synoptic observations - 00, 06, 12, and 18 UTC. There are also "intermediate" synoptic times at (you guessed it!) 03, 09, 15, and 21 UTC. The World Meteorological Organization tries to coordinate such readings and encourages nations to maintain specific networks of stations to support both synoptic and climatological measurements. See this WMO web page. Readings typically include temperature, humidity, precipitation, wind, perhaps snow, and sky conditions.
In Canada, the manual readings can be from their volunteer Cooperative Climate Network (CCN), where readings are typically once or twice per day and are usually restricted to temperature and precipitation, or from other manual systems that form part of the synoptic network. The observation manuals for each network can be found on this web page (MANOBS for synoptic, MANCLIM for CCN). Although the CCN is "volunteer" in terms of readings, the equipment and maintanance is provided to standards set by the Meteorological Service of Canada (MSC). MSC also brings in data from many partner stations, too - of varying sophistication.
Currently, many locations that used to depend on manual readings are now automated. Although automatic systems can read much more frequently, efforts are made to preserve functionality similar to the old manual systems. Archived readings are an average over the last minute or two of the hour, daily "averages" in the archives are still (max+min)/2. Canada also standardizes all time zones (usually) to a "climatological day" of 06-06 UTC. (Canada has 6 time zones, spanning 4.5 hours.) It is well understood that data processing methods can affect climatological analysis, and controlling these system changes is important.
-
DarkMath at 09:42 AM on 31 August 2016Temp record is unreliable
Thanks for all the responses everyone, they're very helpful. Michael is correct, I'm still working through the data. Actually I haven't even started as I was travelling today for work and only got back just now.
Moderator Response:[RH] Just a quick reminder: When you post images you need to limit the width to 500px. That can be accomplished on the second tab of the image insertion tool. Thx!
-
Dcrickett at 06:01 AM on 31 August 2016Katharine Hayhoe on Climate and our Choices
Using an individual's hereditary factors and lifestyle choices as an analogy to climate's natural factors and greenhouse gas emissions is a brilliant approach to communicating climate matters. I plan to use it.
-
jja at 02:25 AM on 31 August 2016California has urged President Obama and Congress to tax carbon pollution
I like to quote James Hansen during his interview with Amy Goodman of DemocracyNow! at the Paris COP21 regarding their efforts.
Well, we have to decide: Are these people stupid, or are they just uninformed? Are they badly advised? I think that he really believes he’s doing something. You know, he wants to have a legacy, a legacy having done something in the climate problem. But what he’s proposing is totally ineffectual. I mean, there are some small things that are talked about here, you know, the fact that they may have a fund for investment, invest more in clean energies, but these are minor things. As long as fossil fuels are dirt cheap, people will keep burning them.
AMY GOODMAN: So, why don’t you talk, Dr. James Hansen, about what you’re endorsing—a carbon tax?
JAMES HANSEN: Yeah.
AMY GOODMAN: What does it mean? What does it look like?
JAMES HANSEN: Yeah. It should be an across-the-board carbon fee. And in a democracy, it’s going to—it should—the money should be given to the public. Just give an equal amount to every—you collect the money from the fossil fuel companies. The rate would go up over time, but the money should be distributed 100 percent to the public, an equal amount to every legal resident.
I completely agree, falsified carbon credits in a trading scheme designed by wall street to increase revenues will be a disaster for future generations. Carbon Tax not Cap and Trade!
-
michael sweet at 00:06 AM on 31 August 2016Temp record is unreliable
I think that Darkmath is working through the data. I think Glenn and Tom will provide better answers to his questions than I will. I think Darkmath is having difficulty responding to all the answers they get. That is dogpiling and is against the comments policy. I would like to withdraw to simplify the discussion.
As a point of interest, earlier this year, Chris Burt at Weather Underground had a picture on his blog of the min/max thermometer at Death Valley, California, showing the hottest reliably measured temperature ever measured world-wide. (copy of photo). This thermometer is still in use. Apparently the enclosure is only opened twice a day (to read the thermometer). Min/max thermometers are still in use, even at important weather stations.
-
Tom Curtis at 23:19 PM on 30 August 2016Temp record is unreliable
DarkMath @365, as indicated elsewhere, the graph you show exagerates the apparent difference between versions of the temperature series by not using a common baseline. A better way to show the respective differences is to use a common baseline, and to show the calculated differences. Further, as on this thread the discussion is on global temperatures, there is no basis to use Meteorological Station only data, as you appear to have done. Hence the appropriate comparison is this one, from GISTEMP:

Note that the Hansen (1981) and Hansen (1987) temperature series did not include ocean data, and so do not in this either.
For comparison, here are the current GISTEMP LOTI and BEST LOTI using montly values, with the difference (GISS-BEST) also shown:
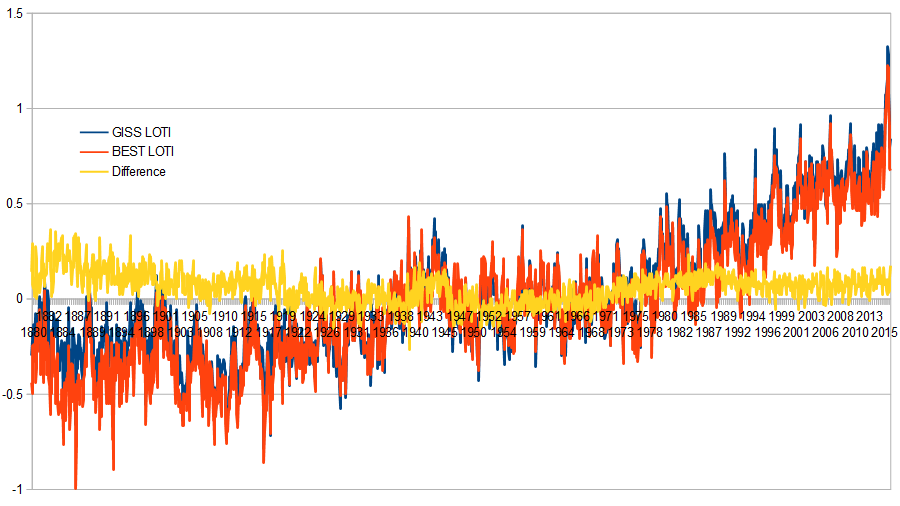
On first appearance, all GISTEMP variants prior to 2016 are reasonable approximations of the BEST values. That may be misleading, as the major change between GISSTEMP 2013 and 2016 is the change in SST data from ERSST v3b to ERSST 4. Berkely Earth uses a HadSST (version unspecified), and it is likely that the difference lies in the fact that Berkely Earth uses a SST database that does not account for recent detailed knowledge about the proportion of measurement types (wood or canvas bucket, or intake manifold) used at different times in the past.
Regardless of that, the difference in values lies well within error, and the difference in trend from 1966 onwards amounts to just 0.01 C per decade, or about 6% of the total trend (again well within error). Ergo, any argument on climate that depends on GISS being in error and BEST being accurate (or vice versa) is not supported by the evidence. The same is also true of the NOAA and HadCRUT4 timeseries.
-
Glenn Tamblyn at 16:24 PM on 30 August 2016Temp record is unreliable
Darkmath
I don't know for certain but I expect so. There was no other technology available that was cheap enough to be used in a lot of remote stations and often unpowered stations. Otherwise you need somebody to go out and read the thermometer many times a fday to try and capture the max & min.
The US had what was known as the Cooperative Reference network. Volunteer (unpaid) amateur weather reporters, often farmers and people like that who would have a simple weather station set up on their property, take daily readings and send them off to the US weather service (or its predecessors).
Although there isn't an extensive scientific literature on the potential problems TObs can cause when using M/M thermometers, there are enough papers to show that it was known, even before consideration of climate change arose. People likethe US Dept of Agriculture did/do produce local climatic data tables for farmers - number of degree days etc. - for use in determining growing seasons, planting times etc. TObs bias was identified as a possible inaccuracy in those tables. The earliest paper I have heard of discussing the possible impact of M/M thermometers on the temperature record was published in England in 1890.
As to BEST vs NOAA, yes the BEST method does address this as well. Essentially the BEST method uses rawer (is that a real word) data but apply statistical methods to detect any bias changes in data sets and correct for them. So NOAA target a specific bias change with a specific adjustment, BEST have a general tool box for finding bias changes generally.
That both approaches converge on the same result is a good indicator to me that they are on the right track, and that there is no 'dubious intent' as some folks think. -
Bob Loblaw at 13:18 PM on 30 August 2016Temp record is unreliable
Darkmath:
I don't think it has been linked to yet, but there is also a post here at Skeptical Science titled "Of Averages and Anomalies". It is in several parts. There are links at the end of each pointing to the next post. Glenn Tamblyn is the author. Read his posts and comments carefully - they will tell you a lot.
Moderator Response:[PS] Getting to close to point of dog-piling here. Before anyone else responds to Darkmath, please consider carefully whether the existing responsers (Tom, Michael,Glenn, Bob) have it in hand.
-
DarkMath at 11:50 AM on 30 August 2016Temp record is unreliable
Thanks Glenn. Was the Min/Max thermometer used for all U.S. weather stations early in the 20th century? What percent used Min/Max? Where could I find that data?
One other thing regarding the technique I suggested where a change in measurement means the same weather station is treated as an entirely new one. That's the technique the BEST data is using and they got the same results as NASA/NOAA did with adjustments. Does that address the problems you raise with the "simpler" non-adjustment technique?
-
DarkMath at 11:38 AM on 30 August 2016Temp record is unreliable
Thanks Michael for referencing the BEST data, they seem to be employing the simpler technique where any change in temperature recording is treated as an entirely new weather station. I'll look into further.
Regarding the change in adjustments/estimates over time being due to computing power that seems like a stretch to me. Given Moores Law in 30 years they could look back to the techniques employed today and say the same thing. Who knows what new insites Quantum Computers will yield when they come online.
Actually my real question is about the BEST data matching up with results NASA/NOAA got using adjustments/estimates. Which iteration do that match up with, Hansen 1981, GISS 2001 or GISS 2016?
 Moderator Response:
[PS] The simplist way to find what the adjustment process was and why the changes is simply to read the papers associated with each change. GISS provide this conveniently here http://data.giss.nasa.gov/gistemp/history/ (Same couldnt be said for UAH data which denier sites accept uncritically).
(Also fixed graphic size. See the HTML tips in the comment policy for how to do this yourself)
[TD] You have yet to acknowledge Tom Curtis's explanation of the BEST data. Indeed, you seem in general to not be reading many of the thorough replies to you, instead Gish Galloping off to new topics when faced with concrete evidence contrary to your assertions. Please try sticking to one narrow topic per comment, actually engaging with the people responding to you, before jumping to another topic.
-
Glenn Tamblyn at 11:38 AM on 30 August 2016Satellite record is more reliable than thermometers
Darkmath
Since the Satellite and ground series have different baseline periods, they can't be directly compared easily. Generally the satellite data sets are around 5 times less accurate than the ground datasets - stitching together a coherent redord from multiple satellites, with lots of technical issues is quite hard.One transition that occurred around 2000 was the switch from Microwave Sounding Units (MSU) to the Advanced Microwave Sounding Units (AMSU) on later satellites. Although the basic concepts of how temperatures are measured is the same, there are potentially important differences that may have had an impact.
-
Glenn Tamblyn at 11:28 AM on 30 August 2016Temp record is unreliable
Darkmath
Just to clarify one point, regarding time of observation. Until the introduction of electronic measurement devices, the main method for measuring surface temperatures were maximum/minimum thermometers. These thermometers measure the maximum and minimum temperatures recordedsince the last time the thermometers were reset. Typically they were read every 24 hours. Importantly they don't tell you when the maximum and minimum were reached, just what the values were.
If one reads a M/M thermometer in the evening, presumably you get the maximum and minimum temperatures for that day. However they can introduce a bias. Here is an example.
Imagine on Day 1 the maximum at 3:00 pm was 35 C and drops to 32 C at 6:00 pm. So the thermometers are read at 6:00 and the recorded maximum is 35 C. Then they are reset. The next day is milder. The maximum is only 28 C at 3:00 pm, dropping to 25 C at 6:00 pm when the thermometer are read again. We would expect them to read 28 C, that was the maximum on day 2.
However, the thermometer actually reports 32 C !!! This was the temperature at 6:00 pm the day before, just moments after the thermometer was reset. We have double counted day 1 and added a spurious 7 4 C [edit Whoops, can't count]. This situation doesn't occur when a cooler day is followed by a warmer day. And an analogous problem can occur with the minimum thermometer if we take readings in the early morning, there is a double counting of colder days.
The problem is not with when the thermometer was read, the problem is that we aren't sure when the temperature was read because of the time lag between the thermometer reading the temperature, and a human reading the thermometer. This is particularly an issue in the US temperature record and is referred to as the Time of Observation Bias. The 'time of observation' referred to isn't the time of measuring the temperature, it is the later time of observing the thermometer.
The real issue isn't the presence of a bias. Since all the datasets are of temperature anomalies, differences from baseline averages, any bias in readings tends to cancel out when you subtract the baseline from individual readings;
(Reading + Bias A) - (Baseline + Bias A) = (Reading - Baseline).
The issue is when biases change over time. Then the subtraction doesn't remove the time varying bias:
(Reading + Bias B) - (Baseline + bias A) = (Reading - Baseline) + (Bias B - Bias A)
The problem in the US record is that the time of day when the M/M thermometers were read and reset changed over the 20th century. From mainly evening readings (with a warm bias) early in the century to mainly morning readings (with a cool bias) later. So this introduced a bias change that made the early 20th century look warmer in the US, and the later 20th century cooler.
Additionally, like any instrument, the thermometers will also have a bias in how well they actually measure temperature. But this isn't a bias that is effected by the time the reading is taken. So this, as a fixed bias, tends to cancel out.
So these instruments introduce biases into the temperature record that we can't simply remove by the sort of approach you suggest. In addition, since most of the temperature record is trying to measure the daily maximum and minimum and then averages them, your suggested approach, even if viable would simply introduce a different bias - what would the average of the readings from your method actually mean?
In order to create a long term record of temperature anomalies, the key issue is how to relate different time periods together and different measurement techniques to produce a consistent historical record. Your suggested approach would produce something like 'during this period we measured an average of one set of temperatures of some sort, A, and during a later period we measured an average of a different set of temperatures of some sort, B. How do A and B relate to each other? Dunno'.
More recent electronic instruments now typically measure every hour so they aren't prone to this time of observation bias. They can have other biases, and we also then need to compensate for the difference in bias between the M/M thermometers, and the electronic instruments.
-
ubrew12 at 10:46 AM on 30 August 2016Report Shows Whopping $8.8 Trillion Climate Tab Being Left for Next Generation
Joel_Huberman@2: As long as people realize that the actual bill presented to millenials has as much probability of being $18 trillion as being $0 trillion. The fact that economics cannot 'show' a solid number is already 'estimated' in the statistics.
-
michael sweet at 10:42 AM on 30 August 20161934 - hottest year on record
DarkMath,
I responded to you here.
Most experienced readers follow the comments page here where all your posts, and the responses, will show up.
-
michael sweet at 10:39 AM on 30 August 2016Temp record is unreliable
Darkmath,
Responding to Darkmath here. Tom will give you better answers than I will.
It appears to me that you agree with me that your original post here where you apparently have a graph of the completely unadjusted data from the USA is incorrect. The data require adjusting for time of day, number of stations etc. We can agree to ignore your original graph since it has not been cleaned up at all.
I will try to respond to your new claim that you do not like the NASA/NOAA adjustments. As Tom Curtis pointed out here, BEST (funded by the Koch brothers) used your preferred method of cleaning up the data and got the same result as NASA/NOAA. I do not know why NASA/NOAA decided on their corrections but I think it is historical. When they were making these adjustments in the 1980's computer time was extremely limited. They corrected for one issue at a time The BEST way is interesting, but that does not mean that the BEST system would have worked with the computers available in 1980. In any case, since it has been done both ways it has been shown that both ways work well.
It strikes me that you have made strong claims, supported with data from denier sites. Perhaps if you tried to ask questions without making the strong claims you will sound more reasonable. Many people here will respond to fair questions, strong claims tend to get much stronger responses.
My experience is that the denier sites you got your data from often massage the data (for example by using data that is completely uncorrected to falsely suggest it has not warmed) to support false claims. Try to keep an open mind when you look at the data.
-
nigelj at 09:23 AM on 30 August 2016California has urged President Obama and Congress to tax carbon pollution
In my opinion carbon taxes have plenty of merit. Consider that electric vehicles have good potential to reduce emissions, but uptake is slow because they have about a $5,000 price premium (or more) and a lack of recharging stations, and people are understandably hesitant to make the change.
It just seems that a carbon tax on oil or petrol, or alternatively more directly on fossil fuel companies, may be enough to encourage electric cars, and perhaps would get them across the line without the tax having to be too high. The tax collected could also subsidise the purchase price of the vehicles.
I have been reading about emissions trading schemes, and these things are enormously complicated, and the link between the schemes and encouraging electric cars seems very tenuous to me. The European Union emissions trading scheme has not produced particularly spectacular results. There is very slow uptake of electric vehicles and while wind farms have increased, the windfarms seem to be from subsidies, rather than the emissions trading scheme.
Some of these carbon trading units originate in countries that do not rank terribly high in freedom from corruption surveys, yet the units or credits can be globally traded. I honestly wonder what value they would really have, and how you could even determine their integrity. A carbon tax would be inherently more transparent.
Emissions trading units are also linked to planting of forests. This is nice in theory as forests are a carbon sink, but we are not really too sure how good this carbon sink is, and it relies on a very strict system of planting and felling trees. There is a risk that over reliance is put on tree planting, rather than reducing emissions at source. In comparison a carbon tax hits the source of emissions, and tree planting could be simply subsidised with the tax collected as a backup plan.
-
Tom Curtis at 08:42 AM on 30 August 20161934 - hottest year on record
DarkMath @53, first, when comparing temperature anomalies (as shown in the two graphs above), you need to provide them with a common baseline - ie, the interval with a mean temperature of 0. Failure to do so can create a strong apparent visual discrepancy even between temperature series which are isomorphic. It is very evident in your first graph that no such common baseline is calculated, with not even a single data point having common values, let alone a 30 year period with a common mean. If you employ a common mean, the comparison looks like this:

Second, there are several differences between the 1981 and the 2016 product. Of these, the most important are:
1) An increase in the number of reporting stations from around 1000 (1981) to around 2200 (1987), to around 7,200 (1999-to 2015), to 26,000 (2016 but possibly not yet implimented). The differences in station numbers reporting at a given time between 1987 and now are shown below. In 1981, the number of reporting stations is half that of 1987, though no doubt following a similar pattern over time;

2) The introduction of adjustments for station moves, instrument changes, etc from the 1990s (detailed in a 1999 publication;
3) The introduction of adjustments for the urban heat island effect (1999), and the switch of classification of urban areas from a classification based on population to one based on the intensity of night lights as observed from satellite (2010);
In addition for the full global Land Ocean Temperature Index, the use of Sea Surface Temperature data started in 1995, and the way temperatures over sea ice was changed in 2006 to better reflect the fact that sea ice insulates the overlying air layer from the SST. These changes do not effect the above graph, which are based on the Meteorological Station only data.
IMO, it is thoroughly unrealistic to expect such changes to have no impact on the estimate of global temperature. Nor is it realistic to expect that because in 1981, no adjustments for station moves etc (because Hansen did not have access to the station metadata to make such adjustments possible, nor under undertaken the research that would provide the theoretical justification for how those adjustments are made), nor to incorporate more data as it becomes available. And now that you are on record as endorsing the methodology of the BEST temperature series (@54), here is a comparison of the BEST temperature series with that from the NCDC, which uses the same data as does GISTEMP:
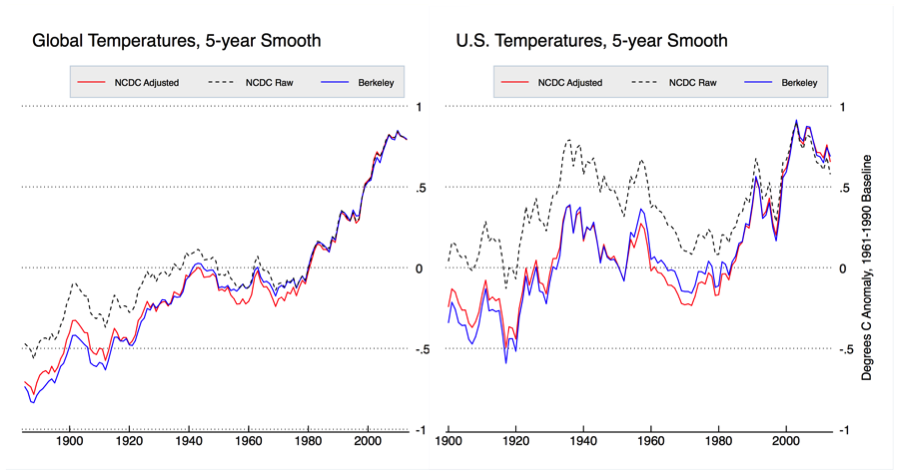
Clearly, if we are to trust the BEST temperature series, we should conclude that the adjustments by NOAA, and ipso facto by GISS, have improved the data. Further, if we adopt the logic that we should automatically distrust measurements which purportedly improve over time, we should not accept modern determinations of the speed of light, which have inflated by 50% over the original measure in 1675.
With regard to the satellite data:
1) The satellite, TLT data measures a weighted average of atmospheric temperatures from 0 to 12,000 meters, whereas the surface temperture data measures a hybrid of the 2 meter air temperature over land, and the SST over sea. These are not the same thing, nor are they expected to change in lock step:

2) The satelite TLT data is far more greatly effected by ENSO and volcanic temperature fluctuations, making it much noisier. As a result of this, the strong El Nino in 1997/98 along with the strong La Ninas in 2008 and 2011/2012 have a much larger effect on the short term trend post 1998.
3) The satelite TLT data has four or five major versions from different teams, all using precisely the same data but with much larger differences in trend etc than the different land surface series (most using different data, and all using different methodologies). Prima facie, that indicates the TLT temperature series is less well known than is the surface temperature series.
4) The particular satellite temperature series you use (RSS) has just had a major revision increasing the post 1998 trend in its TMT dataset. That revision will have a similar impact on the as yet unrevised TLT dataset once the revision is made, so we know the data show in not currently accurate.
The use of satellite data to construct a temperature series requires far more adjustments than is required for the surface temperature series; and there is no consensus among those working in that field as to the correct way to make those adjustments. Further, as noted above, the different way of making those adjustments has a significant impact on the final product (unlike the case with the surface products, where different methods come up with essentially the same result). Given that, in a case where surface and satellite data disagree, there is no question that the surface data should be considered a more reliable indication of the surface trend.
Moderator Response:[TD] Thank you, Tom, for carefully reading DarkMath's comment, for responding specifically to his/her points, for responding in detail and thoroughly, and for responding with referenced evidence rather than handwaving, personal incredulity, and implications or even accusations of conspiracies. DarkMath, please follow Tom's example in your commenting style.
(Tom, we are trying to move this discussion to the appropriate threads, so in future please respond to DarkMath on those other threads.)
-
DarkMath at 07:48 AM on 30 August 2016Satellite record is more reliable than thermometers
I'm hoping someone could explain the following chart showing a clear divergence between satellite and land temps starting around the year 2000:
The satellites and land measurements roughly agree from 1980-2000 so there must be some validity to satellite measurement. I read there isn't consensus on whether there has been a pause in global warming from 2000-2016. Many climate scientists like Michael Mann agree there was no warming. Others say there was warming. Who's right? How does that effect this chart. Why did satellites measurement become unreliable starting in 2000? I'm not trying to be inflammatory I just don't know who to believe.
Thanks in advance.
Moderator Response:[TD] There are several possibilities, and probably all of them are contributing. See Tamino's post on RSS's remaining divergence even after RSS started publishing a new version (4.0) that partly corrected for satellite drift. Be sure to read the comments on that post. Also read Tamino's earlier post that used RSS's earlier version (3.3) that did not correct for drift, and be sure to read the comments there too.
For more background, read Eli Rabbett's post "UAH TLT Series Not Trustworthy." Then read his post "Ups and Downs." Then read his post "Mind Bending," and click the links within that post. You should read the comments in all three posts.
You are incorrect about "the pause." Start by reading the post "Aerosol emissions key to the surface warming ‘slowdown’, study says." Click the links in that post to read about why a short period of surface warming being slower than the periods immediately before and after it, is not the same as a pause even in surface warming, and is wholly inadequate evidence of a pause or even a slowdown in the underlying trend even in the surface warming let alone of the whole system warming.
[RH] Fixed image size.
-
John Hartz at 07:44 AM on 30 August 20161934 - hottest year on record
DarkMath:
In comment #53, you state:
I don't have any skin in the game here. I have a strong science background but only deal with medical data all day long.
In comment #54, you state:
If I've learned one thing in my engineering career it's always go with the simplest option first.
Does your "engineering career" include dealing with medical data all day long?
-
DarkMath at 06:34 AM on 30 August 20161934 - hottest year on record
michael sweet: "without adjusting for differrences in number of sites, location of sites or time of day of measurements"
There are many different ways to clean up data. For example adjusting for changes in the time of day. Say a weather stations data from 1900 - 1950 was taken at 12:00pm and from 1950 - 2000 it was taken at 1:00pm.
NASA/NOAA's approach to clean the data is by far the most complicated. It didn't have to be. You could start out in this case without making any adjustments at all. You simply treat them as two separate data sets. Voila. All that matters is that weather stations change in recorded temperature at a specific time. You reduce it to a rate of change, one set for the 12:00pm and another for 1:00pm. It no longer matters what time the temperature was taken because using 2 datasets instead of one removes time of measurement as a variable. The same would hold true for an elevation change or change in location.
NASA/NOAA didn't even attempt this simple option. Instead they went with some hefty calculations to make that one stations 100 years of data appear if it was all taken at the same time, the same location and same elevation. That's great, it's worth doing but shucks that is a lot of work. If anything the much simpler "treat a change in time/elevation/location" as if it were another weather station technique could be used to validate the more complicated approach. If I've learned one thing in my engineering career it's always go with the simplest option first.
Moderator Response:[PS] This is getting offtopic here. Please post any responses to Darkmath about how the temperature record is adjusted to "Temp record is unreliable".
Darkmath - put any further responses you wish to make over adjustment there too please.
[TD] Darkmath, read the Advanced tabbed pane on that thread before commenting there. You also must actually read Tom Curtis's response to you, in which he already explained the BEST team's approach of not making any adjustments. Then you must respond to his comment explicitly (on the thread that moderator PS has pointed you to). I write "must," because SkS comments are for discussion, not sloganeering. "Sloganeering" includes failing to engage with respondents substantively.
[JH] I flagged DarkMarth for sloganeering upstream on post #48. I also advised him to read the SkS Comments Policy and to adhere to it.
-
Dcrickett at 02:36 AM on 30 August 2016California has urged President Obama and Congress to tax carbon pollution
“You can lead a horse to water…” may apply to the US Congress, neither of whose houses is of good repute these days. (Here in Illinois, our legislature is the stuff of which legends are made.) Nevertheless, climate action is a matter of global concern; serious action at state and local levels offers minimal benefits and possible serious economic drawbacks.
The US, as a major economic power, can impose a Carbon Tax along with tariffs on imports and rebates on carbon fees paid, to nullify any advantage non-taxing foreign economic entities might have by avoiding an equivalent Carbon Tax. Even better, the tariffs paid on imports from such entities would accrue to the coffers of the US treasury, with nothing going to the non-taxing (or under-taxing) foreign governments. There is wisdom in the slogan “Carbon Taxation in One Country,” a paraphrase of the slogan associated with Iosif Dzhugashvili, altho in this case with an international intent more commonly associated with Lev Bronstein.
The US Congress can impose such a tax, together with the corresponding tariffs and rebates. However, no individual State among these United States can so do.
We Americans should do all we can to get our Congress to do so. No other country has the global economic power to do so, save perhaps China.
-
DarkMath at 00:17 AM on 30 August 20161934 - hottest year on record
Tom Curtis, you have valid points about why the temperature needs to be adjusted and/or estimated. But the problem is those adjustments and estimates change over time:
The more the temperature record changes the less confidence I have in it.
Then there is the discrepency between NASA's land and satellite temperature data. They don't always match up. For example here:
I don't have any skin in the game here. I have a strong science background but only deal with medical data all day long. I'm an objective observer of climate science. But I got to tell you though is the more I read the more I think the science definitely doesn't appear "settled". And given I've become an expert in observing human scientific endeavor over the past 30 years, :-), I always expect the worst.
Moderator Response:[TD] All the adjustments, both procedures and individual raw and adjusted data, are publicly available--along with the rationales for the repeatedly improved adjustment methods. You are welcome to state on SkS your specific objections to any of those procedures, rationales, or data. But you are not welcome to simply state, without referring to any of that evidence, that you just don't trust the adjustments, because that implies that you don't trust the scientists no matter how publicly and thoroughly they document their work, which implies that you are unwilling to discuss evidence. The SkS comments are for evidence-based discussions. All that I've just told you to address, must appear in the thread that moderator PS pointed you to, not this thread.
Regarding satellite measurements of temperature, read the post "Which is a more reliable measure of global temperature: thermometers or satellites?" Comment further on that topic on that thread, not this one. I strongly suggest that before commenting there you also read the post "Satellite measurements of warming in the troposphere"--all three tabbed panes, but especially the Advanced one. You should hesitate to assume the satellite temperature indices are superior to surface and balloon indices especially because those satellite indices started to diverge from both surface and balloon indices around the year 2000 when the satellite instruments were switched.
[RH] Please limit images to 500px.
-
Glenn Tamblyn at 18:52 PM on 29 August 20162016 SkS Weekly News Roundup #35
chriskoz
The Uni Bremen chart shows concentration differences across the pack more clearly than the NSIDC chart HK showed:
More interestingly, although it is more work, is to have followed the evolution of the ice pack over the season through direct imagery from Lance-MODIS. Major cracking events north of the Canadian Archipelago and often close to the Pole, lots of broken up floes across not just the peripheral seas but into the Central arctic basin on and off again over months. They move apart slightly, compact, refreeze together a bit. If 3-4 meter thick multi-year ice breaks up into flows that refreeze, the 'joints' are thinner, weaker. You can often see this in the Lance-Modis images.They are all indications of an ice pack that has less structural integrity. So concentrations maps such as above are an end of season consequence of a far more broken up ice pack. And a series of strong storms in the last few weeks has also contributed.
So by poor I mean mechanical integrity.
As to thickness, PIOMAS only updates every month. DMI update there volume product almost daily and it is suggesting a significant drop over August. There are some concerns that the model DMI uses isn't as robust as PIOMAS but still it is probably useful as indicative of relative changes until PIOMAS updates. And we all wish Cryosat 2 was operational during the melting season :-(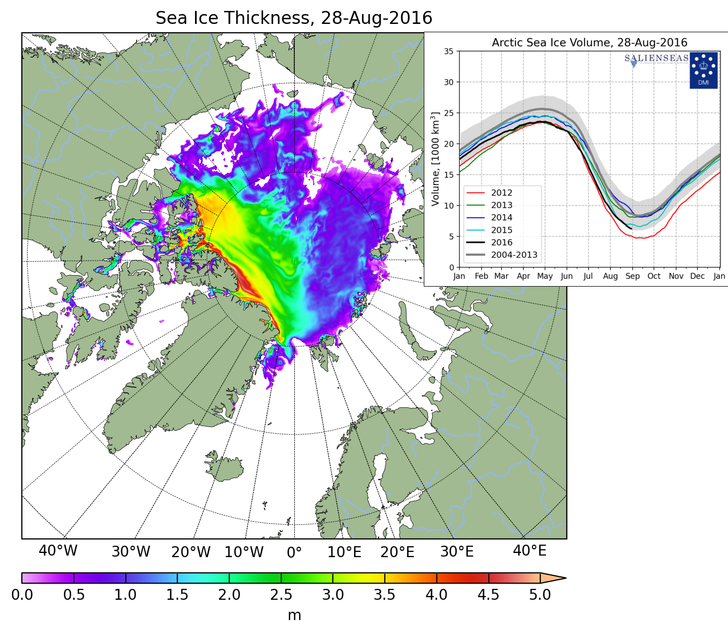
If you haven't been there Neven's Arctic Sea Ice Blog is good value. His graphs page here links to all sorts of sources. Check out the Regional Graphs pages for basin level graphs produced by one of his regular users, Wipnius, from raw satellite feeds. Then visit his forum. Lots of knowledgeable people who live and breath the arctic.
-
2016 SkS Weekly News Roundup #35
 Chriskoz:
Glenn is probably referring to this chart of the sea ice concentration. Note the large regions on the Siberian side with less than 50% concentration. With some care I guess it would be possible to maneuver a small boat between the ice floes in much of that region. After this coming winter, the so-called multiyear ice will contain lots of thin first year ice. -
One Planet Only Forever at 14:22 PM on 29 August 20162016 SkS Weekly News Roundup #35
I have noticed that in the NSIDC records for Arctic Ice Extent (Charctic Interactive Sea Ice Graph) the fluctuation of extent appears to be noticeable lower one or two years after significant El Nino events (using the NOAA ONI values to identify significant El Nino events).
- 1999 and 2000 had significantly lower extents than 1998
- 1984 and 1985 had significantly lower extents than 1983
- 1990 and 1991 had significantly lower extents than 1987/88 (the warm ONI values started in 1986 and continued through 1988)
- 1993 and 1995 had significantly lower extents than 1992
- 2005 had a significantly lower extent than 2003
- 2012 had a significantly lower extent than 2010
If there is a reason for the minimums to drop in the years immediately following an El Nino then 2017 or 1018 would likely be a minimum that is clearly lower than 2012.
-
chriskoz at 13:33 PM on 29 August 20162016 SkS Weekly News Roundup #35
Glenn@3,
The state of much of the ice pack up thre is very poor, with near record low concentrations over 1/2 the Arctic
We'll have more data as the melting season concludes soon but I want to know the emerging picture now. Your statement is very vague. What do you mean by "very poor"? By PIOMAS metric (click to see the original), the ice volume runs quite low but higher than 2011, 2013 and of course 2012.

-
Glenn Tamblyn at 12:17 PM on 29 August 20162016 SkS Weekly News Roundup #35
Further to Victor's link.
Arctic sea ice this year may challenge the 2012 record as far as area at minimum goes. It won't challenge the 2012 extent record, although it may come 2nd. The state of much of the ice pack up thre is very poor, with near record low concentrations over 1/2 the Arctic. And a lot of multi-years ice has been lost this year. Ice often flows down the east coast of Greenland, through Fram strait. This year not much. Not because the ice isn't moving there, it is, but the high North Atlantic is so warm this year the ice melts when it hits that region rather than being able to drift south. This has been clear on satellite images for a couple of months.
That said, there is still a lot of ice left, the situation is really only getting back to near the 2012 state after several colder years. With the likely state of the ice at the end of this melt season in about 3 weeks, the ice is quite possibly set up for bigger melt next year if the right weather conditions prevail. However, there is still a lot of ice to work through before the Arctic can become ice free, particularly completely ice free.
Most people use an operational definition of 'ice free' as below 1 million km2. Currently it is around 3.5 million km2 in area and 5 million km2 in extent.
Could several years of weather conducive to melt lead to reaching the 1 million threshold? Possibly. But if they are poorer weather years, it could expand again. The longer term trend seems clear but how far off is quite variable. 2 years, almost certainly not. 50 years, also almost certainly not. But whether operationally ice free is 5 years away or 15 is quite unclear. -
Tom Curtis at 12:14 PM on 29 August 20161934 - hottest year on record
DarkMath @48, if you don't like NOAA, you can always use the AGW denier funded Berkeley Earth Surface Temperature project results:

Technically, the BEST data series make no adjustments. Instead, when there is a known, or reasonably inferred change of equipment, location, or time of observations they treat the data as coming from two distinct stations - a proceedure which Anthony Watts endorsed as having his full confidence (until he saw the results). It is certainly a proceedure that has the full confidence of Judith Curry (denier enabler), Richard Muller (temperature series skeptic), Zeke Hausfather (luke warmer) and Steven Mosher (Luke Warmer), not to mention three independent scientists selected by at the time, climate skeptic Richard Muller.
For the record, the highest ranked running 12 month mean temperature in the 1930s according to BEST ranks 23rd. In contrast, eight of the 12 highest ranked 12 month running mean temperatures are in 2012, with another three in the last three months of 2011.
But you want to cherry pick just July temperatures. However, the highest ranked July temperature in the 1930s is 1936 (ranked 3rd) followed by 1934 (ranked 6th). In contrast, in the 21st century the highest ranked are 2012 (1st), 2006 (2nd), 2011 (4th), and 2002 (5th). The average July temperature across the 1930s was 0.66 C. Across the 21st century (to 2012) it was 0.85 C.
And if you are wondering, BEST uses approximately 8 times as many stations as does the USHCN, with an increasing number in time over the 20th and 21st century.
In short, your cherry pick of the cherry pick still does not give you the conclusion you desire.
Your only refuge is to insist that when a station changes its instrument entirely, or its time of day for observations, or is moved to a new location, it should be treated as the same station with no adjustments for differences in recorded temperature between the new and the old; and to take meaningless arithmetic means that do not care that the station density in New York is far higher than that in Nevada, thereby giving more importance to North Eastern state temperatures than to those in the mid-west or west:

Your bias in favour of rich, Democratic eastern states is noted.
-
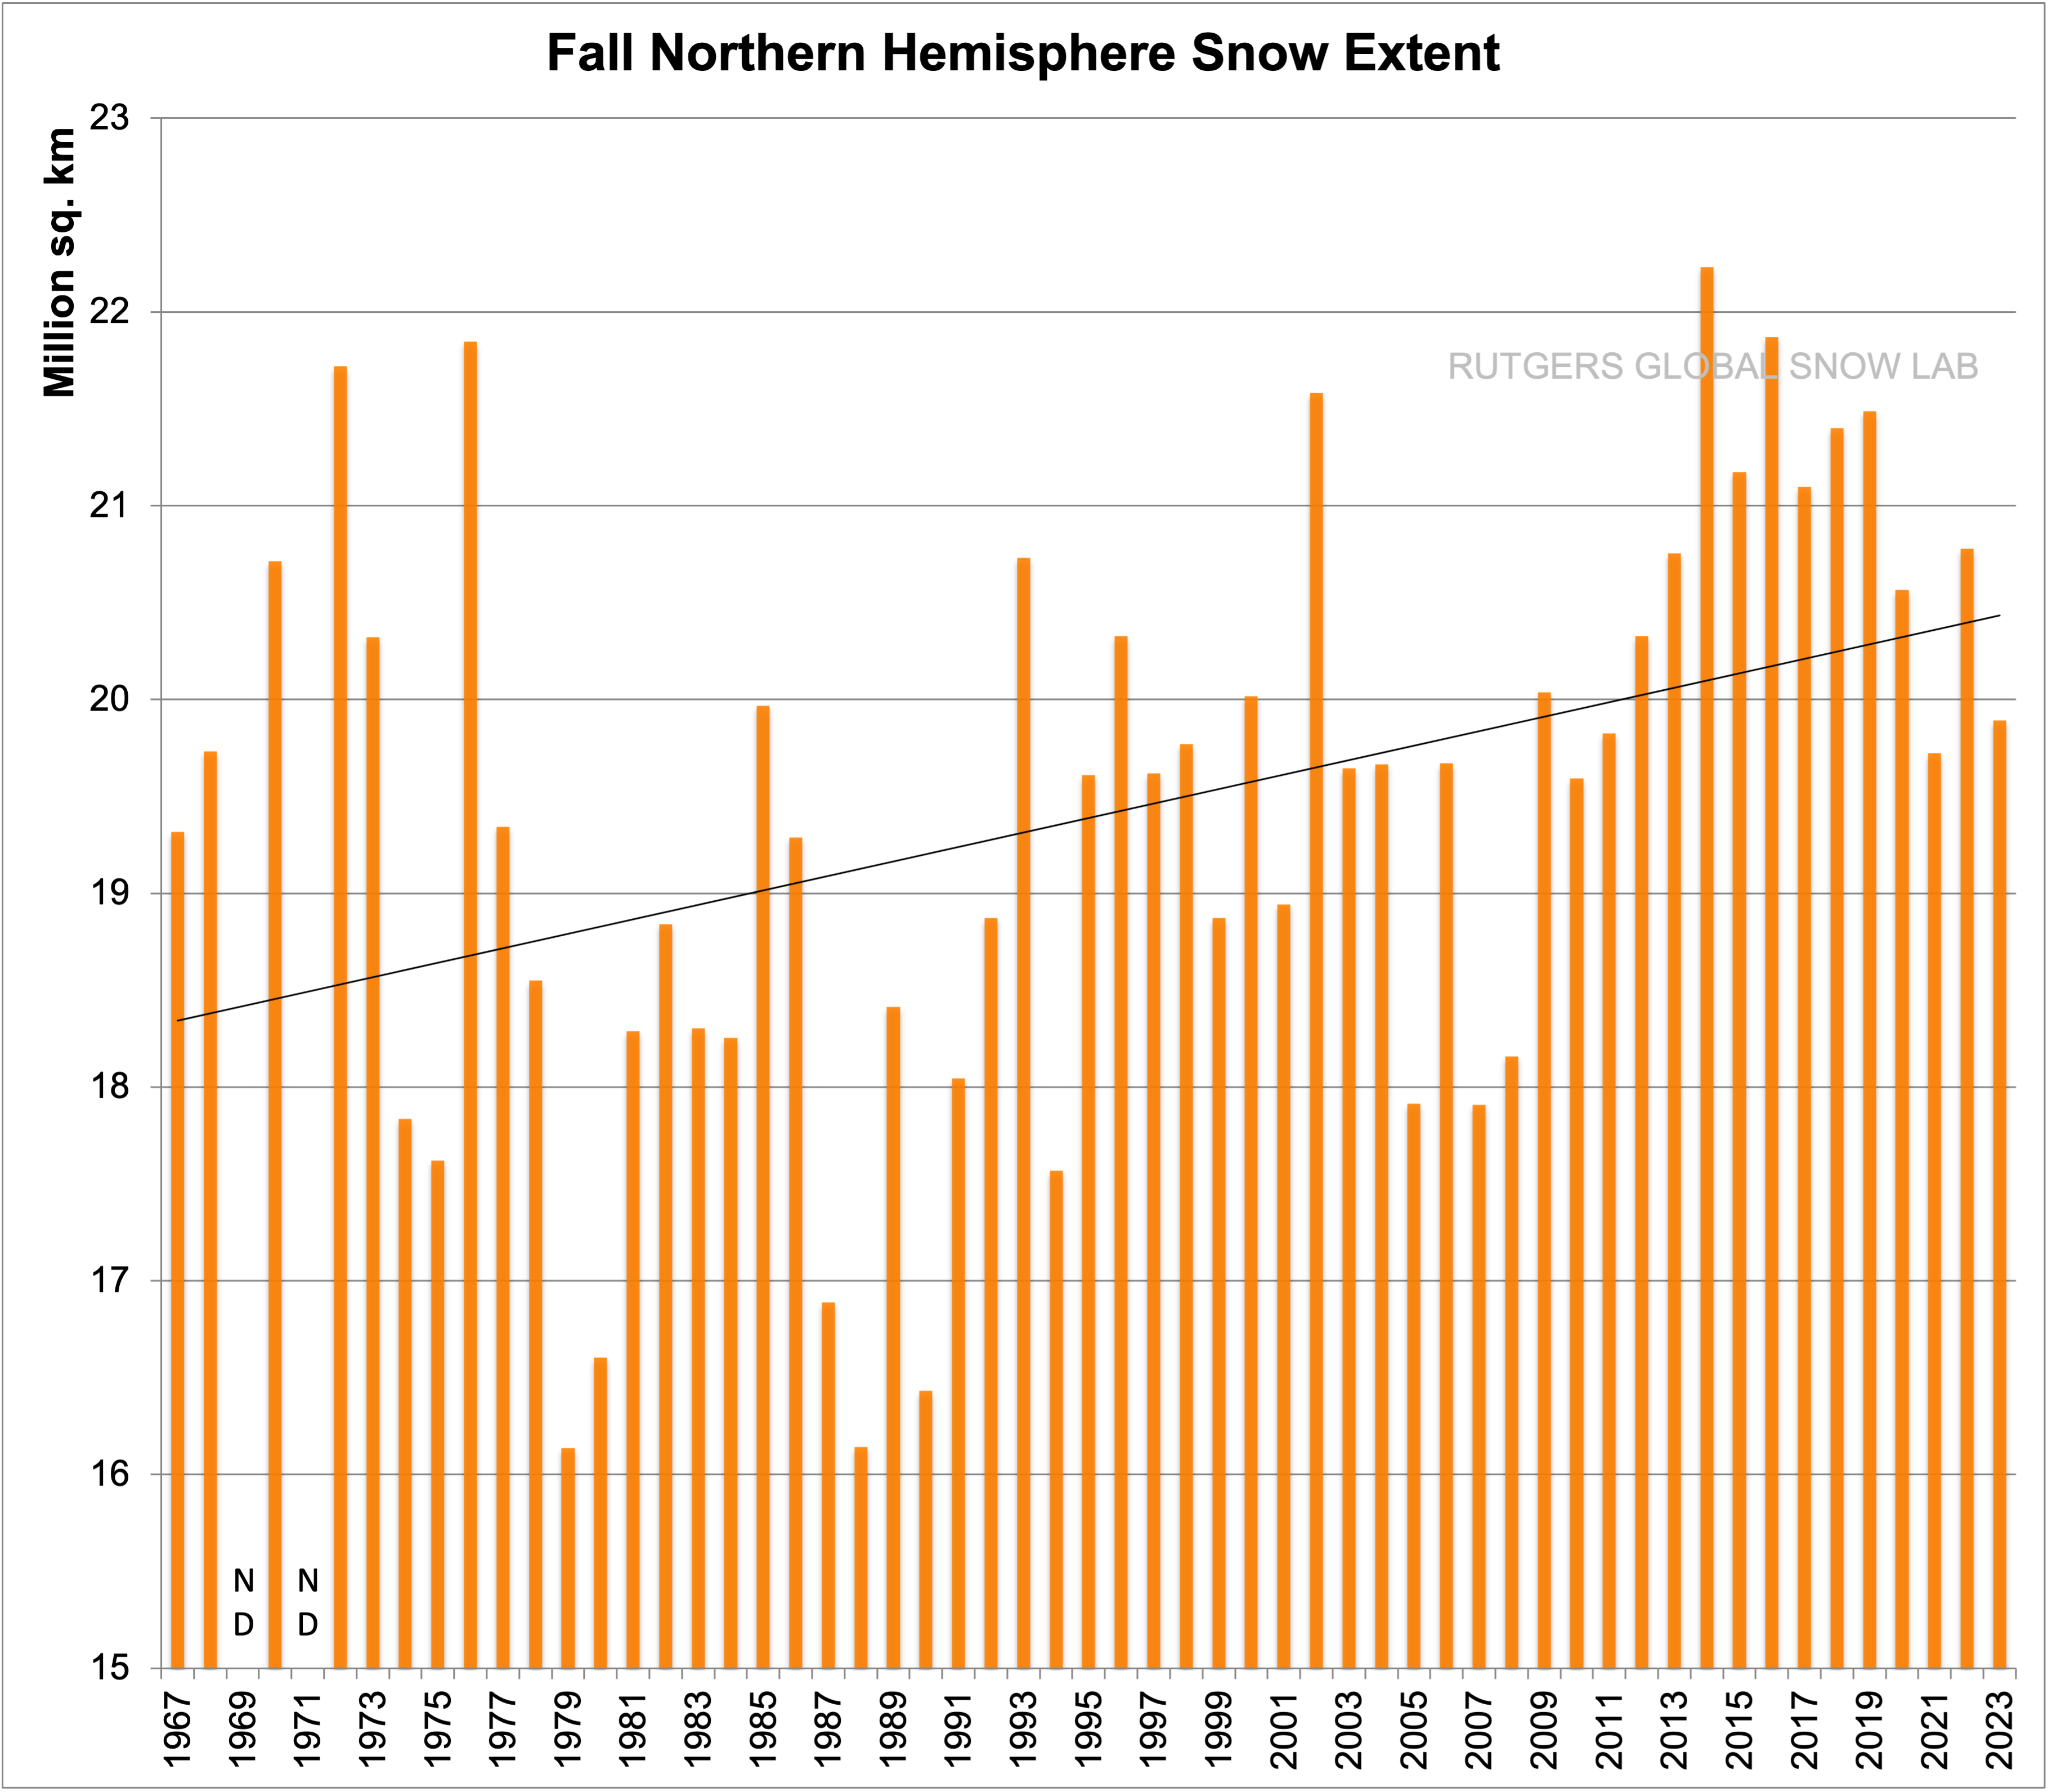
Glenn Tamblyn at 12:01 PM on 29 August 2016Historical documents reveal Arctic sea ice is disappearing at record speed
Curiouspa
Rutgers Snow lab also has data on NH snow cover.
Here is changes in Spring snow cover: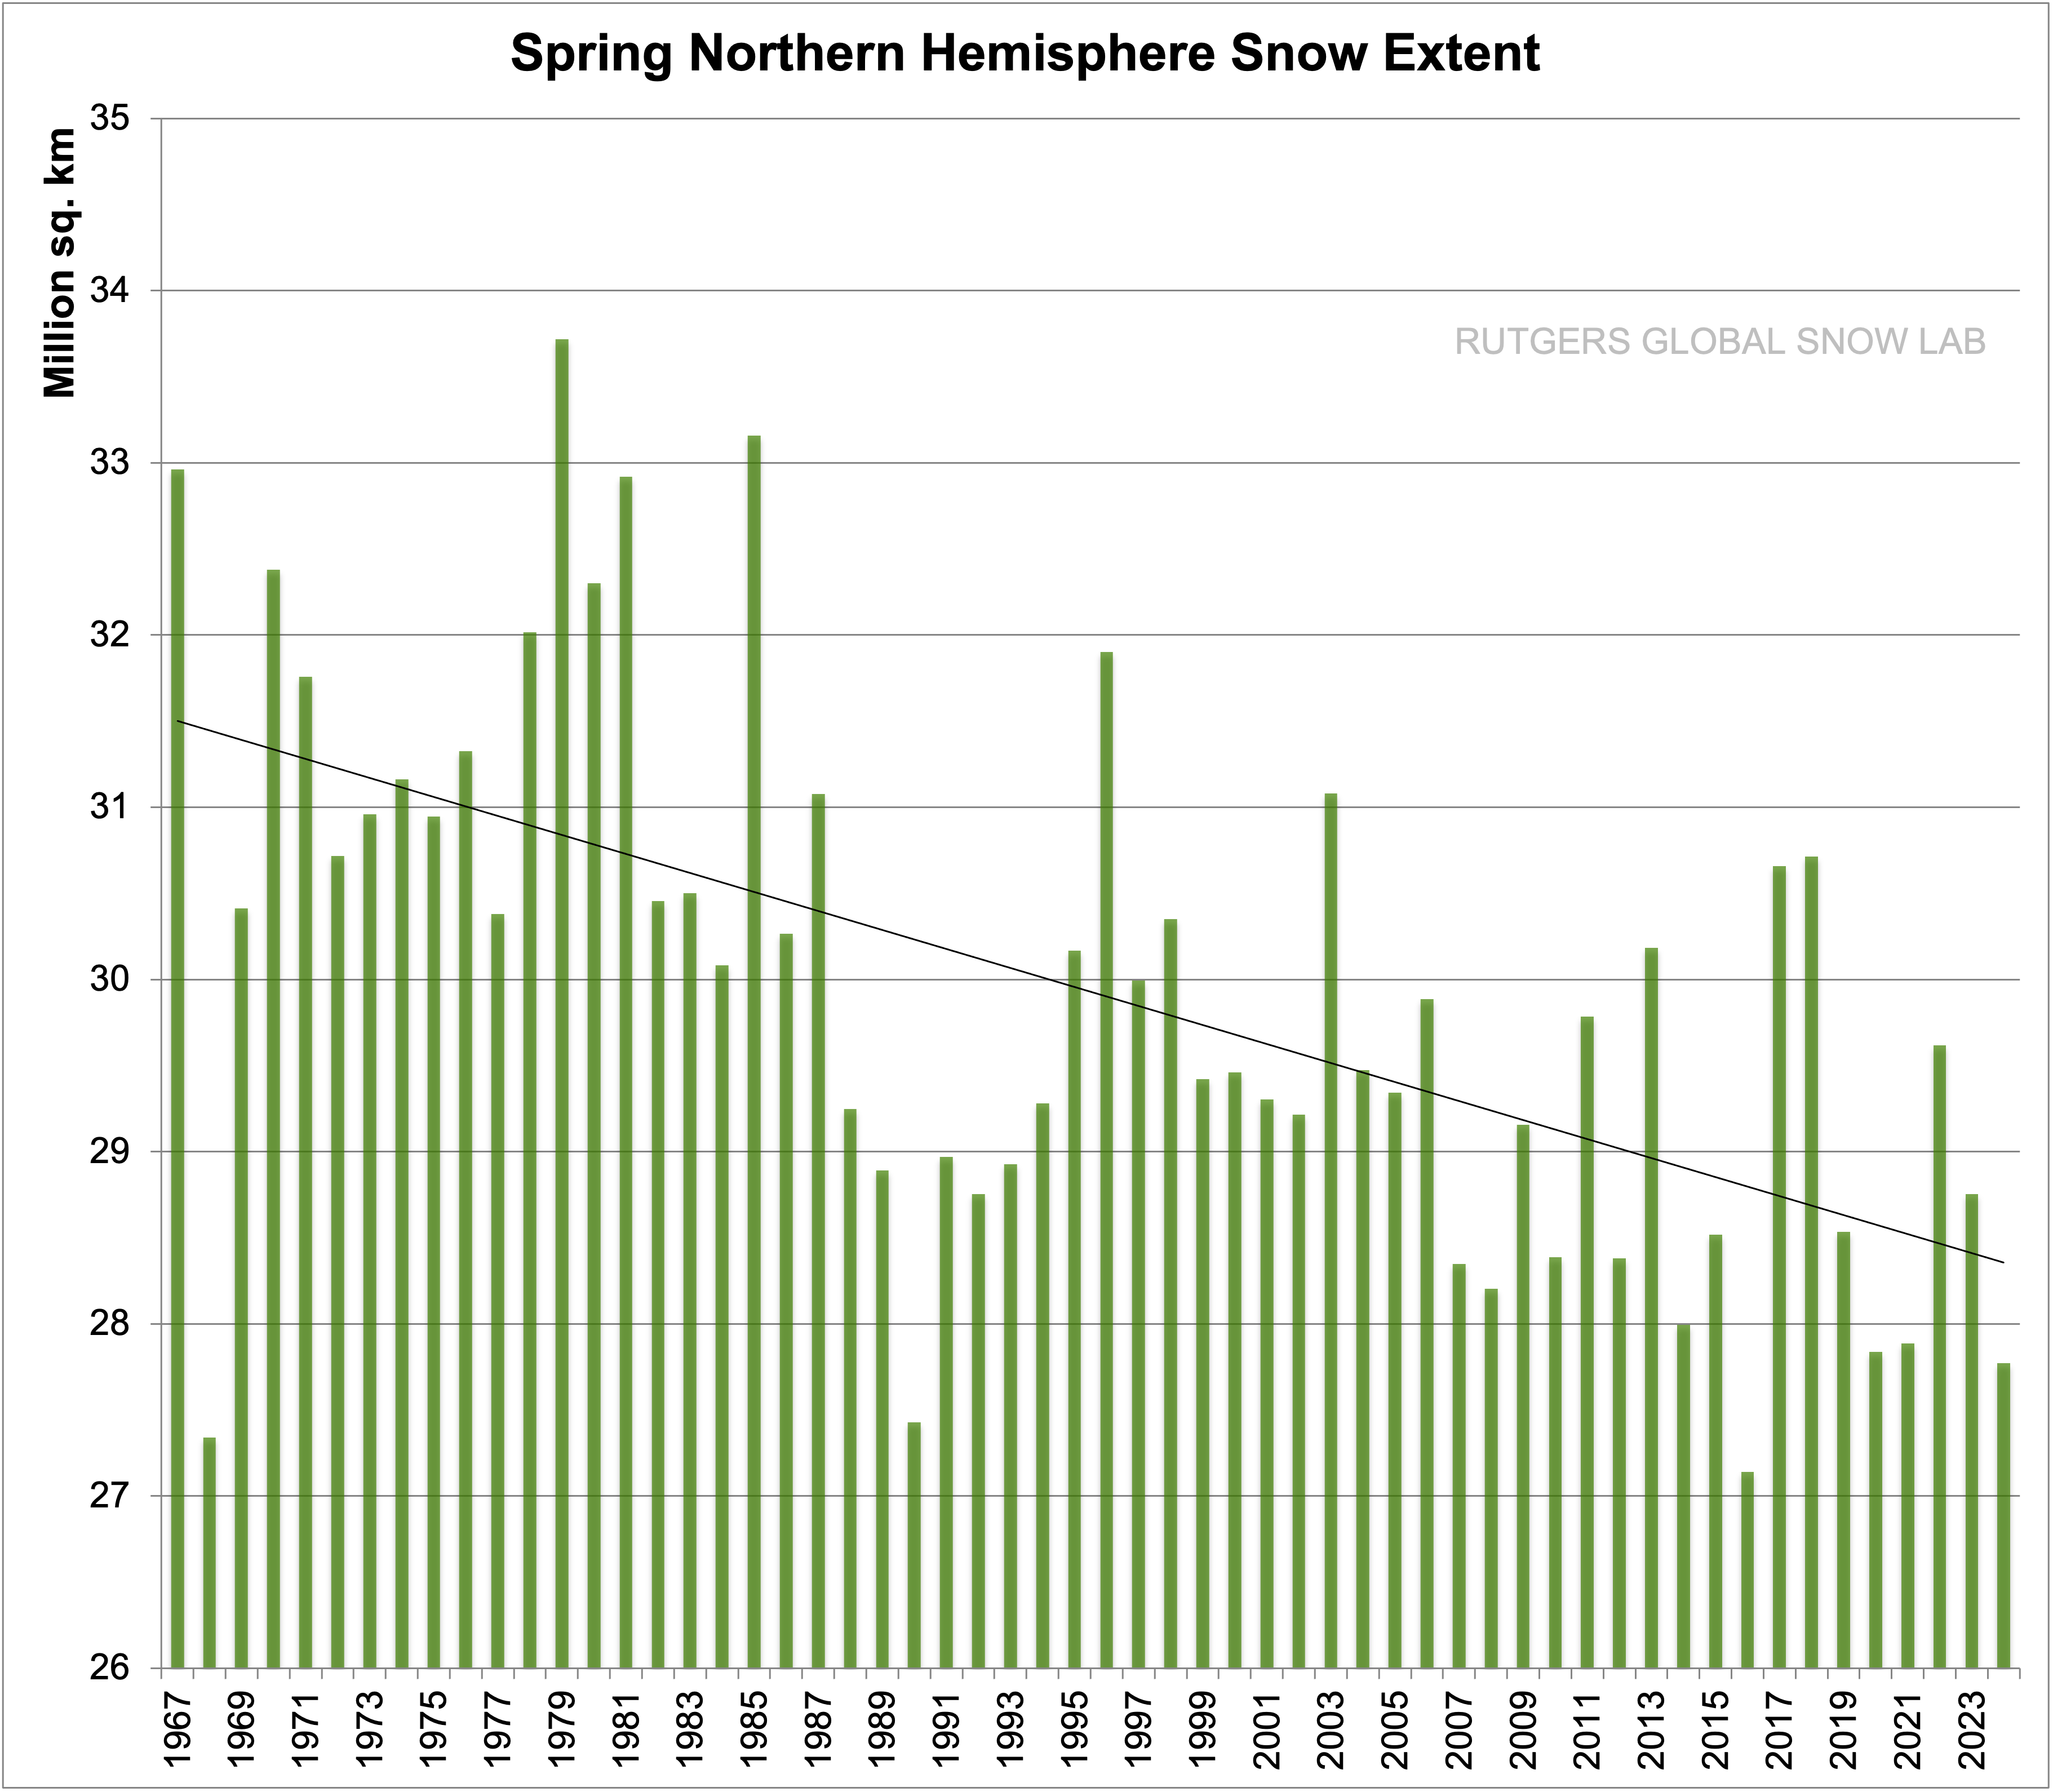
Winter:
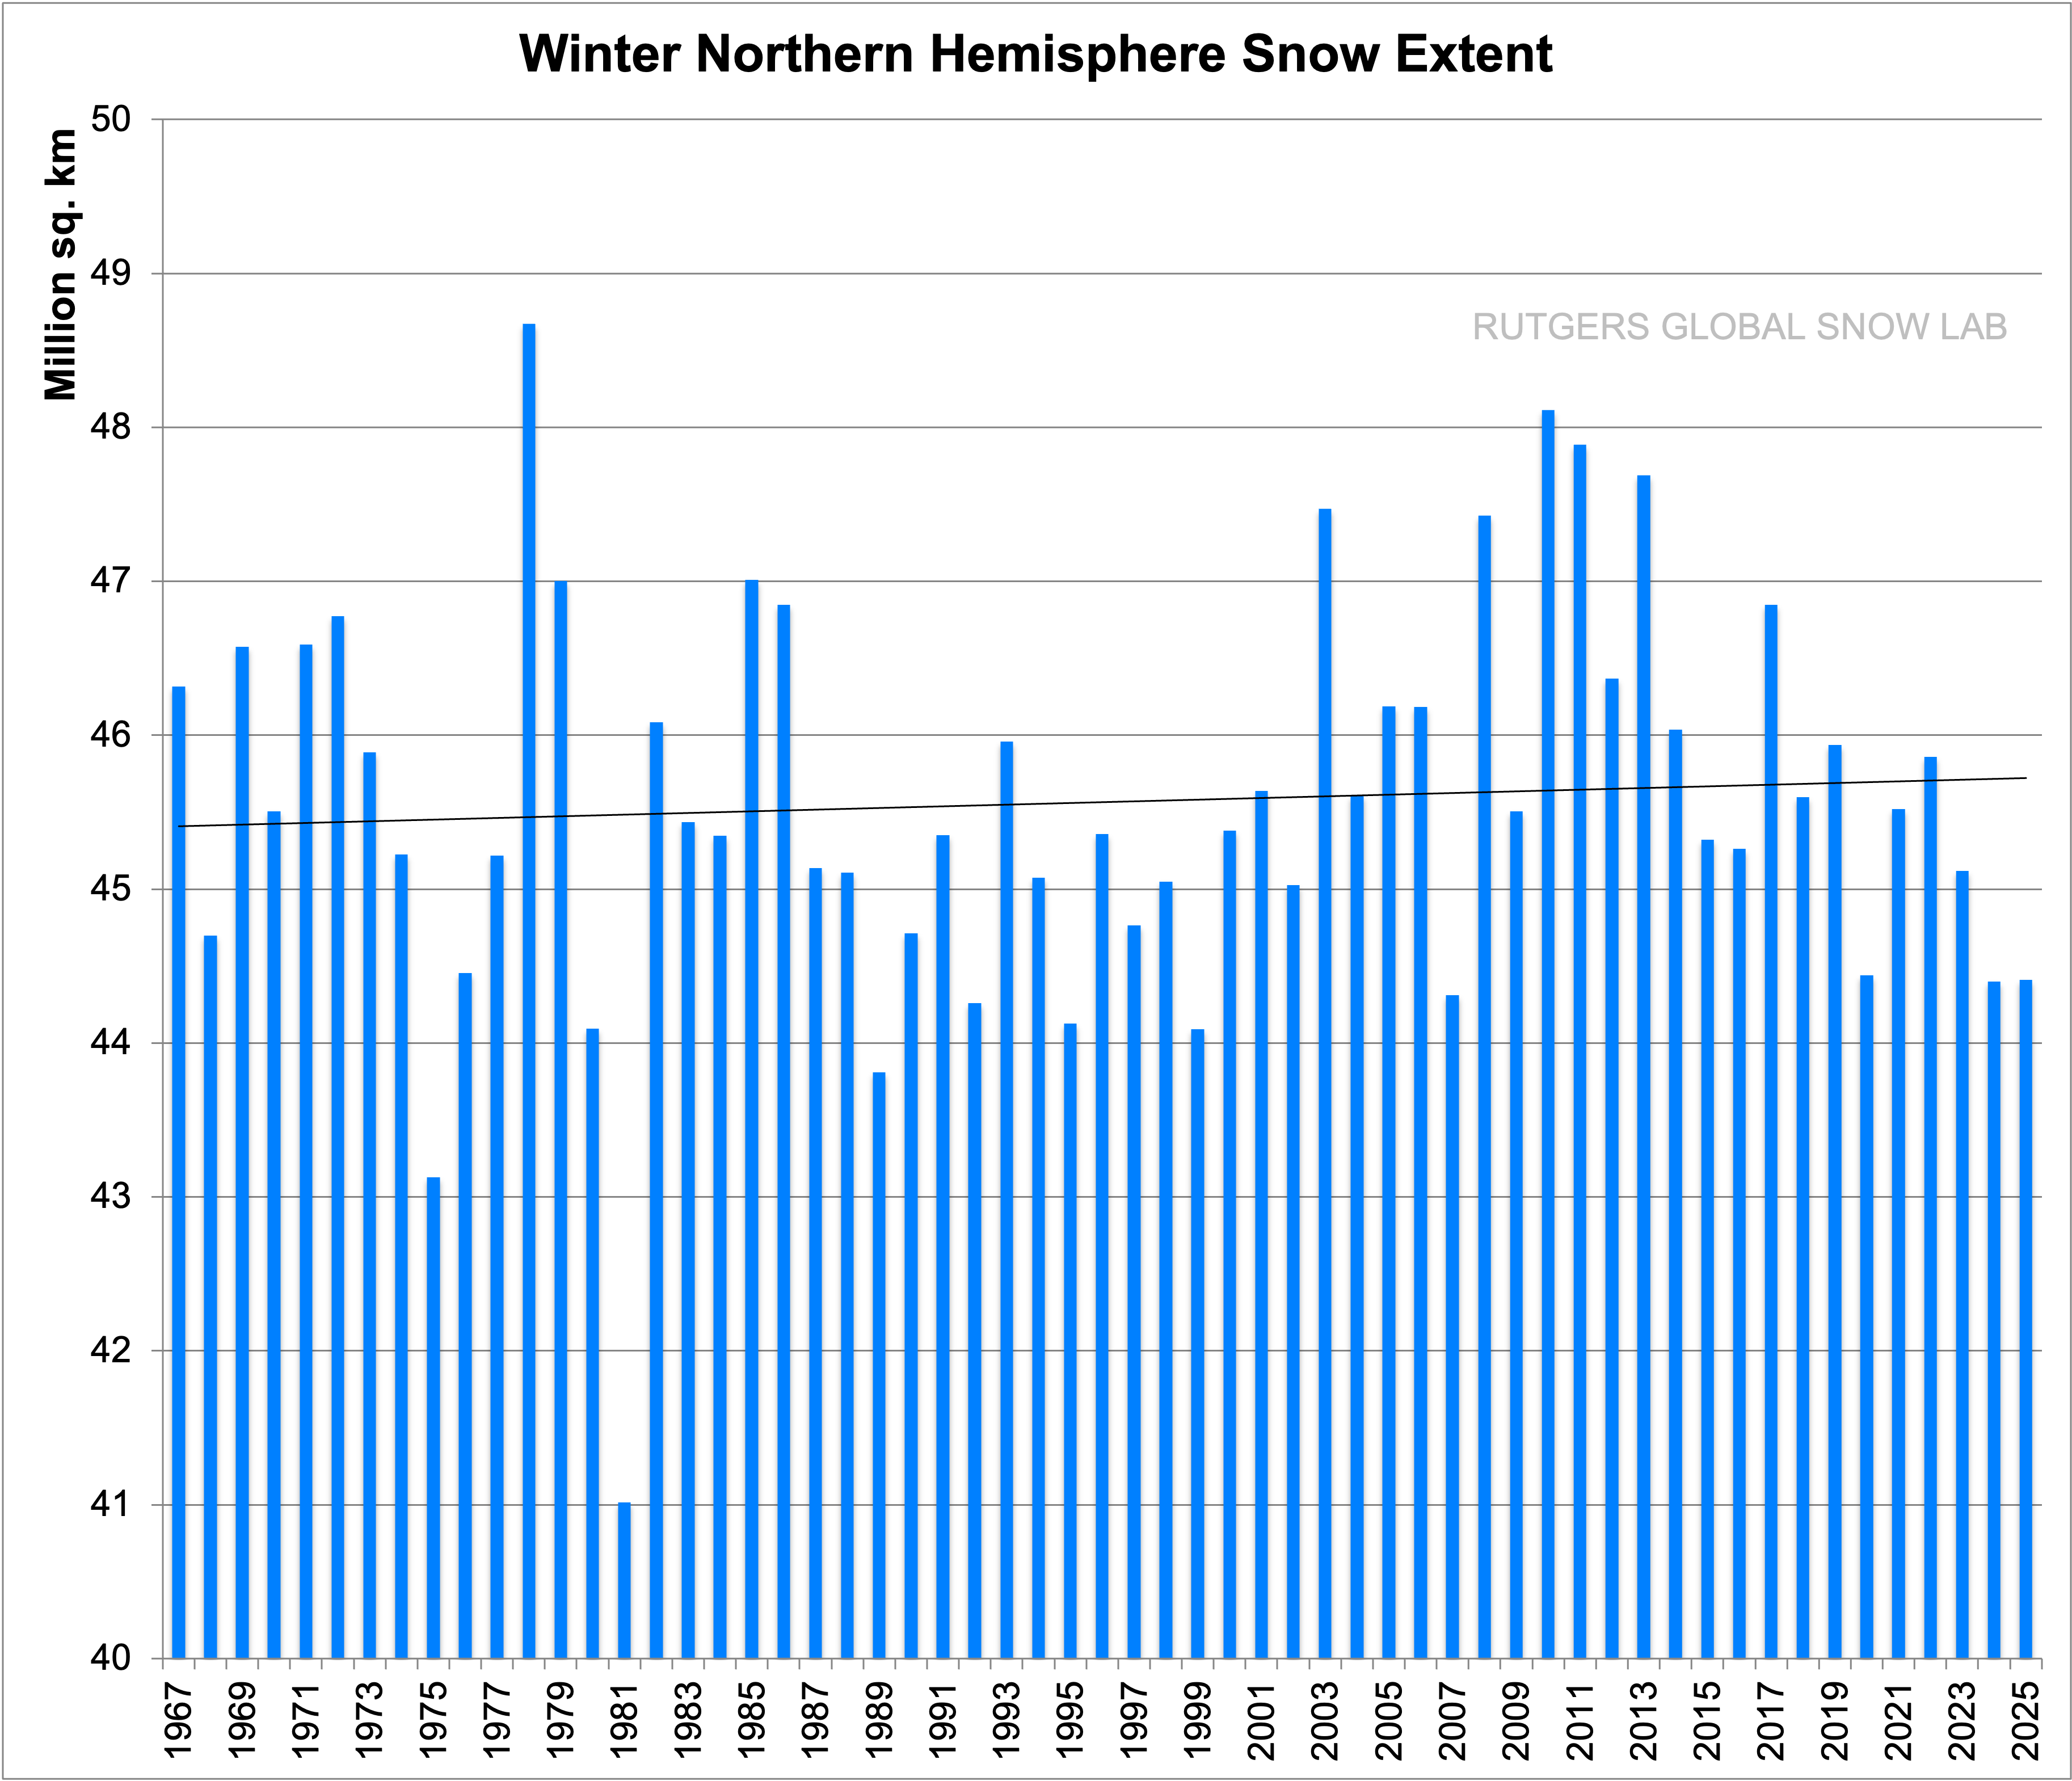
and Fall:
-
michael sweet at 09:53 AM on 29 August 20161934 - hottest year on record
Darkmath,
Did you really post an average temerature of the USA that simply averages all temperatures without adjusting for differrences in number of sites, location of sites or time of day of measurements? If you really think that is acceptable data you are welcome to think whatever you want. Real scientists don't agree and you will convince no-one here that you make sense.
Your suggestion that the world wide "climate model" has warming built into it is completely false (in addition to being sloganeering). The adjustments to the early ocean temperatures substaintially raise those temperatures so that the slope of the line is lowered. see this SkS article.

The denier websites you have frequented have mislead you. If scientists models currently raise temperatures why would they lower the slope with their early adjustments? Your argument is contradicted by the data.
-
scaddenp at 08:04 AM on 29 August 2016Global warming is melting the Greenland Ice Sheet, fast
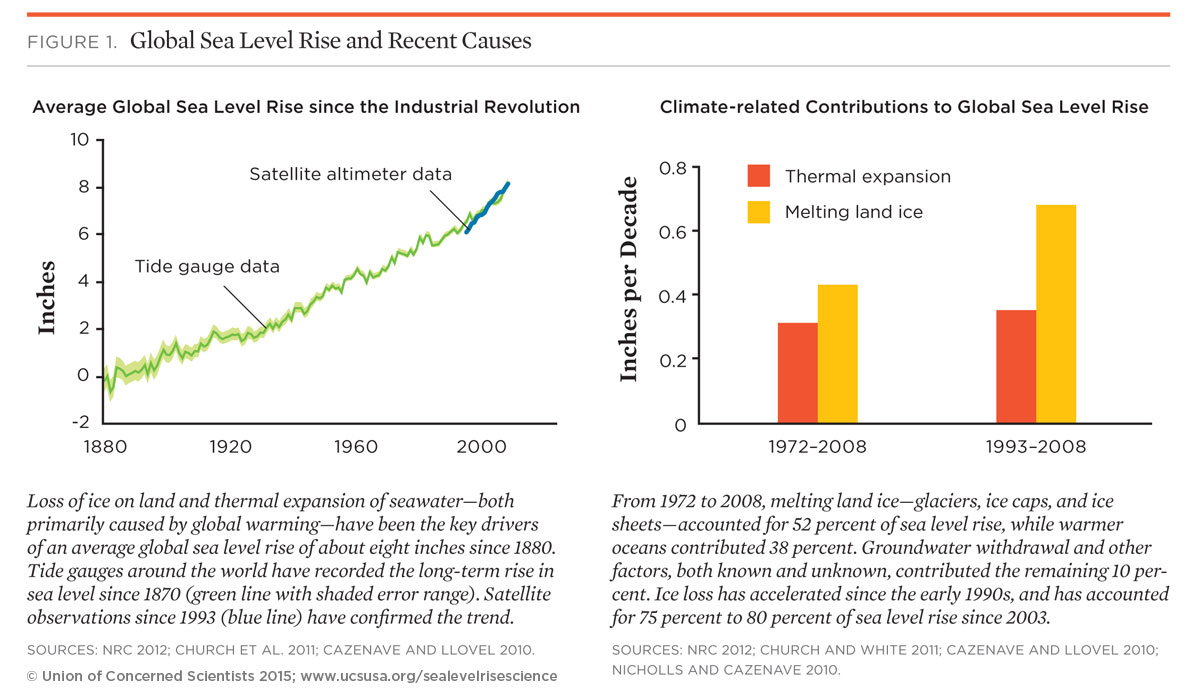
Good point GB. 1mm of sealevel rise is 362Gt of meltwater. Melting ice contributes 52% to sealevel rise in recent time (thermal expansion is the other big contributor at 38%).
-
Gingerbaker at 05:18 AM on 29 August 2016Global warming is melting the Greenland Ice Sheet, fast
"Fast"
Unfortunately, this article gives no perspective on relative spped of ice loss. 270 gigatons may well equal 110 million Olympic pools worth of water.
But this is meaningless without knowing how many gigatons remain, when they will be depleted, and how all this relates to world-wide sea level rise.
-
Jim Eager at 03:18 AM on 29 August 2016Historical documents reveal Arctic sea ice is disappearing at record speed
Curiouspa, I suggest you look at the plot more carefully. The March plot (maximum extent) is clearly changing (declining), though not nearly so sharply as the September plot (minimum exyent).
As to why Sptember is more critical than March, the September minimum extent comes after the summer period of maximum solar incidence, while the March maximum extent comes after total or near total darkness. Which do you think will have the greater impact on energy gain?
-
MA Rodger at 02:10 AM on 29 August 20161934 - hottest year on record
http://www.skepticalscience.com/comments_policy.shtmlDarkMath,
You may come to SkepticalScience and debate the science but be aware that if you are going to pronounce "But that's not science. ;-)" it is actually beholden on you to properly explain what the "that" is which you are asserting "is not science." Otherwise "That (ie your comment) is not (real) science." Do not be deceived by the names that deluded climate deniers like Steve Goddard/Tony Heller pick to name their websites.
Moderator Response:[JH] I have flagged the sentence you cite as sloganeering and have advised Dark Math to read and adhere to the SkS Comments Policy.
-
1934 - hottest year on record
DarkMath - "Of course you're going to see a warming trend of late if you base your temperature estimates on a climate model that has warming built into it." represents either an accusation that climate scientists are idiots, or is a conspiracy theory. Neither is justified.
As Tom pointed out, summer only temperatures, let alone a focus on only a few percent of the Earth's surface area, are significant cherry-picks, and those choices on your part don't support your argument. The climate is considerably warmer now than it was in the 1930s.
-
Joel_Huberman at 00:13 AM on 29 August 2016Report Shows Whopping $8.8 Trillion Climate Tab Being Left for Next Generation
I have a quibble with the headline--not only the headline of this article but those of most articles in the media about economic forecasts. Economic forecasts are always based on so many assumptions that they would, I suspect, make climate modelers shudder (at least climate models incorporate some solid physics and chemistry). Due to these assumptions, economic forecasts can never "show" anything. At best they can estimate. Changing the word "shows" in the title to "estimates" would be much more honest!
-
DarkMath at 23:48 PM on 28 August 20161934 - hottest year on record
Tom Curtis, you're referencing NASA/NOAA land temperature data that has been adjusted or even estimated in the case of weather stations that no longer exist.
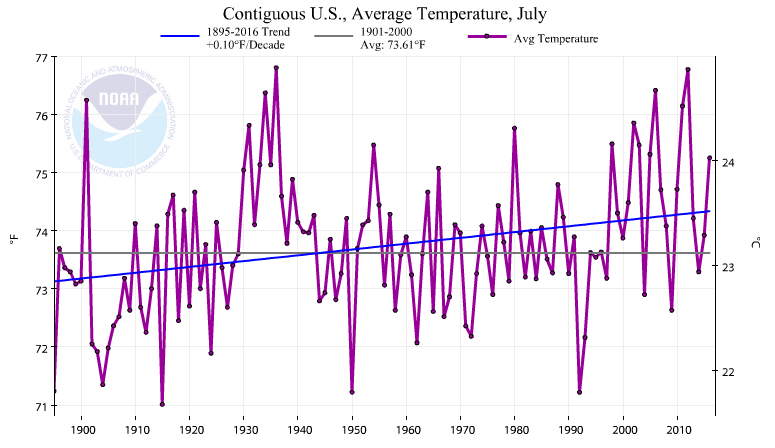
When you take out the adjustments and estimates 2012 is no longer the hotest July on record:
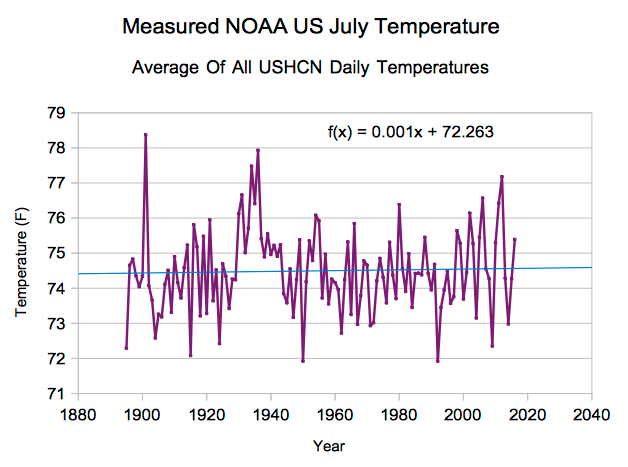
Of course you're going to see a warming trend of late if you base your temperature estimates on a climate model that has warming built into it.
But that's not science. ;-)
Moderator Response:[JH] The last two paragraphs constitute sloganeering which is prohibited by the SkS Comments Policy.
Please note that posting comments here at SkS is a privilege, not a right. This privilege can be rescinded if the posting individual treats adherence to the Comments Policy as optional, rather than the mandatory condition of participating in this online forum.
Please take the time to review the policy and ensure future comments are in full compliance with it. Thanks for your understanding and compliance in this matter.
[PS] This post also promulgates the idea that temperature record is adjusted for some nefarious purpose (effectively an accusation of fraud). If you think the record can be represented better, then please discuss here supporting your case with data and preferrably peer-reviewed publications but spare us the wild fantasies of Heller et al. If you honestly believe that you can usefully compare data from site before and after fitting say a Stevenson screen, without adjustment, then this is not the site for you.
-
curiouspa at 23:06 PM on 28 August 2016Historical documents reveal Arctic sea ice is disappearing at record speed
Thank you for the link, Bob. It seems the data is less for winter snow cover. But, there is at least one graph showing a downward trend.
-
Tom Curtis at 15:54 PM on 28 August 20161934 - hottest year on record
DarkMath @45, the highest values in the US Heatwave Index are found in (in decreasing order of intensity) 1936, 1934, 1931 and 1930, with the values of 1936 and 1934 in particular, being significantly greater than any other including recent years:

(Source)
Further, 1936 still holds the record for the percentage of area of the contiguous USA with an unusually hot summer, followed closely by 2012 and 1934:

(Source)
But a greater percentage of the contiguous USA had an unusually cold winter in 1936 than had an unusually warm summer. Indeed, 1936 recorded the second highest percentage of area with a cold winter in the contiguous USA on record:

(Source)
The combination of cold winters with hot summers resulted in 1936 only being the 49th warmest year, and 1934 (whose winters were warmer) being the 5th warmest year in the contiguous USA. In general, recent years have been significantly warmer than the 1930s:

(Source)
There is a reason for the combination of warm summers and cold winters in the 1930s:
"Poor land use practices and many years of intense drought contributed to these heat waves by depleting soil moisture and reducing the moderating effects of evaporation."
Low soil moisture also allows unusually cold nights and winters, which moderated mean temperatures in the 1930s back below typical 21st century temperatures in most years. In contrast, global warming warms nights faster (although the effect is slight) and winters faster than summer (which effect is not slight) so that modern US annually averaged temperatures are greater than those of the 1930s.
So, were the 1930s more uncomfortable to live in than the 21st century in the contiguous USA? Undoubtedly, the combination of drought, cold winters, hot summers and dust bowl made those years hellish - but the cause of the hot summers was also the cause of unusually cold winters. Are typical (record) annually averaged tempertures in the contiguous USA of the 21st century warmer than typical (record) years in the 1930s? Again, undoubtedly yes. Citing the the first fact does not change the second. Rather, it is a piece of misdirection. It is also a piece of misdirection in that the dust bowl and accompanying heat waves were largely anthropogenic (through poor farming practices). The 1930s contiguous USA is not an example of natural variability.
And all of this leaves untouched the fundamental point that concentrating on the contiguous USA rather than global temperatures is a cherry pick of mammoth proportions.
-
Tom Dayton at 11:50 AM on 28 August 20161934 - hottest year on record
DarkMath, why the heck is only the U.S. "the" issue? It's only 2% of the freakin' globe. But at least for the contiguous 48 states, you are incorrect anyway according to NOAA.
-
DarkMath at 11:20 AM on 28 August 20161934 - hottest year on record
The issue isn't how hot the U.S. was in the 1930s compared to other parts of the world. The issue is how hot U.S. temperatures NOW compared to the 1930s: https://www.youtube.com/watch?v=Gh-DNNIUjKU&feature=youtu.be&t=808
During the 1930’s, more than 70% of the US reached 100F every year, but now less than 30% of the US typically reaches 100F: http://realclimatescience.com/2016/07/record-breaking-heatwave-in-the-us/
-
VictorVenema at 07:01 AM on 28 August 20162016 SkS Weekly News Roundup #35
`Next year or the year after, the Arctic will be free of ice’ by Robin McKie, Observer/Guardian, Aug 21, 2016
FYI, climate scientists (Climate Feedback) judge the scientific credibility of this story to be low.
Moderator Response:[JH] Thank you Victor. Tomorrow, I will post a link to the Climate Feedback analysis on the SkS Facebook page.
Prev 478 479 480 481 482 483 484 485 486 487 488 489 490 491 492 493 Next


