


 Arguments


Recent Comments
Prev 501 502 503 504 505 506 507 508 509 510 511 512 513 514 515 516 Next
Comments 25401 to 25450:
-
davidsanger at 10:36 AM on 23 January 2016Thorough, not thoroughly fabricated: The truth about global temperature data
If you go to the doctor and he takes your temperature and it is 60°F you don't ask him to call the mortuary, you take another reading.
For a scientist to pretend that data readings are all correct, and to ignore known errors, would be dishonest - malpractice.
You make the observations and then you correct them as best you can.
-
gregcharles at 10:35 AM on 23 January 2016A striking resemblance between testimony for Peabody Coal and for Ted Cruz
Was Cruz definitely using the TMT channel in the chart presented at "Data or Dogma"? I know he had trouble figuring out where the chart came from, before finally finding that it was RSS, but I never heard clearly whether it was TLT or TMT.
-
One Planet Only Forever at 01:59 AM on 23 January 2016The Little Ape That Could
Glenn,
I appreciate the complexity of the issue and I really appreciate the time it takes to investigate, think about, develop and present an article like this.
Perhaps a simple statement could be added in this document mentioning that, unlike in the other species, there is a very broad range of individual magnitudes of impact among humans.
I believe that the different magnitudes of personal impact (not national or state/province per-capita levels) is a critical point to counter the misleading claims that the population number is the problem. The total number of people is only a concern. The combined total impact is the problem. Which makes the highest impacting individuals the real problem (and Global GDP has increased faster than population ... even Africa's GDP has risen faster than its population ... yet there are still many people who live incredibly brutal short lives ... the real concern)
And if a separate article is developed to more fully present the issue of the range of impact among humans, it could be mentioned that deliberate misleading marketing must be considered when attributing impact to an individual which would be presented in more detail in a separate item, if developed.
And that article about marketing can mention that Popularity and Profitability have fueled the increase of wealth and misleading marketing power of those who would willingly pursue unacceptable ways of benefiting any way they can get away with, distracting and distorting the results of the marketplace and democracy away from advancing humanity to a lasting better future for all, while creating unfustifiable impressions of advancement and superiority through the development of technological wonder toys for the wealthy and most fortunate that do not actually advance humanity. Those developments only create unsustainable impressions of advancement and superiority, while causing damage that no one who wants to enjoy benefiting from the activity and products wants to better understand the unacceptability of (especially not wanting to admit they do not deserve the perception of a Good Life that they were fortunate enough to get away with having developed).
This last point is the sad reality of places like Alberta where I live. Many people hate(not an overstatement of their attitude towards it) the idea of climate science and anyone who tries to promote better understanding of it because it really does mean they did not deserve the type of living and working that they developed through the past 30 years. They will "Believe anything that attacks or questions the better understanding they are actually able to understand".
-
Nick Palmer at 00:51 AM on 23 January 2016The Little Ape That Could
Hi Glenn. I wonder if you ever encountered my writings on the land surface available per person that you used? Some of your words "Not all that land is usable; some is ice caps, mountain ranges, deserts" seem similar to mine.
I've been banging away in comment sections with these calculations for decades to counter those who try to claim that earth wasn't overpopulated because they pointed out that the global population could fit on the Isle of White or Rhode island etc. I first did the "reverse calculation" in 1966 for a school essay... -
SirCharles at 23:48 PM on 22 January 2016The Little Ape That Could
The arrogance is in the word "believe". It's not belief what has brought us forward, it's observation, comparing evidence and research, it's science. And before we realised we are just changing the climate of our fragile planet we already knew that we could even destroy the whole lot with nuclear weapons...
Here half a minute of global warming jazz => https://www.youtube.com/watch?v=b3VVt76DeoQ
-
The Little Ape That Could
Mal Adapted #3:
The oxygen released by the cyanobacteria may also have destroyed almost all the methane in the atmosphere and as a result reduced the greenhouse effect enough to trigger the first and most severe episode of Snowball Earth.So, this is indeed the story of the little cyanobacterium that could!
-
mancan18 at 20:45 PM on 22 January 2016The Little Ape That Could
Excellent post Glenn. It summarises much of what I have been reading over recent years.
It clearly illustrates that we humans through our sheer numbers and our ingenuity are now a terra-forming species with a global impact. Also, we humans are even more unique than we already were. With our broad scientific understanding and the technological developments that are a result, and our unravelling of the human genome and the new genetic engineering techniques that are being developed, we now have the ability to determine our own evolution. Unfortunately, our political systems, our economic policies, and our societies have not evolved to the point where we are capable of dealing with all the problems that these latest developments are causing. This is because the thinking of some very influential and powerful people is, unfortunately, stuck in the past as if they were still living in the world of 50 or 100 years ago when there weren't so many people and there appeared to be plenty for all.
Rising greenhouse gases in our atmosphere, our eroding of our planet, our polluting of the atmosphere and the oceans, and the impact that we are having on global ecosystems, is very similar to a time when people living in cities and towns would simply throw their effluent and garbage into the street. Many people died of cholera and other nasty diseases as a result. The only difference today is that the throwing of our effluent and waste is having a global impact and unlike the conservatives of several hundred years ago, some conservatives today don't seem to want to build the sewers.
-
BilB at 18:20 PM on 22 January 2016A striking resemblance between testimony for Peabody Coal and for Ted Cruz
Oh, John, I feel your pain. To see Ted Cruz in action I fear for America. Curry, Happer and Christy were just plain embarrassing. Though I think Mayer, Schatz, Peters, Markin and Nelson deployed Titley powerfully and science shone over dogma.
I recently found (possibly through this site) James White's Colorado presentation to be a compelling expose of climate science clearly establishing the fundamental elements of climate change. White manages to sweep away the clutter of "complicated science" to reveal the undeniable basic principles.
https://www.youtube.com/watch?v=FmyBAUR7GZU
-
Glenn Tamblyn at 17:36 PM on 22 January 2016The Little Ape That Could
Mal Adapted.
Yeah this a point many people don't get. Particularly many geologists. Life has been an integral part of the chemistry and geology of the planet for most of it's history. It doesn't matter whether it is cyanobacteria or evolved austrolopithicenes, any species that grows numerous and or powerful can have surprising impacts.
HK, neat graph. Visualising this sort of stuff is tricky.
OPOF
This was a difficult choice, all the things I would or wouldn't include. The more one adds the more the risk that I dilute the key message; 'that reaction of incredulousness about our capacity is misplaced'. -
One Planet Only Forever at 14:43 PM on 22 January 2016The Little Ape That Could
Very thorough and interesting presentation.
However, the point about population could be improved by categorizing the current human population in ranges of magnitude of impact of the individual. Not all humans are equal in impact (unlike the members of the other species listed ... there are admittedly some ranges of impacts among some of the domesticated species, particularly higher impacts for the industrial pharmaceutical factory farmed ones, the cheaper and quicker to produce - more profitable and popular - ones).
If that was done it would probably show that the 200 to 300 million (the number of humans 2000 years ago) highest consuming and highest impacting people (including their share of the impact of activities they invest in to benefit financially from) are quite likely to be responsible for more than 90% of the unsustainable consumption and damaging impacts.
If evaluated rigorously and rationally, including almost entirely attributing the consumption and pollution of stuff 'that wealthy investors profit from convincing people to desire (like plastic micro-beads and throw-away plastic)' to those wealthy investors it is likely that significantly fewer than 100 million people could be identified as being 'quite likely to be responsible' for more than 99% of the identifiable and quantifiable total global unsustainable over-consumption and negative impacts.
A person tempted to buy into an appealing misleading sales pitch could be considered to be a hapless victim of fraud, not able to be deemed to be significantly responsible for the impacts of what they were tempted into desiring - addicts need to be helped to break free from their damaging addictions, not be blamed for becoming addicted. The Pushers need to be targeted.
The number of successful pushers of damaging unsustainable over-consumptive addictions is the actual “Population Problem”.
-
Tom Curtis at 12:24 PM on 22 January 2016Tracking the 2°C Limit - November 2015
As per the moderators suggestion, I have responded to angusmac across three posts elsewhere. I will make one point in response here, however, because it gets to the core of why angusmac raised HCO temperatures on this thread in the first place. To recap, angusmac argues that the MWP temperature should be used as the "preindustrial temperatures" for reasons sufficiently refuted above. His reason for doing so comes down to his opinion that, "...“1.669 °C” above the 1961-1990 mean [and MWP temperatures] ... does not sound nearly as bad as 2 °C". This in turn is related to his belief that "... many parts of the world exceeded the 2 °C limit [in the HCO] without any dangerous consequences and that these temperatures occurred when CO2 was at ≈ 280 ppm". The idea is that if 1.67 C above the 1961-1990 mean is not bad, then neither is 0.75 C (2015 average, HadCRUT4) and neither is 2 C above the preindustrial average. Ergo, rebaselining the 2 C guidline is justified to make that intuitively obvious.
Marcott 2013 allows us to see how flawed that intuition is.
Specifically, Marcott adds random variability to the stack of reconstructions used in the paper to make the annual scale variability of the reconstructions match actual annual scale variability. The result is an increase of 0.13 C to the standard error. It follows, that if we add 0.13 C to the standard deviation of the mean of the stack for each 20 year period in the full reconstruction, we get a good approximate measure of the potential range of annual temperatures for that 20 year period. Note that due to autocorrelation, if temperatures are low for a given year in a 20 year period (or century), in a specific member of the stack, they will not be high within that 20 year period (or with slight qualification, within that century). But because we do not know which member of the stack most closely approximate reality, the statistical data form all stacks gives us our best approximation of the temperature range. From that in turn we can calculate an approximate probability of a particular temperature in any given year:

The chart shows the probability of a given temperature (specified by year) in any given year over the Holocene. The green line shows the probabilty of 1.5 C over the 1961-1990 mean. It is consistently zero. Even 2015 tempertures are shown to be relatively rare in the HCO, though 2000-2009 temperatures were commonplace.
More interestingly, we can calculate the probability of those temperatures being reached at least once, in any year over a given period. For the period 5500-9500 BP, it is a near certainty that even 2015 temperataures will have been reached at least once. There is, however, only a 2% chance that temperatures reached 1.5 C above the 1961-1990 at any time in the HCO. The chance that it reached 2 C above preindustrial for even a single year is negligible.
It can therefore be seen that angusmac's assumption that high temperatures were commonplace in the HCO is simply false. We are very nearly at the upper limit of HCO temperatures. Nor is his assumption that HCO temperatures were always beneficial justified. Indeed, given that almost all agriculture was invented between 30 degrees North and 30 degrees South (and all was invented between 40 north and 30 south), and given that temperatures in that latitude zone have actually increased since the HCO, his assumption of beneficial effect is very shaky indeed.
Finally, for completeness, the probability of 1990-2009 twenty year average temperatures of the 950-1900 preindustrial baseline is 0.6%. The probability of 1996-2015 twenty year average temperatures of the 950-1900 baseline is just 0.03%. So much for natural variability being the cause.
-
Tom Curtis at 11:33 AM on 22 January 2016Real Skepticism About the New Marcott 'Hockey Stick'
This is my final response on this page to angusmac's comment here. In that comment, in addition to the three points addressed above he draws attention to the fact that the 19th and 20th century spike in the Marcott standard mean of reconstructions is not robust (something pointed out by Marcott et al in the original paper). He reinforces the argument by comparing the final stages of Figure S3 to the equivalent Figure C8 from Marcott's thesis:
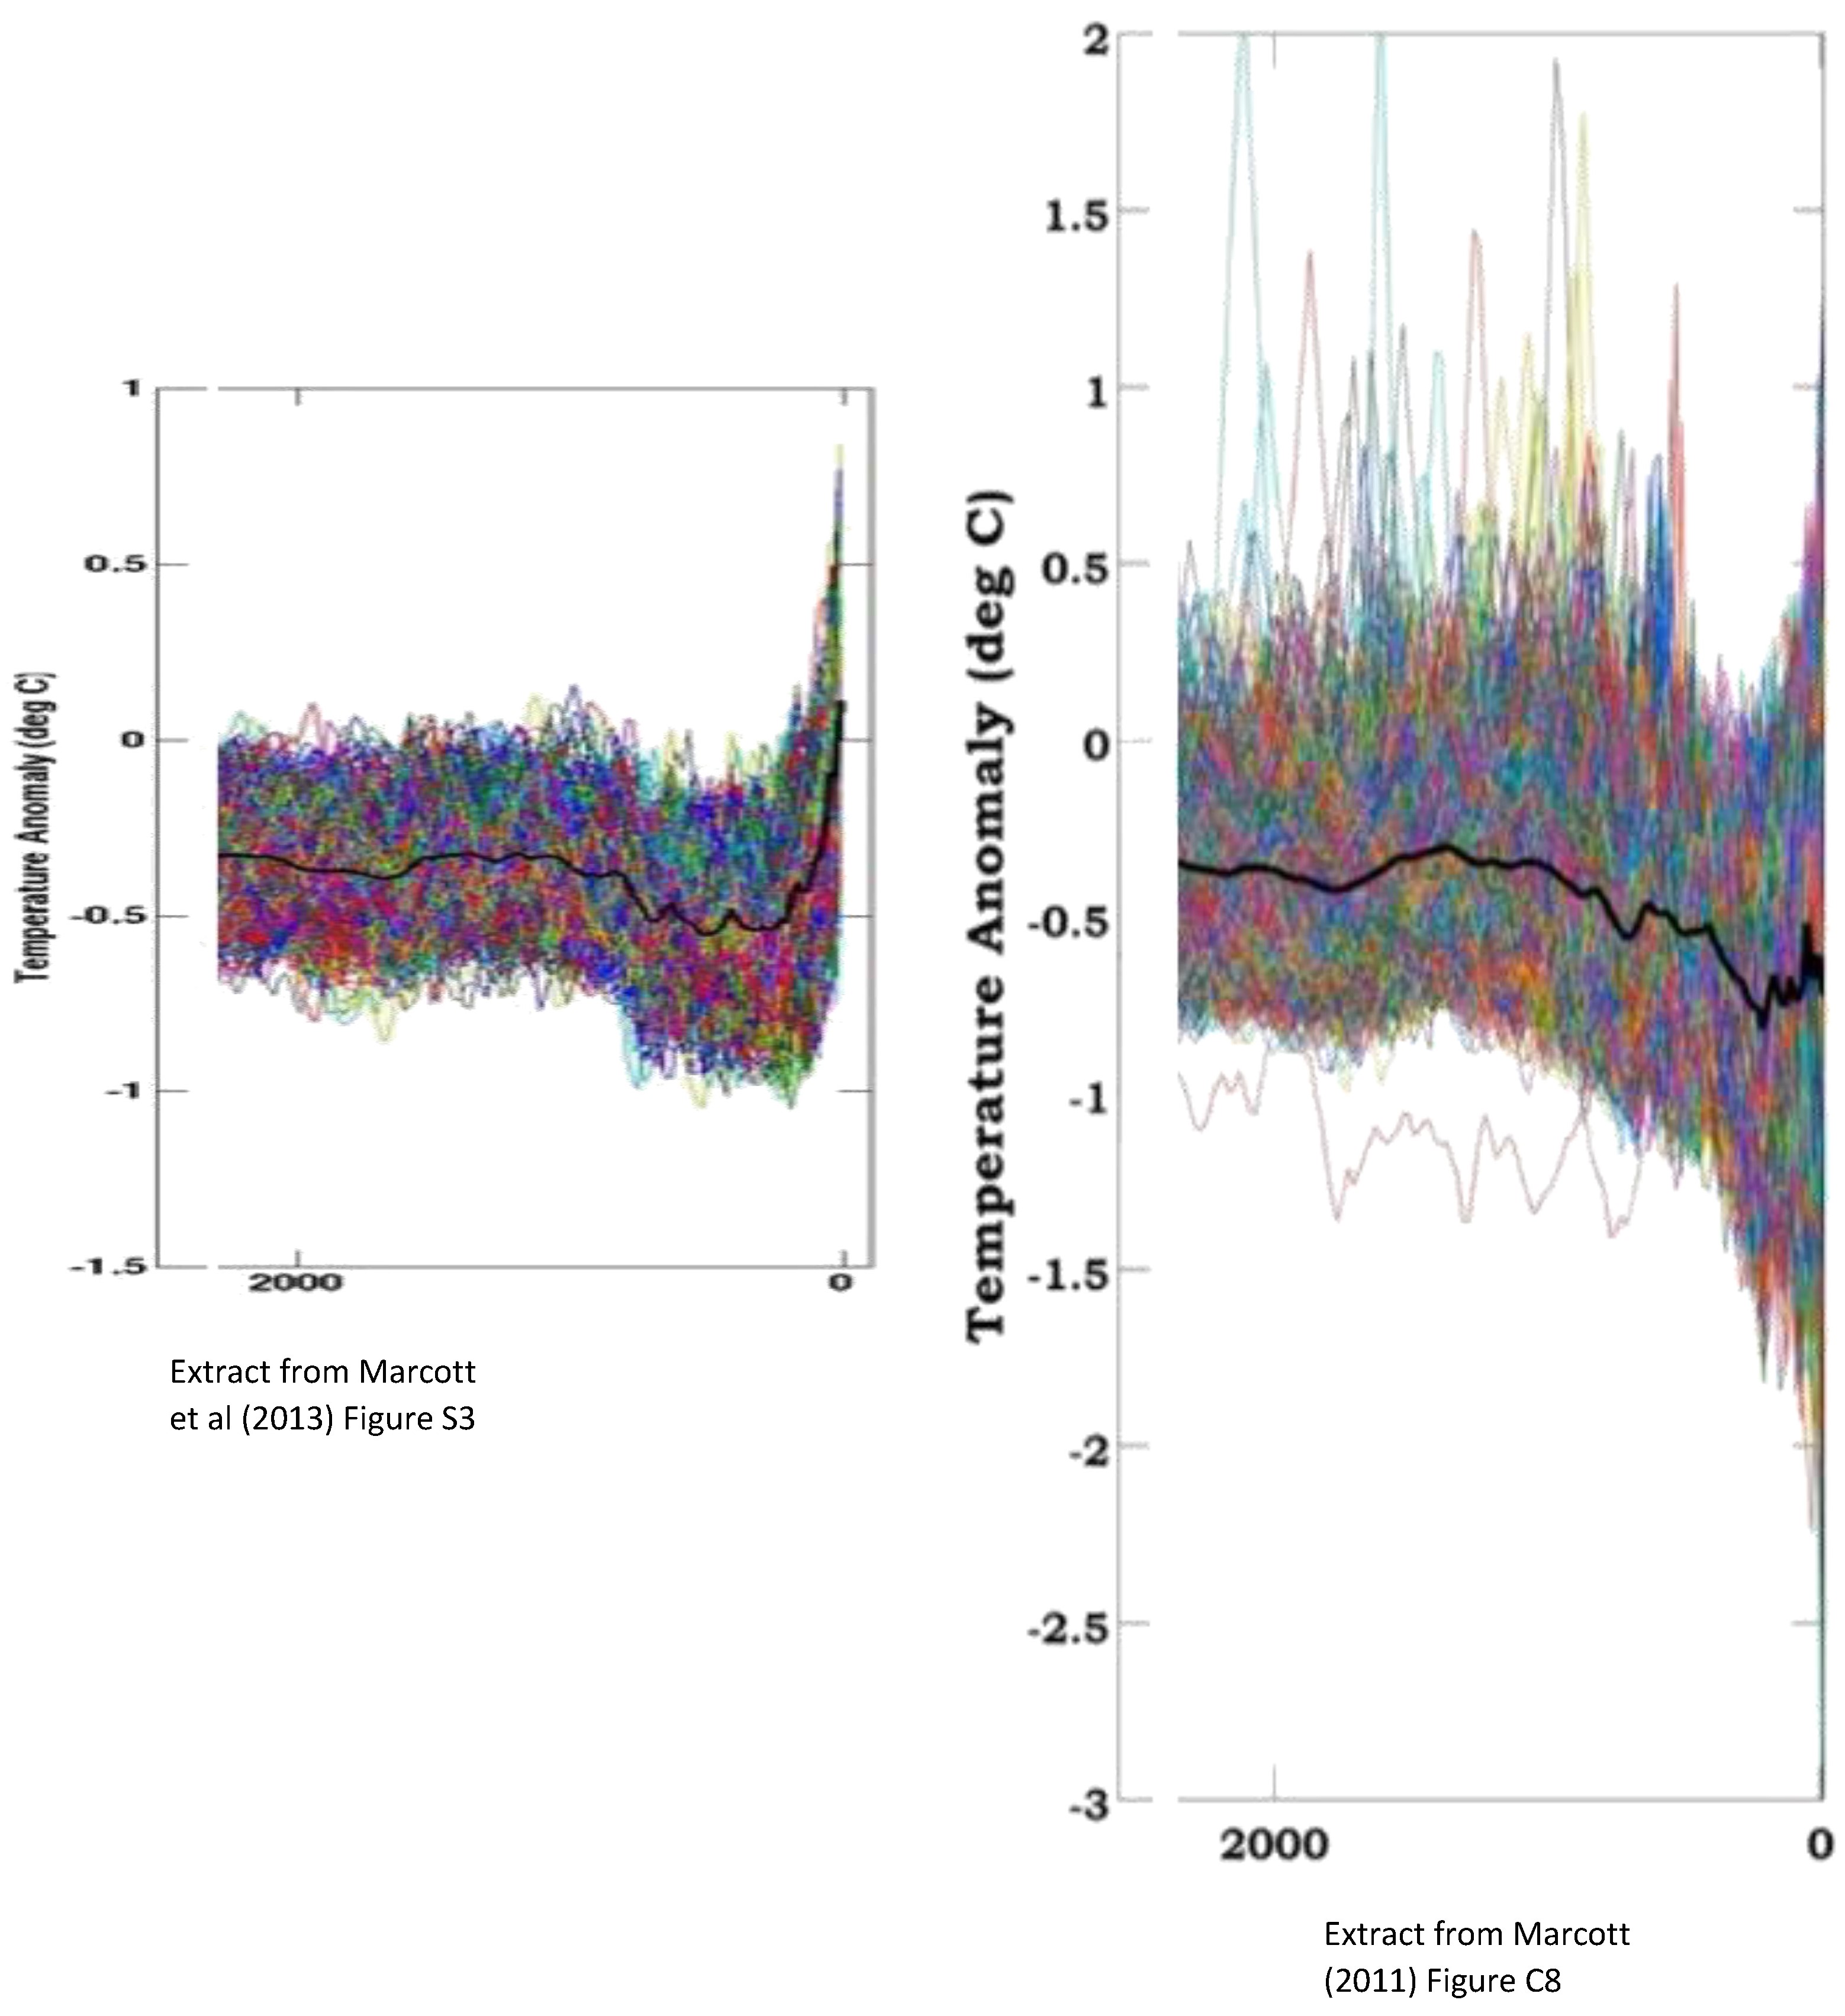
He writes:
"A difference of approximately 0.8 °C in the two versions of the reconstruction is presented in Figure 1 – yet they use the same proxies. Marcott et al do not address this significant difference by their “not robust” statement.
...
In light of the above discrepancies in Marcott et al (2013), I would not recommend it as a reasonable paleo reconstruction."
In the elided section, he adds the further, hypocritical criticism that Marcott's response to blog criticisms on a blog rather than formally through an corrigendum or explanandum published in the journal "...casts doubt on the robustness of the last 500 years of the reconstruction and perhaps even the entire paper". The double standard in not assuming that the failure of critics to formally publish their criticisms "casts doubt on the robustness" of those criticisms is breath taking. I will treat that "argument" with the contempt it disserves, and give it no further dicussion.
With regard to robustness, Tamino explained it first and best. It is entirely an artifact of the method of taking a simple average combined with the drop out of proxies towards the end of the record. Using other methods such as the method of difference (see Tamino's post), or the RegEM method used as an alternative method in Marcott et al, results in a much smaller, but robuts uptick occuring in the 20th century only:
Comparison of simple averages to the method of difference (or the RegEm method) shows the problem has little effect anywhere else in the reconstruction, and a scarcely discernible effect in the crucial years of the Holocene Climactic Optimum:

Given that angusmac is familiar with Marcott's Q&A at Realclimate, and even with Marcott's thesis, he must be familiar with this explanation of the problem, and ergo that it makes no relevant difference to the reconstruction in the HCO. Given that, I am surprised (to say the least) that he should raise this issue.
This, of course, does not explain the difference in the terminal section of the stacks generated for the paper (S3) and the thesis (C8). What angusmac does not show is the difference between Figure C8 and Figure C9 of the thesis:


As can be seen, calibration issues in just one proxy were able to make a significant difference to the robustness of the reconstructions through the HCO. Those issues were resolved in the paper, and the proxy consequently is used in the paper without problems. While that proxy (ODP 984) terminates around 1400 AD, and therefore does not contribute to the lack of robustness of the terminal period, it is likely that similar improvements in calibration and/or terminal dates explains the difference between C9 of the thesis and S3 of the paper with regard to the final two centuries.
Comparison of C9 and S3 shows the problem to only relate to the final two centuries which are not the point of the reconstruction, and which are not used to calibrate reconstruction temperatures to modern temperatures (which is done indirectly via the Mann 2008 reconstruction of temperatures over the last 2000 years). From this it follows that there is no basis in this data to doubt the HCO reconstruction from Marcott et al.
Nor is any substantive reason advanced to show the changes in data handling with regard to calibration and possibly terminal dates between the two does not represent an improvement. As it makes no difference to the substance of the reconstruction that is sufficient answer IMO. If it does not satisfy angusmac, he can do the necessary leg work by enquiring of Marcott re all the precise differences between thesis and paper among which the full explanation must be found.
-
adrian smits at 11:28 AM on 22 January 2016The Little Ape That Could
I find it interesting that you were born in 1957. The radiosondes developed the worldwide network in 1958. Since that year, they show .16 degree of warming in total. When you were talking about measurement I thought that might be an interesting factoid.
Moderator Response:[PS] Sloganeering and dangerously close to offtopic. Care to explain why you think that "factoid" is interesting? Actually, do so on an appropriate topic (such as here - where RATPAC graph does not appear to support your assertion)
-
Tom Curtis at 10:08 AM on 22 January 2016Real Skepticism About the New Marcott 'Hockey Stick'
Continuing my discussion of Angusmac's comment here:
Point (3) clearly misunderstands the nature of the Marcott reconstructions. (The misunderstanding is quite common among people who discuss climate science on the internet.) Specifically, while the mean of the stack of reconstructions has a resolution of approximately 300 years, the reconstructions themselves (as shown in figure S3, see Comment 101 above) have a resolution of 20 years. They are therefore quite appropriately compared to decadal temperatures. Further, in generating Figure 3 (see comment 101 above), which is the crux of Marcott et al, Marcott et al added noise to the reconstructions so that their variability matched the annually resolved Mann 2008 reconstruction. The statistical distribution is, therefore, quite appropriately compared to annual temperatures.
Given this, it is reasonable to criticize graphs that show only the stack mean vs modern temperatures. The falsely give the impression that we are experiencing temperatures never experienced before since the invention of agriculture. Rather, modern twenty year averages should be compared to the individual reconstructions in the stack, like this:

As you can see, even the 1996-2015 average was probably experience many times (if briefly) in the Holocene, but we are pushing towards the upper temperature limit of the Holocene. More significantly, the rate of increase of temperature over the last century is certainly in the highest 5% of holocene temperature trends, and may well be unprecedented. It is also ongoing.
More later.
-
The Little Ape That Could
Glenn:
Your article inspired me to create this pie chart of the Earth’s land mammals based on a comment by Andy Skuce in December.
If I counted all the squares correctly, wild land mammals represent less than 3% of the total mammalian biomass on land today. And that isn’t the whole story, as many of the remaining populations of wild land mammals are also harvested by us. For instance, humans are the most common predator of the moose in Norway (about 36,000 shot every year), so even the tiny, green part of the pie chart is largely controlled by humans.
-
Mal Adapted at 07:55 AM on 22 January 2016The Little Ape That Could
Up until about 2.5 billion years ago, there was no free oxygen on Earth, either in the oceans or the atmosphere. All life was anaerobic. Then cyanobacteria evolved. Cyanobacteria, formerly call blue-green algae, photosynthesize by using hydrogen atoms from water molecules to reduce CO2, releasing molecular oxygen (O2) as a "waste" product.
For millions of years, the newly-released molecular oxygen immediately combined with reducing substances in the oceans, but eventually those were used up, and free oxygen began to accumulate.
Free oxygen was toxic to the anaerobic life dominant at the time. A mass extinction ensued, and the only survivors were those that could protect themselves from the corrosive effects of O2. Eventually aerobic metabolism evolved. Aerobic metablism uses molecular oxygen to convert much more of the chemical energy in organic compounds to energy. Life again spread to occupy the globe.
This is the story of the little cyanobacterium that could.
-
John Hartz at 05:34 AM on 22 January 2016Ted Cruz fact check: which temperature data are the best?
Recommended supplementary reading:
Thorough, not thoroughly fabricated: The truth about global temperature data by Scott K Johnson, Ars Technica, Jan 21, 2016
-
John Hartz at 05:30 AM on 22 January 2016The Little Ape That Could
Glenn: If you expand this excellent article in the future, you may want to add a new section on the amount of manmade plastics that has been created by humans and released into our biosphere. For example...
By the Year 2050, There Will Be More Plastic Garbage in the Ocean Than Fish by Tom McKay, Science.Mic, Jan 19, 2016
-
Cooper13 at 03:54 AM on 22 January 2016The Little Ape That Could
Some fantastic perspective here on our overall impact/footprint on the planet. Thanks for posting this.
-
Glenn Tamblyn at 16:51 PM on 21 January 2016It warmed before 1940 when CO2 was low
tcflood
These graphs, also from GISS, show different regions - Norther exa-tropics, tropics and southern exa-tropics. Quite different pictures.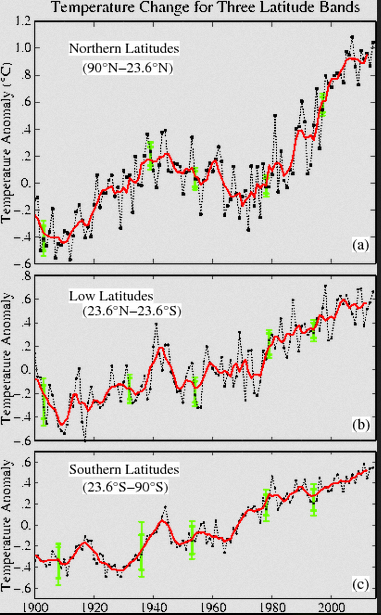
Also this paper might be interesting, particularly figure 11. -
tcflood at 16:09 PM on 21 January 2016It warmed before 1940 when CO2 was low

Whenever I show this plot in a talk, someone invariably asks about the cause of the maximum around 1945. The only info I can find, including your posting above, talks about the general increase from about 1910 to 1945, followed by aerosol cooling until around 1975.
This 1935-1950 feature certainly looks real so the only thing I can say to the questioner is that I am not aware of a specific answer from climatologists, but I suppose that the pronounced bump is an accident of natural variability. The questioner usually appears as unsatisfied as I feel. Do any of you have a better answer?
Moderator Response:[DB] Resized image breaking page formatting.
-
Tom Curtis at 15:26 PM on 21 January 2016Real Skepticism About the New Marcott 'Hockey Stick'
Angusmac criticizes the Marcott reconstruction here, saying (in part):
"Rob, I agree that the conversation has veered off course for this comment thread but I do wish to make the following comments regarding Marcott et al (2013) that are relevant to baselining preindustrial temperatures:
- Marcott et al state that their results indicate that “global mean temperature for the decade 2000–2009 [HadCRUT3] has not yet exceeded the warmest temperatures of the early Holocene (5000 to 10,000 yr B.P.).” Therefore, if we were to use their reconstruction, we would be near to the Holocene peak.
- 80% of the Marcott et al proxies are derived from marine archives and consequently would underestimate global land-ocean temperatures. Consequently, the Marcott et al results should be adjusted upwards for an apples-for-apples comparison with land-ocean temperatures, as suggested by Glenn Tamblyn@9.
- Proxies tend to have multi-decadal to centennial resolutions and should not be compared directly with annual instrumental temperatures. Kaufman et al (2013) consider this by presenting the most recent 30-year period (1983-2012) from HadCRUT4 as shown by the star in Figure 2. However, a good case could be made for using a longer period for the instrumental mean when comparing it with proxies that are of centennial resolution e.g., Marcott et al (2013)."
Point (1) should be commonplace, although due to a common misinterpretation of Marcott et al, it is not. The misinterpretation is that the bold line in the center of the 1 sigma uncertainty interval in Marcott et al is the "reconstruction", whereas it is just the mean of an ensemble of reconstructions. Marcott et al state no preference among that ensemble as to which is the "real" value, so therefore all members of the ensemble must be given equal weight. All, or nearly all members of the ensemble frequently lie higher than the ensemble mean, and often much higher. It follows that temperatures greater than even 2015 are far more likely than not to have occured in the Holocene Climactic Optimum, and indeed may have occurred close to 1 in every 20 years over the period 5500 to 9500 BP.
Point (2), on the other hand is at best ill informed nitpicking. Ill informed because it assumes the differential rate of heating between land and ocean which leads to cooler oceans in a warming climate (and warmer oceans in a cooler climate) will be a significant factor over multi-centenial periods. For the Marcott mean value, the time resolution is 300 years, at which resolution the difference between land and ocean would be effectively nil. (This contrasts with the case for the much smaller resolution of reconstructions of the MWP.)
Nitpicking because while sea temperature proxies are 80% all proxies, the sea surface is 70% of global surface area. That is, sea surface temperatures are only overrepresented by 14.3%. This evidently creates a problem for somebody prepared to overlook that sea surface temperatures were underrepresented by 45.7% in the Lundqvist analysis that he prefers. Further, nitpicking because again in Marcott et al, NH proxies are again overrepresented (as is typically the case in reconstructions). Marcott el al write:
"The Southern Hemisphere is represented by fewer data sets (n = 11) than the equatorial (n = 33) and Northern Hemisphere (n = 29) regions, providing fewer constraints on characterizing the variability in our reconstruction for this region."
Despite Marcott's phrasing, the SH extratropics is well represented, with 15.1% of proxies for 18.3% of the surface area (17.5% under representation), but the NH extratropics has 39.7% of the proxies for 18.5% of the area (a massive 114.6% over representiation). Meanwhile tropical regions, with 45.2% of proxies for 63.7% of the area, are also under represented (29.1% under representation).
As can be seen below, NH temperatures rose much higher in the Holocene Climatic Optimum relative to tropical or SH temperatures:
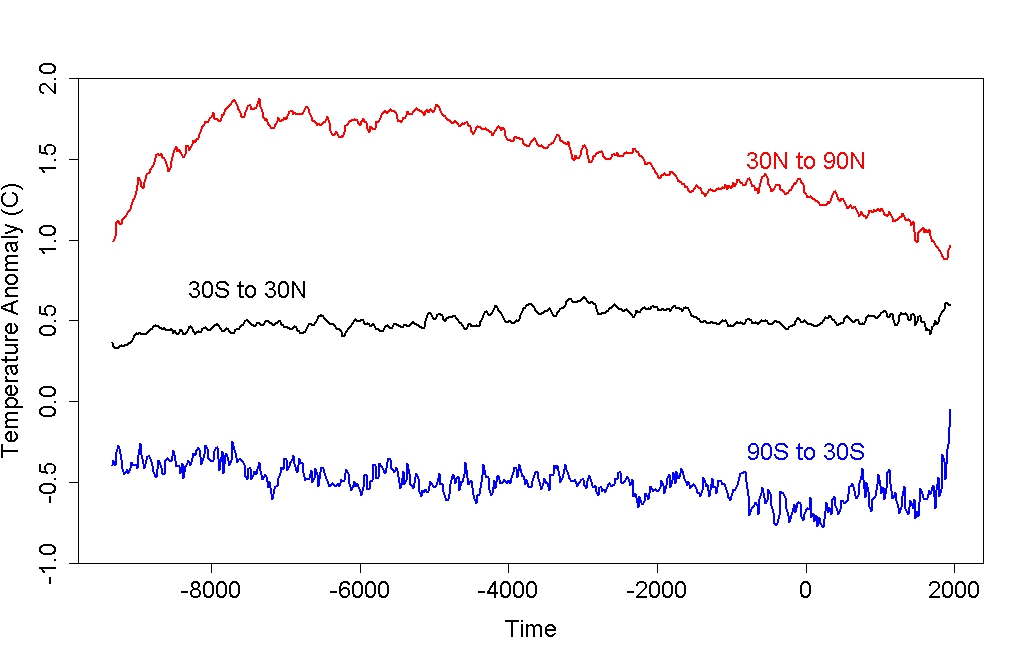
As it turns out, the most under represented area relative to the proportion of the Earth's surface shows lower temperatures over the Holocene Climactic Optimum, while the area with the greatest early holocene warmth is massively over represented.
These biases are far more likely to impact the final reconstruction than are the relatively minor land/sea bias pointed to by Angusmac. Further, they bias in the opposite direction to his presumption regarding the land/sea bias, and so would surely cancel the effect (at least).
Finally, as it happens Marcott et al checked for the effect of biases against a simple model:
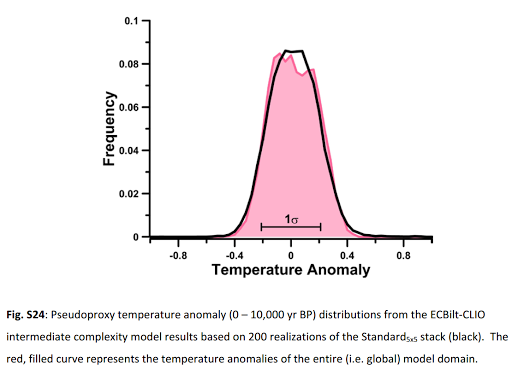
Clearly their methodology was sufficiently robust to eliminate all but a small part of the warm bias we would expect from looking at proxie locations alone.
I am currently short of time, and will discuss point three and further criticisms later.
-
Digby Scorgie at 12:57 PM on 21 January 2016The Quest for CCS
Tom
I'm essentially in agreement with you. I know it has for some time been technically and economically feasible to fix the climate problem. And of course it is politics blocking progress.
Glenn and OPOF
In belated reply to your points, I have to say that I agree with much of what you both say as well. Everything depends on our rate of change to renewables, which depends not just on technology but also on societal attitudes. Fixing the socioeconomic system would help. We shall see.
-
sailingfree at 11:19 AM on 21 January 2016A striking resemblance between testimony for Peabody Coal and for Ted Cruz
Thanks.
btw, the 2015 temperatures are now at NOAA http://www.ncdc.noaa.gov/cag/time-series/global
2015 is a scorcher, deniers better jump right to the stratosphere data.
Moderator Response:[PS] Fixed link. Please use the link tool in the comments editor to create links.
-
nekroluma at 07:22 AM on 21 January 2016It's the sun
limited selection set obfuscation and dulicity, it is UV class C radiation that is melting the ice, anyone can take a simple UV measurement and substantiate this reality. Why did UV class C suddenly start reaching the surface? the earths high altitude ozone layer is dissolved by CFC and HFC contamination only by oil refining unrestricted pollution since 1980 when the EPA was destroyed by reagan appointee james watt. So the only country with real air standards was compromised.
Moderator Response:[PS] Welcome to Skeptical science. Please take the time to review the Comments Policy and ensure future comments are in full compliance with it.
Firstly, you appear to be offtopic. I think this would be better under "its ozone". Use the search button in top left to find appropriate topics. Secondly, note the requirement to back claims. In particular, the claim that UV_C is melting ice caps is contrary to published science. The association of CFCs and HFC with oil refining is also unknown to me.
-
gtarestoration at 05:57 AM on 21 January 2016Corals are resilient to bleaching
Corals are bleaching across all the world’s oceans in only the third die-off of its scale in history, scientists have revealed.
El Nino and a Pacific warm water mass known as “The Blob” are combining with human-caused climate change to drive record high ocean temperatures.
These hostile conditions are expected to deplete more than 38% of the world’s reefs by the end of 2015, according to the US-based National Oceanic and Atmospheric Administration (NOAA).
Recent damage to corals in the Caribbean follows bleaching in the Pacific and Atlantic oceans earlier in the year, confirming the phenomenon as global in scope.
It has knock-on effects for species that rely on healthy corals for food, as well as for people who make a living from tourism or fishing.
“What really has us concerned is this has been going on for a year and is likely to last another year,” said NOAA coral specialist Mark Eakin.
The El Nino weather system, characterised by a period of warm water across much of the Pacific, is forecast to remain strong until early 2016.
-
knaugle at 05:10 AM on 21 January 2016Ted Cruz fact check: which temperature data are the best?
@BarryYou are correct. I did the search you suggested and sure enough he was named BY WUWT of all sites! :)
And along the way I found a rather scathing article by Tamino about some of A.W.'s accusations leveled at James Hansen and others.
Thank you.
-
knaugle at 05:03 AM on 21 January 2016Ted Cruz fact check: which temperature data are the best?
Here is an interesting article that addresses questions I've had for a while. How accurate are satellite measured temperatures of the troposphere? What are the issues with satellite indirect temperature measurements.
http://www.accuweather.com/en/weather-blogs/climatechange/some-of-the-issues-with-satell/54879902
Now that NOAA is out with its 2015 Annual SOTC report, you can bet many will be parading out Dr. Roy Spencer's results that show 2015 "only" 3rd warmest by UAH 6.0 satellite data. It's nice to understand the limits of his claim.
Moderator Response:[PS] FIxed link. Please use the link button in the comment editor to create them yourself.
-
BBHY at 01:09 AM on 21 January 2016Ted Cruz fact check: which temperature data are the best?
AuntSally @8, Curry says that not because it is the best method of measuring the Earth's temperature, but because it is the most useful piece of evidence she can point to that is contrary to the to consensus that the Earth is warming, and she sees herself in the Perry Mason role.
-
Tom Curtis at 15:17 PM on 20 January 2016The Quest for CCS
Digby Scorgie @46, if the world, or even just the US and China, could muster the political will to tackle AGW with the urgency with which they tackled WW2, we could reach zero net emissions in 20 years. It is neither technically not economically infeasible. It is, unfortunately, politically unrealistic; and I suspect we will pushing it even for a 50 year timeline based on politics alone. Holding concentrations constant requires reducing emissions to about 10% of current values so politically it is no harder than eliminating emissions altogether (though economically and technically it will be substantially more difficult as all the easy emissions cuts will already have been made). Timewise, however, there will likely be only a decade of difference between the point where we hold atmospheric CO2 constant and the point were we eliminate net emissions.
What I take from that assessment is that we should never let go of the point that it is technically and economically feasible to reach zero emissions in 20 years. Doing so lets the politicians of the hook. It allows them to go slow (or do nothing at all) when the only reason that is necessary is because they are determined to go slow or do nothing at all. Therefore, that it will probably take 50 years or more to reach zero net emissions is, IMO, an irrelevant fact. Because economic cost climbs with the rapidity of emissions reduction, we should focus on the 2050 target. That is because the 2050 target is consistent with keeping emissions below 2 C, and is the longest (ergo cheapest) target that is consistent with that target.
-
Glenn Tamblyn at 15:06 PM on 20 January 2016Ted Cruz fact check: which temperature data are the best?
Richard Lawson
The following from the post by Tamino linked from here shows this more clearly.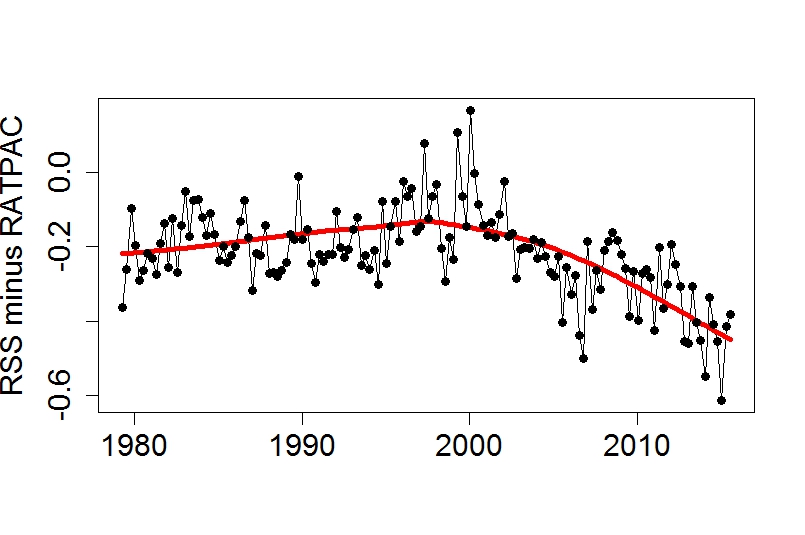
Difference between RATPAC and RSS. Looks like the divergence started more like 2000. That is about the time the satellites switched from being fitted with MSU's to AMSU.
So the suspicion is that something changed with the switch. Some unexpected drift in the AMSU's. But no one knows what yet. -
Digby Scorgie at 13:16 PM on 20 January 2016The Quest for CCS
Tom Curtis @45
I was trying to clarify my understanding of the science. I think I understand the implications now. I'm aware that in the long term it is essential that we reduce emissions to zero. I'm more interested in the short term — the next two decades. (Let me put it another way: If I live as long as my father, I've got two decades left.)
In the next two decades I'm sure we won't get to zero emissions. I doubt we'd even be able to hold carbon dioxide at 400 ppm. The implication is continued warming and worsening weather until our efforts to decarbonize begin to bear fruit after 2035. Is this a realistic assessment or is it too pessimistic?
-
John Mason at 13:08 PM on 20 January 2016A Rough Guide to Rainfall, Run-off and Rivers
Was deliberately keeping this as simple as possible!
Basically, latent heat is the energy that is needed to phase-change a substance (in the case of this post, water) to a higher state, which means from solid to liquid then gas or in other words from ice to water to water vapour (or in the case of sublimation from solid straight to gas). Such phase transformations gobble up energy. However it works both ways, so that when water vapour condenses or when liquid water turns to ice, energy is released. In convective weather situations, large amounts of latent heat are released as air rich in water vapour gets lofted to its condensation (or freezing) level: the heating has the effect of increasing the atmospheric instability because the rising air parcel, already buoyant since its surroundings are relatively cold, becomes even more so having been warmed internally by latent heat release.Jeff Haby has a piece on latent heat if anyone wants to get complicated:
http://www.theweatherprediction.com/habyhints/19/
Or try this from the IPCC:
https://www.ipcc.ch/ipccreports/tar/wg1/276.htm
Moderator Response:[PS] Fixed link
-
Eclectic at 11:47 AM on 20 January 2016There is no consensus
TheRobin @ 728, my viewpoint is much more the layman's , compared with Tom Curtis's more scientific assessment.
I had a look through some of Duarte's blogging output, about a year ago. That guy has a very weird way of viewing the world [to put it politely] . . . and my recommendation is that you will be wasting your time reading his ideas. Life is too short, to make it worthwhile spending time sifting through such quasi-sapient ramblings. Duarte is clearly intelligent, but his ratiocination is rather disconnected from reality.
Moderator Response:[PS] Eclectic - please refresh your memory of the Comments Policy. In particular, note the "no ad hom, no inflammatory tone, no accusations of fraud". Recent comments have pushed or been over the line.
-
nigelj at 11:12 AM on 20 January 2016Ted Cruz fact check: which temperature data are the best?
We will probably never have the ability to measure the warming trend exactly. We have to just accept there is a warming trend of significance.
Perhaps we should apply Occams Razor. Temperatures are warming. This warming is not explained by solar energy. This leaves the greenhouse effect.
-
sidd at 10:28 AM on 20 January 2016A Rough Guide to Rainfall, Run-off and Rivers
A sentence or para about latent heat release might be appropriate, if the author would care to add a comment ? -
Tom Curtis at 08:35 AM on 20 January 2016There is no consensus
TheRobin @728, I have addressed Duarte's criticism elsewhere. The upshot is that even if we allowed his criticisms as being entirely valid, and removed from the study all papers to which it applies, it would only reduce the consensus to 96.8%. That reduction ignores that several of the papers on Duarte's list were classified as 4, and therefore did not contribute to the consensus value; and that no doubt there were opposite errors were papers supporting the consensus were excluded or classified as 4 (both of which are known to have been the case). Ergo the 96.8% represents a generous overestimate of the impact of taking Duarte's criticism into account.
It is astonishing how consistently critics of Cook et al (2013) fail to estimate the impacts of their criticism on the 97%; and how consistently the impacts are negligible at best. There is a reasons why Duarte's criticism will not make it into peer review - but will be endlessly bandied around by those for whom rhetoric is more important than analysis.
-
Tom Curtis at 08:24 AM on 20 January 2016The Quest for CCS
Digby Scorgie @44, in the short term economic inertia ensures there will be more CO2 emissions. Consequently the information about zero emissions is relevant with respect to long term targets for emission reductions only. It is sometimes said that we need only reduce emissions by 50% with the assumption that the rest will be taken care of by the factors that currently remove about 50% of emissions from the atmosphere, but that is not correct. Even emissions as low as 10% of current values will ensure near constant atmospheric composition by balancing the reduction in CO2 overtime by natural drawdown. The result would be a further warming equal to about half of the warming todate over time. Emission rates of 1% of current values will probably ensure a slow long term rise in CO2 levels, with a consequent slow rise in temperatures. This will not be harmful in the short term because of the slow rate of temperature increase, but in the long term can easilly push temperatures in which the tropics are seasonally uninhabitable (not just uncomfortable, but literally uninhabitable). Further, even zero net emissions will not stop further sea level rises (although they will limit there scope).
All of this is important because it means we should be aiming, within 35 years (or 50 years on the outside) to reduce total human emissions to zero. It does not suggest we can plausibly reduce human emissions to zero in a year or even 15 years.
-
Rob Honeycutt at 07:55 AM on 20 January 2016Ted Cruz fact check: which temperature data are the best?
Sorry, I wasn't actually trying to be sarcastic. I was just having some fun. It wasn't intended to be at your expense, but rather for your enjoyment.
The secret hint is, the book Tamino is selling in the sidebar is his own book.
-
barry1487 at 07:52 AM on 20 January 2016Ted Cruz fact check: which temperature data are the best?
knaugle,
Put 'Tamino is statistician' into your search engine. You should find your answer somewhere in that list.
(shwiff!) [dive roll]
-
knaugle at 07:15 AM on 20 January 2016Ted Cruz fact check: which temperature data are the best?
Regarding #10, I wasn't trying to invite sarcastic stuff. Problem is if I don't know who someone is, not even the slightest hint, I'm inclined to be suspicious and the TAMINO site is suspect in my book. Though considering what Michael Mann has gone through, not proclaiming one's identity to the blogiverse is understandable.
-
Rob Honeycutt at 06:49 AM on 20 January 2016Ted Cruz fact check: which temperature data are the best?
And Eli Rabett is really... (thwip!)... Aaaaagh!
-
Ted Cruz fact check: which temperature data are the best?
Tamino is a statistician who has written a lot about global warming.
His blog is here, and the blog post containing the graph that compares RATPAC and RSS is here. -
Rob Honeycutt at 06:46 AM on 20 January 2016Ted Cruz fact check: which temperature data are the best?
Tamino's identity is one of those closely held open secrets that everyone is aware of. He's a statistician named...(thwip) ACK! ...Poison...dart...to...the...neck.
-
Digby Scorgie at 06:32 AM on 20 January 2016The Quest for CCS
Andy
I reread your blogpost. I think I have it now:
If emissions of carbon dioxide are suddenly cut to zero, the delayed warming resulting from the inertia of the system is almost exactly balanced by the cooling resulting from the declining concentration of atmospheric carbon dioxide. For at least the short to medium term the average global temperature therefore remains approximately constant.
But in the real world, even if action is taken to begin limiting emissions, carbon dioxide will continue to rise above 400 ppm although at a decreasing rate of increase. After some time the concentration will reach a maximum and then begin falling. Right?
The implication is that in the short term we'll still suffer from a rising global temperature and a worsening climate — enough to cause the collapse of global civilization? Don't know. And if it collapses, will fossil-fuel use fall drastically? I should think it would.
-
knaugle at 06:18 AM on 20 January 2016Ted Cruz fact check: which temperature data are the best?
So WHO is tamino? The link/site gives no indication who or what is behind it.
-
TheRobin at 05:40 AM on 20 January 2016There is no consensus
Has anyone looked at the rebuttal from José Duarte regarding Cook's 97% consensus paper? (http://www.joseduarte.com/blog/cooking-stove-use-housing-associations-white-males-and-the-97)
He makes quite a good case about various biases being in the methodology along with pointing out how the claimed standards have not been met in various ways.
From what I can tell he makes a pretty compelling case that the 97% consensus is way overstated as a result of those errors.Moderator Response:[RH] Please inform us when Duarte gets his rebuttal through peer review and we can discuss it at that time.
-
Brandon R Gates at 04:46 AM on 20 January 2016Surface Temperature or Satellite Brightness?
Kevin, Thanks for setting me straight as well as for your further explanations, and of course the article itself which has helped me better understand a number of other things regarding uncertanties in all temperature anomaly time series.
-
AuntSally at 01:34 AM on 20 January 2016Ted Cruz fact check: which temperature data are the best?
Alright, let me rephrase. In the video, Judith Curry asserts satellite data (presumably mid-trop MSU) is "the best data we have." I'm looking for a resource that clarifies her statement. Am unable to find, from her, a more detailed explanation of this statement. Anyone know what her reasoning is (presumably she has her reasons for this assertion).
-
Joel_Huberman at 00:51 AM on 20 January 2016Satellite record is more reliable than thermometers
The graphic says that 2.3% of global warming is going into the atmosphere. In the context of satellite measurements, it would be useful to know what percent of warming is going into the lower portion of the atmosphere where people live and where standard thermometers are located, and what proportion is going into each of the atmospheric layers measured by satellites. Since atmospheric density decreases rapidly with altitude, I suspect that mid- and upper-troposphere measurements represent extremely small portions of the heat capacity of our total Earth system. But I'd like to see the numbers; I'm not able to calculate them myself.
Prev 501 502 503 504 505 506 507 508 509 510 511 512 513 514 515 516 Next


