


 Arguments


Tracking the 2°C Limit - November 2015
Posted on 1 January 2016 by Rob Honeycutt
November produced another scorcher in the GISS record, coming in at 1.05°C over baseline. If we add our preindustrial baseline adjustment of -0.256 we get a preindustrial anomaly of 1.306°C (this is the difference between the GISS baseline and the 1880-1909 preindustrial baseline).
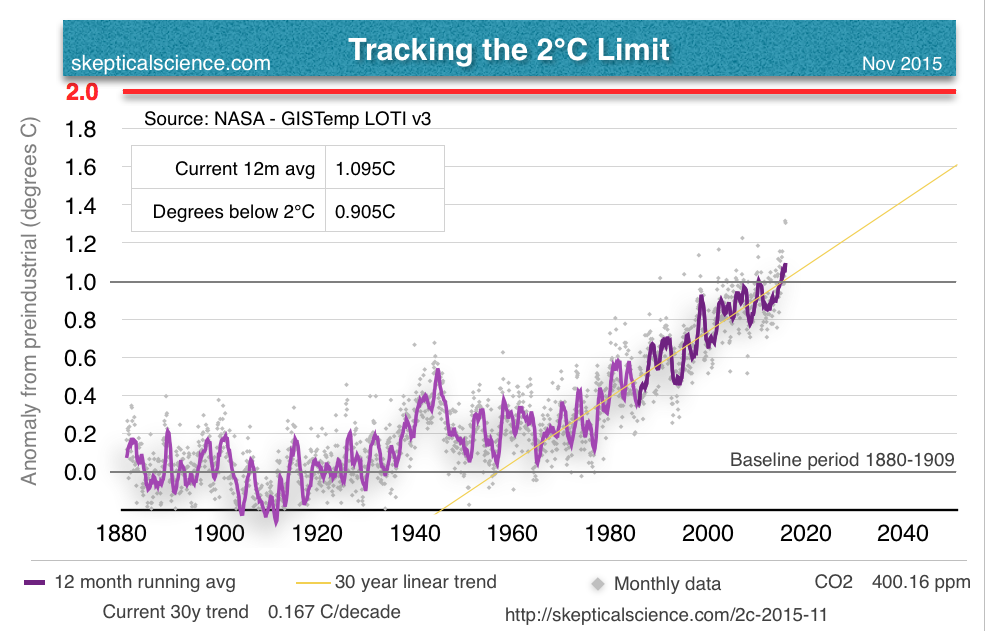
[Click here to view a full size version of this graph.]
Watching the progression of the kelvin wave on the weekly ENSO report of NOAA, this past week Nino3 and Nino3.4 dropped slightly from 3.0 to 2.9 and 2.8, respectively. It's possible we're seeing the peak of this year's super el Nino, but as Yogi Berra always said, "It ain't over till it's over."
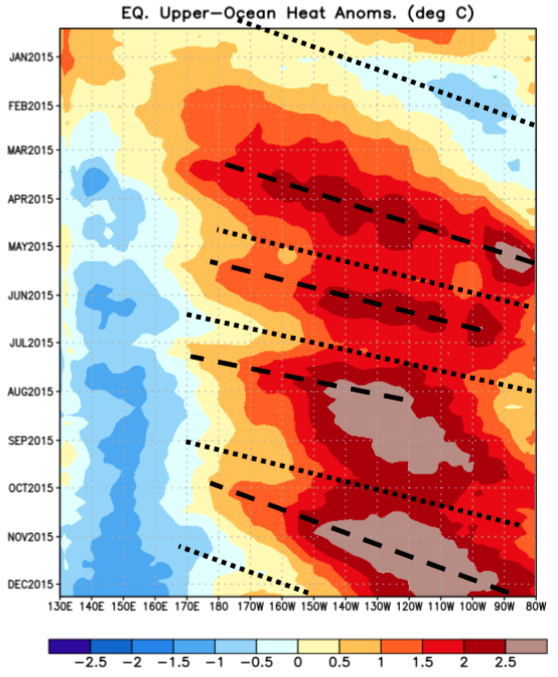
We'll keep our collective eyes out on this, but another upwelling phase seems to just be peeking its head up right there at the bottom of the chart.
The latest satellite data have still not registered this el Nino at all, but based on past el Nino events that will probably change in the early part of 2016. Sou at Hotwhopper has a really great chart comparing past el Nino events here:

Sou also produces probably one of my favorite temperature graphs of all time, which I think everyone should follow.
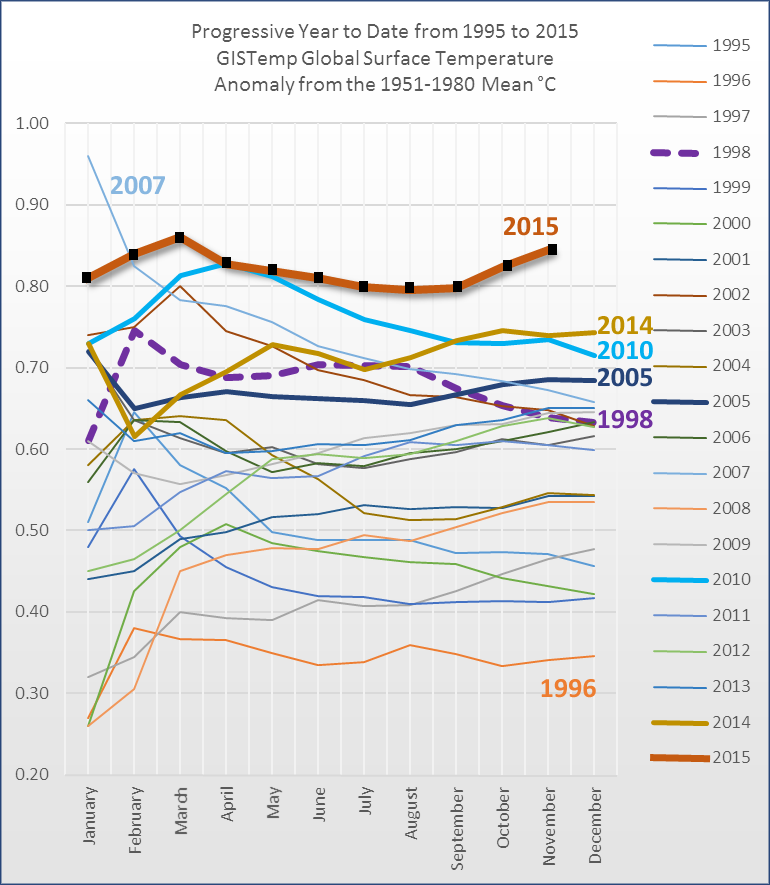
Suffice to say, 2015 has been freakishly warm compared to previous years. 2016 is likely to be very similar, and it's probably not going to be until 2017 that we see any retreat from this level of warmth.
Again, starting with July 2015, you can find any specific version of the 2°C Limit chart at: skepticalscience.com//pics/2c-[YYYY]-[MM].png


Thanks, Rob.
Regarding the El Nino, just looking at the Southern Oscillation Index - it was positive, quite a lot for a bit, but the bottom has fallen out the last five days or so and it's swung negative - a lot. BoM says that's not uncommon for this time of the year, when El Nino should be starting to wind back. (When the SOI is less than -7 (minus 7) for an extended period, it's considered the El Nino is in force.)
I did an update of the RSS chart for the El Nino too, adding December temperatures, and the temperature has gone up faster (and higher) than it did in 97 and 2009. Each El Nino is different.
I'll probably look into this more sometime over the next few days. The next Bureau of Meteorology (Australia) update is this coming Tuesday, so will time it after that.
BTW it's uncharacteristically wet and cool here today for an El Nino year, though it's not out of line with the Bureau forecasts. (We got some very hot weather in December.)
As Sou points out, December 2015 was very hot in the RSS satellite record, the warmest ever in fact. Should prove interesting in the next few months as the 1998 record monthly temperature for the lower atmosphere may be under threat.
Here's what Tao Triton shows is happening in the equatorial Pacific Ocean for the surface...
and subsurface.....
Rob
Using the 1880-1909 baseline for preindustrial temperatures could be construed as cherry picking because it represents a period of very low values in the temperature record.
Would it not be more logical to use a previous warm period as representative of preindustrial temperature, say Moberg et al (2005)?
For example, I present Ljungqvist (2010) which shows that the MWP mean is similar to the 1961-1990 instrumental mean.
Reconstructed Extra-tropical (30-90 °N) Decadal Temperature Anomaly to 1961-1990 mean (after Ljungqvist, 2010)
I suggest that the MWP mean from Ljungqvist (or any other reasonable paleo reconstruction) would be an appropriate baseline for preindustrial temperature.
angusmac @3, fairly obviously, the forcings in operation in 1000 AD did not have the same strengths as the forcings in operation in 1750, or 1890. Therefore the value of the forcing in operation in 2015 are not the value of the forcings in 1000 AD plus the anthropogenic forcings. Rather, they are the values of the forcings in 1750 plus any changes to natural forcings, plus the anthropogenic forcings. It follows that the temperature comparison needed to determine the impact of forcings is that between 1750 and 2015 - not 1000 and 2015. By best estimate, Rob's baseline underestimates the temperature rise since 1750 by about 0.2 C.
More fundamentally, the reason for tracking the temperature is the widespread concern that temperature increases of 2 C above preindustrial temperatures (defined as those in 1750) will cause significant harm to the global economy, and catastrophic effects to some individuals. For tracking progress towards that target, again obviously the 1750 temperature is the appropriate temperature.
Where you not more keen on making a silly rhetorical point than in understanding the debate, I doubt you would have missed these nuances.
angusmac... What I've done is limit myself to the GISS data. 1880-1909 is the earliest 30 year period in that that set.
Going back to the MWP would be inappropriate since (a) itsn't not inclusive of the data I'm using, and (b) it's several hundred years prior to the industrial revolution.
As Tom states, my preindustrial baseline likely underestimates actual preindustrial temperature, but it's as close as I can get with GISS.
I would also note, angusmac, that Ljundqvist is "extratropical Northern Hemisphere (90–30°N)," thus not only is it not global, it's not even inclusive of the entire northern hemisphere. (Stated right there is the abstract you link to.)
One more thing... Why would you think it appropriate to use a "previous warm period" as a baseline instead of the most recent preindustrial temperature?
Why indeed not use for comparison the Medieval Warm Period ?
Or indeed, Angusmac, why not use the Dark Ages Cold Period, instead, as the baseline for comparison ?
Then also, for the MWP, we have the little problem ~ that the Southern Hemisphere did not have a comparable "MWP" . So, to avoid fruitless bickering . . . best if we stick with the much-better documented temperature information that we have for the latest couple of centuries. Clearly the best choice, by far.
angusmac
From Ljungqvist - "A new temperature reconstruction with decadal resolution, covering the last two millennia, is presented for the extratropical Northern Hemisphere (90–30°N)"
So your comment "I suggest that the MWP mean from Ljungqvist (or any other reasonable paleo reconstruction) would be an appropriate baseline for preindustrial temperature." isn't a very good idea.
Comparing an old record taken from 25% of the earths surface with a modern record for 100% of the surface is comparing apples and oranges.

In contrast, here are the zonal graphs from GISS instead of the global graph Rob used. The top one is Northern extra-tropics. They aren't using 30N as the cutoff but 23.6N but it is still closer than using the entire globe.
For the period around 1900 to the present that is a temperature rise of around 1.4 C
Superimpose 1.4 C on the graph from Ljungqvist starting around 1900 and what do you get?
Next, the graph you show isn't directly from Ljungqvist which can be found here. Ljungqvist does have some modern temperatures shown. They use CRUTEM3 & HaddSST2. So a land and ocean dataset, and a slightly older one at that. Yet when you look at their paper virtually if not all their proxies are land based. So are the trying to compare a land-only proxy record with a recent land and ocean dataset? If so, since land temperatures vary more than ocean there is a good chance an apples with apples comparison would show results similar to GISS. And the GISS graphs is land and ocean as well.
So all in all, using Ljungqvist as a baseline doesn't seem like a very good idea.
Tom, Rob, Eclectic & Glenn
The point I was trying to make was that the MWP is certainly preindustrial and not affected by anthropogenic CO2. Furthermore, paleo reconstructions show that the MWP was significantly warmer than 18-19th century temperatures and that this period was not dangerous. Consequently, it would be logical to use the MWP temperature as a baseline to decide what temperature is and isn’t dangerous as we progress into the 21st century.
For example, Huang et al (2008) state that, “The reconstructed peak temperatures in the MWP appear comparable to the AD 1961–1990 mean reference level”. Therefore, if we were to use Huang et al (2008), it would be logical to compare dangerous temperatures with those that are comparable to the 1961-1990 baseline. Interestingly, Ljungqvist (2010) also shows the MWP mean to be similar to the 1961-1990 mean, albeit (as Glenn points out) for the NH.
I now respond to individual comments.
Eclectic, the MWP was global and there are several papers that confirm this, e.g., Huang et al (2008) above.
Glenn, it was not my intention to infer that we should compare NH proxy temperatures with global instrumental. This is why I stated that we should use a reasonable paleo reconstruction. You could choose your own to compare apples with apples.
Additionally, the reference level for Huang et al (2008) paper is the 1961-1990 global mean instrumental record. This appears to be CRU but Huang et al do not state explicitly in the paper if they are comparing their land-only proxies with land-only instrumental temperatures
[DB] "paleo reconstructions show that the MWP was significantly warmer than 18-19th century temperatures"
And
"the MWP was global"
Not only is that claim NOT established, the bulk of the credible evidence attests to quite the opposite.
Per the PAGES 2000 reconstruction, current global surface temperatures are hotter than at ANY time in the past 1,400 years, and that while the Medieval Warm Period and Little Ice Age are clearly visible events in their reconstruction, they were not globally synchronized events.

Source SkS Post
Source Paper
Ancillary Source
Please ensure that future comments do not contain such outright factually incorrect statements.
Unfortunately, Angusmac, the Huang paper is currently off-line at the link you gave.
My memory is sketchy, since it is some 2 years since I was reading on the NOAA website that the Medieval Warm Period . . . was more a North Atlantic phenomenon ~ during which, the Andean and West-Canadian glaciers were still advancing (plus some other Southern Hemispheric evidence). The gist of it was that the MWP was greatly overrated as an event of global importance.
Whether the (so-called) MWP should be discounted 50% or 75% (or not at all! ) in the discourse about "climate baseline" . . . there still remains the question of why you yourself should not equally favour the use of the Dark Ages Cold Period as the criterion baseline for AGW consequences. And like the MWP, the DACP is also susceptible to criticism !
In reality, neither Period is worthy of much consideration, because the vast amount of hard evidence we have about the Modern Period, is entirely superior as a basis for making important decisions (about climate).
Angusmac @10:
1) Even if it would be convenient to state the increase in global temperature relative to the 1961-1990 average, the 2 C guideline for dangerous global warming is currently stated relative to preindustrial (approx 1750) temperatures. If you adjust the baseline for this series to 1961-1960, you ought also to adjust the guideline for dangerous global warming to the same baseline. Adopting the convention that preindustrial temperatures equal the 1880-1809 mean, that means adjusting the guideline down from 2 C to 1.669 C. Similarly adjusting the figure in the OP, we obtain 0.764 C above the 1961-1990 mean. Importantly, the result is that there is no change in the 0.905 C estimate remaining relative to the guideline.
In sum, even if we allow that your pedantry has a reasonable basis, it makes not substantive difference.
2) It is far from clear that MWP temperatures were globally beneficial. Yes, anecdotal evidence suggests they were beneficial in Greenland, and Western Europe but the data to claim it was globally beneficial does not exist, despite your statement of faith.
What we can be fairly confident about is that the warming to 1980 plus the accompanying CO2 fertilization effect was economically beneficial in the global average. Since 1980 the combined effect has possibly continued to be beneficial in Western nations, but has likely been harmful in poorer, particularly tropical nations. From the relevant community of experts, 41% think the global gains to 1980 have already been wiped out. A further 22% think it will be wiped out within the next 10 years, with a further 26% thinking it will be wiped out within 35 years. In all, that makes 89% of relevant experts who think impacts will be net negative by approximately 2 C above preindustrial temperatures
3)
Huang et al (2008):
Note, as a land only temperature series, temperature variations will be overstated relative to global (land plus ocean) temperature variations in both the instrumental and reconstructed temperature histories.
Moderator@10
I enclose documentation that casts doubt on your assertion that I was using “factually incorrect statements.”
Regarding the MWP and the LIA not being “globally synchronized events”, it is evident that temperatures did not fluctuate uniformly among all regions. However, the PAGES 2k summary presented by Kaufman et al (2013) does show a distinct global MWP and LIA as shown in Figure 2.
Figure 2 (Kaufman et al, 2013)
Additionally, Section 5.3.5.1 of AR5 also states that, “The timing and spatial structure of the MCA [MWP] and LIA are complex…with different reconstructions exhibiting warm and cold conditions at different times for different regions and seasons.” However, Figure 5.7(c) of AR5 shows that the MWP was global and (a) and (b) show overlapping periods of warmth during the MWP and cold during LIA for the NH and SH.
Figure 5.7 WG1 AR5
Perhaps you may wish to consider updating your SkS references to include the AR5 information on the global extent of the MWP.
Eclectic@11
I suggest that we should compare similar temperatures cycle, namely, warm periods with warm periods and cold periods with cold periods.
If we use the lowest temperatures of the LIA or the Dark Ages as the baseline we could be guilty of cherry picking – in a similar manner to some web sites comparing current warming with the 1998 El Nino peak to state that no warming has occurred since 1998.
Regarding hard evidence of the modern warm period, it is not the purpose of my post to discuss the efficacy of modern temperature measurements. I am only questioning the baseline from which “dangerous” is measured.
Angusmac @14... But the peak of the last glacial period was also "preindustrial" so why not use that?
Angusmac... I think the faulty point of your thinking is assuming that current global mean temperature today would be similar to the MWP without the assistance of man-made CO2. But when researchers have attempted to estimate what would have happened without human forcings they come up with results that show the climate would likely have slightly cooled.
Tom@12
3) Thank you for supplying the reference. I only looked at the references at the end of the Huang et al paper, not in-text. I also agree that land-only temperatures have greater variation than land-ocean but this does not change the logic of my post.
2) I disagree that MWP was beneficial is a "statement of faith" – it is my perception that it is well-documented history.
I am an avid reader of history and this shows that, since the last ice age, warm periods have usually been beneficial to the human race and cold periods are usually accompanied by crop failures and famine. Indeed, civilization occurred during the Climatic Optimum shown in Figure 2 (Kaufman et al, 2013) in my response to the Moderator@13.
I make no comment on post-1980 CO2 fertilisation effects, I neither mentioned this subject nor alluded to it.
1) Regarding pedantry, if people wish to use a pre-industrial temperature of 1750 and thus ignore warmer times in the past then they are entitled to their opinion. However, this ignores the fact that temperatures similar to the 1961-1990 mean did occur in the past without any documented dangerous effects on humanity. Consequently, “dangerous” should be measured from this or a similar baseline and not a very low period in the temperature history.
My opinion is that the 1750 baseline is arbitrary and is akin to cherry picking as stated in my response to Eclectic@14 regarding the Dark Ages temperature minimum.
Referring to your adjustment to the guideline of “1.669 °C” above the 1961-1990 mean, this does not sound nearly as bad as 2 °C. Additionally, does this adjustment mean that we are currently ≈ 0.67 °C above the guideline and not ≈ 1 °C ?
angusmac @17:
2a) The simplest climate effect of warm periods is to expand the Hadley Cells that exist on either side of the intertropical convergence zone. That has the effect of causing tropical wet conditions to expand poleward, but also for the arid regions on either side of the tropical region to also expand poleward. In European longitudes, that means nations bordering the mediterrainian become more arid. Much of the middle east including Peria/Iran would also become more arid. For Australia it means the southern states become more arid while the northern states become wetter. This is not a beneficial change.
Secondary effects can be more complicated. The MWP was associated with megadroughts In eastern Africa (around Kenya), the South Western United States, Peru, and Northern Europe:
The Northern European drought was complicated in that it was primarilly a reduction in summer rainfall, and was compensated for regions close to the Atlantic by increased winter rainfall. That may explain why slavic populations (far from the Atlantic, and therefore significantly impacted) were less able to resist germanic invaders, who durring the time of the MWP pushed into formerly slavic areas in what is now Poland. In either event, while the MWP was beneficial for germanic people in general, it was not beneficial for slavs.
In short, there is solid evidence that the MWP was not beneficial for a large number of people, across the world, while being beneficial for others. What does not exist is evidence tying together the sum of the effects. We don't know whether or not the gains of the germanic people outweighed the losses of the slavs and italians. Nor do we know whether gains by american plains indians compensated or exceeded the losses by the pueblo dwelling indians of what is now the SW USA. And nobody has integrated the effect globally. I doubt the information to do so exists.
In short, your insistence that we know the MWP was beneficial amounts to an insistence either that only germanic people and their descendants matter (they being the only ones of which we can say this with confidence) or a fairly blind faith beneficial effects for those germanic peoples were universal.
2b) With regard to the CO2 fertilization effect, logically if it is beneficial (as seems likely), then the temperature which is most beneficial from Global Mean Surface Temperature alone will be less than the temperature which is most beneficial given GMST plus the CO2 fertilization effect. The later is probably somewhere between 0.8 and 1.1 C above the preindustrial average for our current civilization. The figure will differ with different technologies and population distributions. If the CO2 fertilization effect is significant, that implies the ideal temperature for current populations and technologies absent the CO2 fertilization effect has already been exceeded, and my have been exceeded early in the 20th century.
1) First, choosing as a baseline the most recent period prior to major rapid human climate influence is not arbitrary. It is certainly not a cherry pick. It fixes a useful baseline without the question of the absolute peak of benefit from warming needing to be determined.
In contrast, your baseline requires the unproven assumption that MWP warmth was net beneficial for humans, and the dubious assumption that without anthropogenic influence current temperatures would be equivalent to MWP temperatures (the mid-century solar maximum has gone, which together with recent volcanism suggests natural forcings would be back at early 20th century values) to justify it. Of course, you give away the real justification when you write "this does not sound nearly as bad as 2 °C".
In response to your final question, we are 1.095 C above the baseline used above, and probabily 1.3 C above the preindustrial baseline. That puts us 0.905 C below the guideline used above, but probably 0.7 C below the 2 C above preindustrial guideline. Adopting your convention, we would be 0.764 C above the baseline, and 0.905 C below the guideline used above, but probably 0.7 C below the preindustrial guideline. The current twelve month running average is more than 1 C over the baseline used above.
Too late. 415 ppm CO2 causes 3 to 4 C increase in temperature.
scripps.ucsd.edu/programs/keelingcurve/2013/12/03/what-does-400-ppm-look-like/
Global warming only became an issue in 1992 after the Cold War. By then it was too late. Too late. Too late.
[GT]
Big Oil.
Scattering so many comments over multiple threads so quickly isn't very helpful to the conversations. Each of your comments are reasonably on topic but perhaps confining yourself to one or two threads and elaborating a bit more might be more fruitful.
Images in angusmac@13 fixed Figure 2 Kaufmann et al (2013)
  Figure 5.7 WG1 AR5
I agree that the Holocene peak is preindustrial but I chose to use the MWP because there is more data available for the MWP.
Notwithstanding the above, Renssen et al (2012) estimate the spatial distribution of the Holocene Thermal Maximum (HTM) temperature anomalies as shown in Figure 1. Figure 1: Global Variation of Holocene Thermal Maximum Anomalies (Source: Renssen et al, 2012)
Renssen et al (2012) use a pre-industrial mean of (1,000 to 200) BP and it is evident from Figure 1 that most of Europe and North America experienced an anomaly of 2-3 °C during the HTM. Renssen et al (2012) is cited in 5.5.1.1 of AR5 WG1and they offer the following conclusions their paper:
I conclude from the above that many parts of the world exceeded the 2 °C limit without any dangerous consequences and that these temperatures occurred when CO2 was at ≈ 280 ppm.
angusmac@21 was my resonse to Rob Honeycutt@15
Rob Honeycutt@16
I did not state that current warming, "would be similar to the MWP without the assistance of man-made CO2." I only stated (and cited references) that showed that temperatures in the MWP were similar to 1961-1990 mean tempratures.
Nevertheless, I do agree that computer models only show current warming if anthropogenic forcings are included. However, my question is what caused the previous warm periods when the human contribution was negligible?
angusmac @21, the map you show from Renssen (2012) does not represent any specific time period. Renssen states:
In fact, consulting figure 5, we see that the maximum temperatures are drawn from every month except May, and the consulting figure 4a, that while most occure in the three millenium span, 6-9 kya (with approximately equal portions from each of those three millenia), some occur as recently as the last millenia.
Further, consulting Figure 2, we see that temperature trends in different seasons may be exactly opposite each other. Indeed, given the insolation history in high NH lattitudes, that is exactly what we would expect. It follows that the maximum temperatures shown by Renssen are not annual averages for any year.
Given these strictures on the data, your use of it can only be called an abuse of data. If I had any confidence you knew what you are talking about, I would call it fraudulent. That is because the rise in temperatures for the 2 C guideline is a 2 C rise in the annually averaged Global Mean Surface Temperature (GMST). It is expected that:
All these features have already been observed. The consequence is that a map of temperature maximums on the same line as that in Jenssen (2012) at a 2 C increase, even if constrained to the same year, would show significantly greater than a 2 C increase in temperature. In fact, from Marcott et al, which you frequently cite, we know the increase in annually averaged GMST in the Holocene Thermal Maximum to have been approximately 0.5 C relative to preindustrial values. Consequently, your argument @21 amounts to the claim that, because we surived temperatures 0.5 C above the GMST it is patently clear that temperatures 2 C above the preindustrial average will be without "any dangerous consequence".
I will further note that your assumption that the HTM was "without any dangerious consequence" is as faith based as your prior, similar assumption about the MWP. It is plausibly argued that in some areas of the world those conditions were very beneficial, as evidenced by the invention of agriculture. Agriculture, however, was invented in low latitude regions close to water (The middle east, the Indus delta, southern China, and Central America). Those are regions with low temperature increases, even on Jenssen's map. They are not the regions which you highlight.
Finally, here are model projected temperature anomalies for the 2050s (approximately 2 C warming) relative to the 1971-2000 mean:
Please note the archaic units to avoid confusion. As you can see, regionally in that situation, we will be facing temperatures as high as 10 C above the 1971-2000 average. Clearly even if Jenssen 2012 was an annually averaged map, it would be considerably cooler than what we are facing with BAU.
angusmac @23... The question of what the drivers were for the MWP is unrelated to baselining preindustrial temperature. The question of what global mean temperature would be without the effects of man-made forcings is relevant and is a far more interesting approach. Based on the modeled data I posted @16 it looks like the 1880-1909 baseline would be pretty close. It would be interesting to get actual figures for that modeled data for more accurate comparison.
Tom Curtis@18
Your post is quite long and detailed. Therefore, I shall respond on a subject-specific basis in individual posts.
Meantime, I am pleased that you concur that the MWP was global by citing events in Europe, Middle East, Eastern Africa, South Western United States and Peru. It would probably be worthwhile informing the Moderator at angusmac@10 of the global extent of the MWP.
Additionally, could you give me reference for your Figure 2 so that I may cross-check it?
[JH] Snark deleted.
angusmac @26, saying the MWP is global is ambiguous. Was the GMST durring the MWP warm relative to periods before and after? Yes, and in this sense it is a global event. Were there significant climate perturbances across the globe durring the MWP? Again, yes. And again, in this sense, the MWP was global. Were temperatures elevated in the MWP across most individual regions across the globe? No:
(Mann 2009; discussion)
There were areas on increased warmth, and areas of increased cold relative to the mid-twentieth century (1961-1990). So in this sense, the Medieval Warm Period was not global, although the Medieval Climate Anomally was.
In contrast, we truly are seeing global warming currently:
In any event, you would do well to not just assert that the MWP was global (or that it was not), but to clarrify just in which sense you mean that it was global. Failure to do so will only lead to confusion.
With regard to the figure, the source linked by the second link in my post @18.
angusmac - "I only stated (and cited references) that showed that temperatures in the MWP were similar to 1961-1990 mean tempratures."
During the Medieval Climate Anomaly, a period of several hundred years, various regions reached temperatures similar to the latter half of the 20th century. But very importantly, not simultaneously - as per the recent PAGES 2k reconstruction:
There was no MCA shift in global temperature anomaly comparable to recent changes. This has been pointed out to you repeatedly, with copious documentation by Tom Curtis in particular - your continued insistence on a MCA similar to recent temperatures seems to indicate that you aren't listening to the evidence presented.
Tom Curtis@24 Regarding your assertion of my “abuse of data” and being “fraudulent”, regarding the use of the Renssen et al (2012) HTM temperature anomalies, I can only assume that you are stating that I portrayed Renssen et al as global average temperatures. You are incorrect. I did not state that they were global average temperatures; I only stated that, “...many parts of the world exceeded the 2 °C limit” in my comment on Renssen et al. I fail to see anything fraudulent in this statement.
Referring to global average temperatures, I do not know why Renssen et al did not present global averages because they obviously have the data to do so. However, if you wished to obtain an early Holocene global average from Renssen et al, it is a simple matter to inspect one their references, e.g., Ljungqvist (2011) offers the following conclusions on global temperatures:
I agree that with you regarding temperatures during earlier warm periods that it could be, “…plausibly argued that in some areas of the world those conditions were very beneficial” but I will stick to what you call my “faith” that they were beneficial to humanity overall. I will leave it to the proponents of 2°C-is-dangerous scenario to prove that temperatures of 1 °C or “possibly even more” were harmful to humanity as a whole.
Finally, you state that I frequently cite Marcott et al but, once again, you are incorrect. I only cited Kaufman et al (2013) which shows Marcott et al as one of their temperature simulations in their diagram. The Marcott et al Climate Optimum was only mentioned once by me in angusmac@17
Angusmac @29 (1) Renssen et al (2012) label their figure 3 a as "Simulated maximum positive surface temperature anomaly in OGMELTICE relative to the preindustrial mean, based on monthly mean results." You reduced that to "Thermal Maximum anomalies", thereby falsely indicating that they were the mean anomaly during the Holocene Thermal Maximum. That mislabelling materially helped your position, and materially misprepresented the data shown. In defense you introduce a red herring that I was suggesting you indicated they were "global average temperatures", when "global average temperatures" would of necessity be shown by a timeseries, not a map.
Further, you argued that the map showed that “...many parts of the world exceeded the 2 °C limit”. However, as the map showed mean monthly temperatures (from widely disparate seasons and millenia), they do not show mean annual temperatures for any location and therefore the map cannot show that the 2 C limit for annual averages at any location, let alone that it was exceeded for the Global Mean Surface Temperature. That your conclusion did not follow from your data was significantly disguised by your mislabelling of the data.
Given that you are persisting with the idea that you did not misrepresent the data, now that I have spelled it out I will expect an apology for the misrepresentation. Failing that, the correct conclusion is that the misrepresentation was deliberate.
angusmac @21/22... "I conclude from the above that many parts of the world exceeded the 2 °C limit without any dangerous consequences and that these temperatures occurred when CO2 was at ≈ 280 ppm."
That's not the question at hand, though, is it? Parts of the world today exceed 5°C over preindustrial. The question is whether global means surface temperature will exceed 2°C, which would be inclusive of Arctic amplification having northern regions exceeding 8°-10°C.
Angusmac @29 (2), I am disappointed that you drew my attention to Ljungqvist 2011 for I had come to expect higher standards from that scientist. Instead of the standards I have expected, however, I found a shoddy paper reminiscent of Soon and Baliunas (2003) (S&B03). Specifically, like S&B03, Ljungqvist 2011 gathers data from a significant number (60) of proxies, but does not generate a temperature reconstruction from them. Rather, they are each categorized for different time periods as to whether they are more than 1 C below the preindustrial average, withing 1 C of that average, more than 1 C but less than 2 C, or more than 2 C above the preindustrial average. The primary reasoning is then presented by a simple head count of proxies in each category over different periods, shown in Figure 3, with figure 3 a showing land based proxies, and figure 3 b showing marine proxies:
(As an aside, C3 Headlines found the above graph too confronting. They found it necessary to modify the graph by removing Fig 3b, suggesting that the thus truncated graph was "terrestial and marine temperature proxies".)
If the proxies were spatially representative, the above crude method might be suitable to draw interesting conclusions. But they are not spatially representative. Starting at the simplest level, the 70% of the Earth's surface covered by oceans are represented by just 38% (23/60) of the proxie series. As the ocean proxie series, particularly in the tropics, are cooler than the land series, this is a major distortion. Worse, the 6.7% of the Earth's surface North of 60 latitude is represented by 25% of the data (15/60 proxies). The 18.3% of the Earth's surface between 30 and 60 degrees North is represented by another 43% of the data (26/60 proxies). In the meantime the 50% of the Earth's surface between 30 North and 30 South is represented by just 23% of the data (14/60 proxies), and the 50% of the Earth's surface below the equator is represented by just 15% of the data (9/60 proxies).
This extreme mismatch between surface area and number of proxies means no simple eyeballing of Fig 3 will give you any idea as to Global Mean Surface Temperatures in the Holocene Thermal Maximum. Further, there are substantial temperature variations between proxies in similar latitude bands, at least in the NH where that can be checked. That means in the SH, where it cannot be checked due the extremely small number of proxies, it cannot be assumed that the 2 to 4 proxies in each latitude band are in fact representative of that latitude band at all. Put simply, knowing it was warm in NZ tells us nothing about temperatures in Australia, let alone South America or Africa. This problem is exacerbated because (as Ljungqvist notes with regard to Southern Europe, data is absent from some areas known to have been cool HTM.
The upshot is that the only reliable claims that can be made from this data is that it was very warm North of 60 North, and North of 30 North on land in the HTM. The data is too sparse and too poorly presented to draw any conclusions about other latitude bands and about Ocean temperatures, or Land/Ocean temperatures from 30-60 North.
Given the problems with Ljungqvist 2011 outlined above, I see no reason to prefer it to Marcott et al (2013):
More illustrative is his Figure 3:
Note that the statistical distribution of potential holocene temperatures tails out at 1.5 C above the 1961-1990 baseline, or 1.86 C above a 1880-1909 baseline. Unlike the reconstruction, the statistical distribution of realizations does not have a low resolution. Ergo, we can be confident from Marcott et al that it is extremely unlikely that the Earth has faced temperatures exceeding 2 C above the preindustrial average in the last 100 thousand years.
Further to my preceding post, here are Ljungqvist 2011's land and ocean proxies, annotated to show latitude bands. First land:
Then Ocean:
I have also realized that proxies showing temperatures between -1 to +1 C of the preindustrial average are not shown in Ljungqvist 2011 Fig 3, and are never less than about 20% of proxies. As they are not shown, their impact cannot be quantified even intuitively from that figure suggesting inferences to global temperatures from that figure would be fraught with peril, even if the proxies were geographically representative.
angusmac @29... Your quote from Ljundqvist is not is disagreement with anything we're saying here. At ~1°C over preindustrial we have brought global mean surface temperature back to about where it was at the peak of the holocene. That statement in Ljundqvist does not in anyway suggest that 2°C is unlikely be a serious problem.
Look back at your PAGES2K chart @20. There's one huge difference between the peak of the holocene and today, and that's the rate at which the changes are occurring. That is the essence of the problem we face. It's less about relative temperature and more about the incredible rate of change and the ability of species to adapt to that change.
Human adaptability is one of the keys to our success as a species. Physiologically, we would have the capacity to survive whatever environment results from our activities. But the species we rely on for our sustenance, not so much.
A change in global mean temperature of >2° is very likely to produce some pretty dramatic climatic changes on this planet right about the time human population is peaking at 9-10 billion people. Feeding that population level with frequent crop failures and any substantive decrease in ocean fish harvests is likely to cause very serious human suffering.
Rob Honeycutt @24, there are three "huge differences" between the current warming and the HTM.
First, as you mention, the rate of temperature change is much faster, with temperatures expected to increase in a century or two by the same amount it took 8000 years to increase leading into the HTM (and hence time frames in which species must migrate or evolve to adapt being much smaller).
Second, humans have a much more static, industrialized society making it difficult or impossible for populations to pick up and move to more friendly conditions. The extensive agricultural, road and rail networks place similar restrictions on adaption by migration of land animals and plants.
Third, Global Warming is just one of three or four major stressors of nature by human populations. Because of the additional stresses from overpopulation, over fishing, cooption of net primary productivity, and industrial and chemical waste, the population reserves that are the motor of adaption for nature just do not exist now, as they did in the HTM. AGW may well be the 'straw' (more like tree trunk) that breaks the camel's back.
Absolutely, Tom!
All of these combined also become a big multiplier effect on socio-political stresses.
Tom Curtis@27 & KR@28
Referring to your request that I clarify the sense in which I mean that the MWP was global, I thought that I had already done this in angusmac@12 & 20 but I will repeat it here for ease of reference.
My definition of the global extent of the MWP was summarised in Section 5.3.5.1 of AR5 which states that, “The timing and spatial structure of the MCA [MWP] and LIA are complex…with different reconstructions exhibiting warm and cold conditions at different times for different regions and seasons.” However, Figure 5.7(c) of AR5 shows that the MWP was global and (a) and (b) show overlapping periods of warmth during the MWP and cold during LIA for the NH and SH.
Figure 5.7 WG1 AR5
Additional information on the global extent of the MWP is shown graphically by the paleoclimatic temperature studies highlighted in Figure 1 below.
Figure 1: Map showing Paleoclimatic Temperature for the MWP (Source: Google Maps MWP)
The following colour codes are used for the studies highlighted in Figure 1: red – MWP warming; blue – MWP cooling (very rare); yellow – MWP more arid; green – MWP more humid; and grey – no trend or data ambiguous.
The map in Figure 1 was downloaded from this Google Maps website. The website contains links to more than 200 studies that describe the MWP in greater detail. Globally, 99% of the paleoclimatic temperature studies compiled in the map show a prominent warming during the MWP.
[JH] You have been skating on the thin ice of excessive repetition for quite some time now. Please cease and desist. If you do not, your future posts may be summarily deleted.
angusmac - While that map (generated by Dr.s Lüning and Vahrenholt, fossil fuel people who appear to have issues understanding fairly basic climate science) an interesting look at the spatial distribution of selected proxies, there is no time-line involved in that map, no indication of what period was used in the selection. No demonstration of synchronicity whatsoever. Unsurprising, because (as in the very recent PAGES 2k reconstruction of global temperature):
As to IPCC AR5 Chapter 5:
You are again presenting evidence out of context, and your arguments are unsupported.
---
But this entire discussion is nothing but a red herring - again, from IPCC AR5 Ch. 5, we have a fair bit of knowledge regarding the MCA and LIA:
Whereas now we have both external forcings (generally cooling) and anthropogenic forcings, with the latter driving current temperature rise. In the context of the present, a globally very warm MCA and cold LIA would be bad news, as it would indicate quite high climate sensitivity to the forcings of the time, and hence worse news for the ongoing climate response to our emissions. I see no reason to celebrate that possibility, let alone to cherry-pick the evidence in that regard as you appear to have done.
angusmac... The conversation has also veered well off course for this comment thread. You should try to move any MWP over to the proper threads and keep this one restricted to baselining of preindustrial.
I have responded to Angusmac @37 on a more appropriate thread.
[PS] thank you for cooperation. Would all other commentators do likewise please.
Rob Honeycutt@39 & Tom Curtis@32
Rob, I agree that the conversation has veered off course for this comment thread but I do wish to make the following comments regarding Marcott et al (2013) that are relevant to baselining preindustrial temperatures:
Tom, I had thought that the uptick at the end of the Marcott et al reconstruction would provide a good correlation with instrumental temperatures but Marcott et al stated that their 1890-1950 warming was “probably not robust.” If it is not robust then why show it?
Further research indicated that there had been criticism of the paper, which resulted in a Q&A blog by Marcott et al in RealClimate which stated that, “the 20th century portion of our paleotemperature stack is not statistically robust, cannot be considered representative of global temperature changes, and therefore is not the basis of any of our conclusions.”
“Not robust” is an understatement when you compare Figure S3 from Marcott et al (2013) with Figure C8 in Marcott’s PhD thesis (2011). This comparison shows that there are differences in the two reconstructions in general and, in particular, the last 500 years shows completely different results. For example, there is an uptick in Figure S3 in the 2103 version and no uptick in Figure C8 in the 2011 versions (see Figure 1).
Figure 1: Extracts from Figure S3 (Marcott et al, 2013) and Figure C8 (Marcott, 2011)
A difference of approximately 0.8 °C in the two versions of the reconstruction is presented in Figure 1 – yet they use the same proxies. Marcott et al do not address this significant difference by their “not robust” statement.
Regarding the criticism of their paper, it is very unusual to address such criticism in a weblog, as done by Marcott et al. It is normal scientific practice to address criticism in clarifications/corrigenda to the original paper in the pertinent journal because this allows a technical audit on the veracity of the paper. Not having done so certainly casts doubt on the robustness of the last 500 years of the reconstruction and perhaps even the entire paper.
In light of the above discrepancies in Marcott et al (2013), I would not recommend it as a reasonable paleo reconstruction.
angusmac @41, I am not going to respond formally to your post until it is clear that it will not be deleted for its rather egregious posting under the wrong topic. If it is so deleted, by all means repost in on the correct thread. If you feel there is some part of the discussion that asolutely belongs on this thread, you can then link to that repost and highlight briefly only what is relevant, and why it is relevant to the OP here.
I will note that it is extraordinary in science to only make criticism on weblogs (which is where you will find the criticism of Marcott et al), and to expect a more formal response by Marcott without demanding a more formal critique by the science assassins "climate auditors" represents a stunning hypocrissy.
[PS] Can I suggest that any discussion relating to Marcott et al be conducted in this thread? I dont intend to delete the angusmac comment since it obviously involved some effort to construct and isnt totally offtopic, but I would appreciate responses in more suitable threads.
As per the moderators suggestion, I have responded to angusmac across three posts elsewhere. I will make one point in response here, however, because it gets to the core of why angusmac raised HCO temperatures on this thread in the first place. To recap, angusmac argues that the MWP temperature should be used as the "preindustrial temperatures" for reasons sufficiently refuted above. His reason for doing so comes down to his opinion that, "...“1.669 °C” above the 1961-1990 mean [and MWP temperatures] ... does not sound nearly as bad as 2 °C". This in turn is related to his belief that "... many parts of the world exceeded the 2 °C limit [in the HCO] without any dangerous consequences and that these temperatures occurred when CO2 was at ≈ 280 ppm". The idea is that if 1.67 C above the 1961-1990 mean is not bad, then neither is 0.75 C (2015 average, HadCRUT4) and neither is 2 C above the preindustrial average. Ergo, rebaselining the 2 C guidline is justified to make that intuitively obvious.
Marcott 2013 allows us to see how flawed that intuition is.
Specifically, Marcott adds random variability to the stack of reconstructions used in the paper to make the annual scale variability of the reconstructions match actual annual scale variability. The result is an increase of 0.13 C to the standard error. It follows, that if we add 0.13 C to the standard deviation of the mean of the stack for each 20 year period in the full reconstruction, we get a good approximate measure of the potential range of annual temperatures for that 20 year period. Note that due to autocorrelation, if temperatures are low for a given year in a 20 year period (or century), in a specific member of the stack, they will not be high within that 20 year period (or with slight qualification, within that century). But because we do not know which member of the stack most closely approximate reality, the statistical data form all stacks gives us our best approximation of the temperature range. From that in turn we can calculate an approximate probability of a particular temperature in any given year:
The chart shows the probability of a given temperature (specified by year) in any given year over the Holocene. The green line shows the probabilty of 1.5 C over the 1961-1990 mean. It is consistently zero. Even 2015 tempertures are shown to be relatively rare in the HCO, though 2000-2009 temperatures were commonplace.
More interestingly, we can calculate the probability of those temperatures being reached at least once, in any year over a given period. For the period 5500-9500 BP, it is a near certainty that even 2015 temperataures will have been reached at least once. There is, however, only a 2% chance that temperatures reached 1.5 C above the 1961-1990 at any time in the HCO. The chance that it reached 2 C above preindustrial for even a single year is negligible.
It can therefore be seen that angusmac's assumption that high temperatures were commonplace in the HCO is simply false. We are very nearly at the upper limit of HCO temperatures. Nor is his assumption that HCO temperatures were always beneficial justified. Indeed, given that almost all agriculture was invented between 30 degrees North and 30 degrees South (and all was invented between 40 north and 30 south), and given that temperatures in that latitude zone have actually increased since the HCO, his assumption of beneficial effect is very shaky indeed.
Finally, for completeness, the probability of 1990-2009 twenty year average temperatures of the 950-1900 preindustrial baseline is 0.6%. The probability of 1996-2015 twenty year average temperatures of the 950-1900 baseline is just 0.03%. So much for natural variability being the cause.