


 Arguments


Recent Comments
Prev 501 502 503 504 505 506 507 508 509 510 511 512 513 514 515 516 Next
Comments 25401 to 25450:
-
MA Rodger at 08:27 AM on 17 June 2016Venus doesn't have a runaway greenhouse effect
KR @123.
The Nikolov and Zeller poster is not entirely make believe. Their initial modelling of a planet with zero GH-effect is correct but is so silly with its assumptions I wasn't bothered to look further into their arguments. So I cannot speak for how bad the rest of it is.
That initial model in 2.1A is for a planet with its day-side locked to always face the sun. The average temperature will thus be a little over half the black body temperature. And this should not be a great surprise; with its dark side permanently unheated, half the planet has a temperature effectively at absolute zero. Smith (2008) helpfully have done these sums & show the effects of rotation & thermal inertia.
-
scaddenp at 07:32 AM on 17 June 2016Venus doesn't have a runaway greenhouse effect
Gee, I am surprised this rubbish keeps coming up, when it was laughed at even in "skeptic" circles. You might like to read what Roy Spencer has to say on the subject as I suspect you would trust that source rather than "warmistas" here or say physics textbooks. This has come up here before and even our friend Camburn wouldnt buy it. If you think this is plausible, then I think he has a bridge he would like to sell you.
-
william5331 at 06:10 AM on 17 June 2016New study finds evidence for a 'fast' dinosaur extinction
Pretty convincing. The Iridium data from his site would be pretty well the clincher.
-
knaugle at 05:53 AM on 17 June 2016Development banks threaten to unleash an infrastructure tsunami on the environment
Consider that there is some thought that Biscayne Bay area of Miami will be uninhabitable in 30 or 40 years because of rising sea levels and the rather porous substrate. Yet right NOW there is a building boom. Why? I've read that it's because developers calculate that it takes 20 years for them to turn a profit and they will be long gone before it's a problem.
So the question is. Did I get this right? Or am I making it up? -
Alexandre at 04:18 AM on 17 June 2016Development banks threaten to unleash an infrastructure tsunami on the environment
There's a hydroelectric dam here in Brazil that's been a long controversial issue. It's the Belo Monte Dam, that is on a flat land in the middle of the Amazon forest, and therefore needs a large flooded area for a relatively small amount of electricity generated.
Even before the present political crisis (president Rousseff is in the middle of an impeachment process), the environmental issues were quite low down the priority list: the minister who was responsible for the dam was one of the few overt climate denialists in Brazilian politics.
-
KR at 03:02 AM on 17 June 2016Venus doesn't have a runaway greenhouse effect
That Nikolov and Zeller poster, not to mention the related Hockeyschtick blog post, could best be summarized as:
"We didn't like GHG physics, so we made up our own."
In short, utter nonsense. If you want actual physics, I would suggest reading the quite approachable Pierrehumbert 2001 article, "Infrared radiation and planetary temperature".
-
MA Rodger at 02:46 AM on 17 June 2016Venus doesn't have a runaway greenhouse effect
Mike Hillis @121.
You are incorrect in presenting that link to a denialist webpage while proclaiming "The greenhouse effect doesn't explain why .... . This does:" The link you provide offers no explanation but rather presents unsubstantiated assertion spruced up with a couple of sweeps of Ockham's broom. The nonsense is explained however (as much as such things can be explained) by Nikolov and Zeller's 2011 conference poster.
-
dvaytw at 00:40 AM on 17 June 2016Temp record is unreliable
Thanks guys. Scaddenp, I looked up the Monte Carlo method, but that stuff is way over my head. The main issue of the guy you suggested is being willfully-ignorant (I agree) is that he doesn't see how a single fact about the past can be expressed as a probability. He quoted the definition of probability to me:
A number expressing the likelihood of the occurrence of a given event, especially a fraction expressing how many times the event will happen in a given number of tests or experiments.
and asked how such an expression could fit the definition. I suggested to him that here, "probability" means something like, 'given similar amount and kinds of evidence plus measurement uncertainty, if we ran the calculation multiple times, what percentage of the time would the calculation be correct'. Is this basically right?
-
Mike Hillis at 23:20 PM on 16 June 2016Venus doesn't have a runaway greenhouse effect
The greenhouse effect doesn't explain why the dark and sunlit sides of Venus are the same temperature, and why the poles are as hot as the equator. This does:
http://hockeyschtick.blogspot.com.au/2016/06/new-paper-demonstrates-gravito-thermal.html
Venus is not like earth, in that its atmosphere directly absorbs sunlight on the way in, via the H2SO4 clouds. That heat absorced by H2SO4 is transferred to the surface via the gravity pump described here.
The reason the temperature everywhere on Venus is the same is, gravity is the same all around Venus.
-
Glenn Tamblyn at 18:41 PM on 16 June 2016The Grand Oil Party: House Republicans denounce a carbon tax
Just throwing in my two-penn'th worth.
Cap and Trade has one really good feature and one really bad feature.
Cap is good because it is directly targetting what we need to do - capping emissions. Carbon taxes in contrast don't actually target that. They put a price on emissions and basically hoe that will achieve the effect of a cap.
Trade, not so good. In the simplistic world of economists, trade, markets etc produce 'efficiency'. Often this efficiency doesn't actually translate to social utility. And there is one key problem. A lot of very smart people get up every day to strive as hard as they possibly can to subborn the market, twist it, break it to their advantage. Trade is probably just a huge 'employment opportunity' for financial engineers.
The idea of making any approach revenue neutral is sounc. Cap and Dividend, conceptually seems the right approach. Cap gives certainty and Dividen makes it revenue neutral.As to using regulation, there are good arguments for regulations, highly targetted, in very specific contexts. They actually need to be simple regulations, targetting key industry sectors. Two key ones:
- Electricity generation. We don't need masses of regulations, just some simple rules and clarity.
- Fuel Efficiency standards. By simply saying that vehicle efficiency standards need to rise steadily, ultimately they are saying a switch to non fossil fuels is needed. Petrol to Hybrid to Electric delivered via an indirect measure. Unleash the California Air Resources Board (CARB) to set standards for California, and that becomes the defacto standard for the US, which then becomes a defacto standard for the world. CARB has done this before.
-
Tom Curtis at 10:19 AM on 16 June 2016The Grand Oil Party: House Republicans denounce a carbon tax
CSM @16, with respect, the US does not have a significant debt crisis. The measure of whether or not your debt is unmanagable is your ability to pay of the interest, which is currently 223 billion US dollars (6% of the Federal budget). That is an affordable amount, and just paying of the interest will result in a 2-3% decrease in the debt/GDP ratio per annum on average based on economic growth. If most of the debt is in US dollars, inflation will decrease the real value of the debt even quicker.
The US is portrayed as having a debt crisis by comparing its national debt to its national income. However, for private corporations and individuals, the comparisons made are total debts to total assets (the later typically being ten times the value of income); or of repayments to income (where the former need only include interest repayments). The use of debt to GDP comparisons represents a double standard. If applied to industry, for example, it would require that businesses by wound up if their debt exceeds their income, which would be ridiculous.
The US does need to balance its budget, but it needs to do so in a way that will keep the budget balanced in the long term and over the course of the economic cycle. Temporary budget measures are not the way to achieve that, and certainly a measure which is designed to decrease its revenue to zero over time will not achieve that except temporarilly. Further, if it is revenue neutral, it will not accomplish that in any event.
What using such a measure to balance the budget would achieve, however, is to generate a long term structural need to decrease revenue or reimpose other taxes. As we can see the US Congress's inability to do either, it achieves a structural pressure generating future deficits.
If you want to pay down US government debt quickly, you would be far better of imposing a temporary Tobin tax, (or as a tobin tax is a good idea in any event, a temporary Tobin tax surcharge).
-
scaddenp at 10:08 AM on 16 June 2016The Grand Oil Party: House Republicans denounce a carbon tax
"This means balancing the budget on average; i.e., surpluses during boom years and balanced budgets on average years."
Here in NZ, this is called the Fiscal Responsibility Act 1994
I think a lot of nations should try it. *smug*. Cant help myself.
-
CSM at 09:31 AM on 16 June 2016The Grand Oil Party: House Republicans denounce a carbon tax
@Tom Curtis: I respectfully disagree. We have 19 TRILLION dollars in debt and the Baby Boomers are starting to retire! If a carbon tax produces a temporary surge in revenue, so be it. We need some temporary surpluses to offset 80+ years of crises. I would use some of the revenues as a citizen dividend just to keep a carbon tax from being too regressive.
And for the record I am a smaller government guy. I usually vote Libertarian. But I do believe in paying for the government we have, and the government we had. Even with a half trillion dollar cut in annual spending, we still could use some tax increases.
General environmental note: if you desire a future where progress means more leisure vs. more environmentally degrading stuff, you want an economy that doesn't require ongoing artificial stimulus. This means balancing the budget on average; i.e., surpluses during boom years and balanced budgets on average years.
-
Tom Curtis at 09:07 AM on 16 June 2016The Grand Oil Party: House Republicans denounce a carbon tax
knaugle @14, IMO the opposite is the case.
Carbon taxes should be imposed on the fee and dividend basis because, by their nature, they are intended to dry up over time. Ideally, within 34 years, a carbon tax will provide zero revenue to government because we will have zero net emissions. If the carbon tax is not distributed back to the populace on a fee and dividend basis, that means the service it funds will have had its revenue dry up. In a worst case scenario, the tax will have been used to widely replace income and/or sales taxes which would then of necessity need to be reimposed gradually over time to replace the diminishing return from the carbon tax, with the consequent political battles to do so, both in elections and in the legislature. The most likely outcome would be a dimishment of general revenue, and hence of government services.
Ergo, to keep government services well funded, carbon taxes should be revenue neutral on a fee and dividend basis, or at worst used for short term, non-ongoing measures that will accelerate ending carbon dependence in the economy. (Note that ongoing subsidies of renewables does not fall into this category, for the funding of such subsidies must be drawn from general revenue as the carbon tax dries up, again creating a potential budget crisis.)
-
knaugle at 08:06 AM on 16 June 2016The Grand Oil Party: House Republicans denounce a carbon tax
Regarding #1
It's off topic, but "revenue neutral" is to me more a policy decision to appease those who prefer to avoid sound budgeting and oppose most taxes in general and on principle. Considering that sound budgeting takes into account how much the government needs to spend and where it gets the money, locking down the argument like this paints the government into a corner where it cannot really raise revenue, nor can it cut spending.
What is on topic is that carbon taxes and cap-&-trade have worked in other arenas (like Acid Rain) and it confounds me why suddenly these are so very off the table within USA conservative dogma.
-
scaddenp at 08:04 AM on 16 June 2016The Grand Oil Party: House Republicans denounce a carbon tax
CSM, those are all good points. I am actually in favour in carbon tax, and your argument further convinces me of its merit.
In my defense, I will say that NZ had a 10-year moritorium on building new thermal generation from 1998-2008, during which geothermal and wind generation capacity significantly expanded. Investment in new generation (of any kind) has slowed since it was removed but other factors are at play as well.
-
william5331 at 06:37 AM on 16 June 2016Study: Most fossil fuels unburnable without carbon capture
It is pretty clear that Carbon capture is not on. I've seen estimates that you have to burn 30% more carbon to catch and store the Carbon dioxide. That is just silly. We would use all the renewable energy we have developed and then some to store the carbon from our coal fired power plants. Equally clearly, a huge step would be to transition to electric cars as fast as possible while balancing our grids with demand balancing rather then supply balancing. However, going out on a limb a bit here, we see that the Northern Hemisphere Atmospheric CO2 levels go up 8 and down 6 each year. Clearly, the natural systems have a huge ability to suck up carbon. We would be far better advised to facilitate all these systems including some we could tweak. For instance, we could burn all wood waste for energy only to the charcoal stage and incorporate all the charcoal into our soil. We could reforest, cutting down the trees at the appropriate stage to be built into long lasting buildings, furniture and so forth. We could adopt agricultural methods that increase the organic content in soils (which we have depleated over the years with chemical fertilizers) and we could rewild large areas both in the sea and on land and simply leave them alone. Oh, and we could insist on spreading the beaver throughout our catchments and leaving them to get on with saving our sorry selves from ourselves. We might even sink whaling ships (after removing the crews). Look at Monbiots TED talk to get an idea how much carbon they can remove from the atmosphere. At the very bottom of all this is one common problem. We have to get big vested interest money out of politics all over the world and especially in America. We could have had Bernie but that looks to be over now. We have blown our best chance and it may be too late. Have you seen the Carbon increase from April to April in the Mana Loa web site. 4.16ppm. We may have already passed the point of no return. Our carbon output didn't go up last year and yet we have this jump in atmospheric CO2.
-
CSM at 00:55 AM on 16 June 2016The Grand Oil Party: House Republicans denounce a carbon tax
scaddenp, your proposal is the sort of bad environmentalism that makes the economically literate go anti-green. What you propose will cause electric companies to hold on to old inefficient power plants and for people to hold onto old cars.
It is cheap and easy to build a car that cuts CO2 emissions by 70% right now. Look at the Elio Motors commuter vehicle as an example. Your proposal gives zero incentive for such quick and easy solutions. A carbon tax encourages both quick fixes now and research into better long term solutions.
We do not need to eliminate hydrocarbon fueled vehicles. We need to reduce the need for hydrocarbon fuels to the point that biofuels suffice. Economically, this is a HUGE difference. Diminishing returns and all that.
-
José M. Sousa at 23:02 PM on 15 June 2016Study: Most fossil fuels unburnable without carbon capture
"Sustainable Gas Institute"? Well it seems they aren´t impartial here; they have a hard stake in the matter.
-
dvaytw at 19:12 PM on 15 June 2016Extreme weather isn't caused by global warming
BOOM!!! Direct hit!!! THAT'S what I'm talking about, guys!!! Thanks!!!
-
william5331 at 19:10 PM on 15 June 2016The Grand Oil Party: House Republicans denounce a carbon tax
To be really effective, you want the tax to be returned in equal portion to every citizen. Since that may be difficult, send it to every registered tax payer instead but not by cheque. Send it by virtually free electronic transfer to the same account that you would send a tax rebate. Do not use it to reduce income tax. It is far more impressive to actually get a positive entry in your bank account.
-
scaddenp at 12:58 PM on 15 June 2016The Grand Oil Party: House Republicans denounce a carbon tax
Those are very good arguments Greg. Border adjustment is a bit of an administrative nightmare (and cost) but I agree that if USA did it, then it would force rest of world along that route as well.
If you want simple, administrative cost-free however, then two regulations would do it;
1/ No new CO2-emitting power plant to be built from now on.
2/ No new CO2-emitting vehicles to be allowed from 2030.
While free of an bureaucratic costs, they do not address the issue of imported emissions (and international competitiveness) so I still think you need the border adjustment.
-
One Planet Only Forever at 12:11 PM on 15 June 2016Study: Most fossil fuels unburnable without carbon capture
BHHY, A minor clarification of your view. The ones wanting personal reward from throwing gas on the house on fire are not going to bring their fire extinguisher. They expect someone else to develop the fix for the problem they want to enjoy making bigger.
-
greg4green at 11:41 AM on 15 June 2016The Grand Oil Party: House Republicans denounce a carbon tax
One of the best arguments I've ever heard for a carbon tax (and so many of its benefits*) is from Rex Tillerson, CEO of ExxonMobil. He even calls it a "refundable GHG emissions fee."
* Benefits he covers:
► revenue-neutral; does not grow deficit
► transparency and predictablility are good for business (uncertainty is bad for business)
► simpler and more transparent (and thus more 'honest') than cap & trade
► refund protects low-income Americans
► border adjustment protects American industry (This also helps proliferate similar plans, which is CRUCIAL. Just remember, "America is not a Planet." Thx, little Marco!)
► small-government / reduces need for regulations
► zeroing-out subsidies will eliminate picking winners and losers (consistent w/conservative economic principles)
► much more efficient than complicated gov't regulation
► less expensive because it's more direct, eliminates transactional costs
I might be missing something but I think he pretty much covers the bases.Let me just put it another way. Anybody who supports the status-quo of big, top-down gov't regulations, subsidies (gov't picking winners & losers), and the complex game of tax incentives — Band-Aids to make up for a broken market, simply DOES NOT get to call himself/herself a PRINCIPLED CONSERVATIVE. What they are is a fair-weather socialist, perfectly fine with privatizing profits but socializing costs when it works in their favor. They're an unprincipled, dishonest, opportunist — a thief who is stealing from the future, selling in the present, and calling it GDP.
-
BBHY at 11:33 AM on 15 June 2016Study: Most fossil fuels unburnable without carbon capture
The same folks who tell us renewables are too expensive keep pushing CCS. I would be very surprised if the cost of CCS isn't 10 to 20 times more expensive than simply using renewable energy instead.
The way I view this:: The house is on fire (global warming). The guys who keep pouring ever more gasoline on the fire, (the fossil fuel industries) are telling us to not worry because they have a small, handheld fire extinguisher, (CCS), and if we just allow them to keep pouring more gasoline on our burning house for a few more years, (or decades), they will eventually use their small, ineffective fire extinguisher to put out the fire (promise!).
-
John Hartz at 04:19 AM on 15 June 2016Extreme weather isn't caused by global warming
dvaytw @85:
You may also want to recommend that your debating partner check out the recently released report, Attribution of Extreme Weather Events in the Context of Climate Change, National Acadamies Press.
The report was authored by the Committee on Extreme Weather Events and Climate Change Attribution; Board on Atmospheric Sciences and Climate; Division on Earth and Life Studies; National Academies of Sciences, Engineering, and Medicine.
Description
As climate has warmed over recent years, a new pattern of more frequent and more intense weather events has unfolded across the globe. Climate models simulate such changes in extreme events, and some of the reasons for the changes are well understood. Warming increases the likelihood of extremely hot days and nights, favors increased atmospheric moisture that may result in more frequent heavy rainfall and snowfall, and leads to evaporation that can exacerbate droughts.
Even with evidence of these broad trends, scientists cautioned in the past that individual weather events couldn't be attributed to climate change. Now, with advances in understanding the climate science behind extreme events and the science of extreme event attribution, such blanket statements may not be accurate. The relatively young science of extreme event attribution seeks to tease out the influence of human-cause climate change from other factors, such as natural sources of variability like El Niño, as contributors to individual extreme events.
Event attribution can answer questions about how much climate change influenced the probability or intensity of a specific type of weather event. As event attribution capabilities improve, they could help inform choices about assessing and managing risk, and in guiding climate adaptation strategies. This report examines the current state of science of extreme weather attribution, and identifies ways to move the science forward to improve attribution capabilities.
-
CSM at 01:29 AM on 15 June 2016The Grand Oil Party: House Republicans denounce a carbon tax
I've been trying to make the case for a carbon tax to conservatives and libertarians for a dozen years now. See here. It's an uphill battle. Groupthink has set in. Methinks it would take a new green-conservative party to open minds.
Given how the Republican Party is experiencing a hostile takeover from what was the Reform Party (and earlier, the American Party), a conservative realignment may well happen.
Some kind of greening of the political right needs to happen before the Too Old to Care Generation dies off. Single party government is not good.
By the way, the commentary about Exxon's endorsement of a carbon tax is the same type of argument I hear on the Right about government scientists and global warming: scientists get paid to stir up panic, so they do. Ignore evidence. It's all about class consciousness and incentives.
Be careful.
-
Tom Curtis at 01:11 AM on 15 June 2016Extreme weather isn't caused by global warming
davytw @85, for precipitation, extreme events are typically defined in terms of the return interval for a certain amount of precipitation over a given time period. Consider the following examples of return intervals from four meteorological stations in South West Western Australia:
The charts show the one day rainfalls for various return intervals for data from 1930-1965 (black) and 1966-2001 (red). A return interval of 0.1 means, approximately, that you would average 10 such events a year. A return interval of 50 means that, on average you would experience only 1 such event every 50 years. You may not think of an event with a return interval of 0.1 years as an extreme event, but it means that the chance of experiencing such a rainfall event on any given day is 2.74%, ie, well within a 5% threshold, and almost within a 2.5% threshold. Of course, such events are not likely to cause anything more than local flooding if that - but they have the great virtue of being sufficiently frequent as to lend themselves to statistical analysis of changes in the return interval.
You can see that above. For return interval below 0.5-1 (depending on the station), there are statistically significant changes in the return interval for a given quantity of rainfall. Above that, even though the rainfall events become more extreme, because they become rarer the change ceases to be statistically significant, at least for individual values.
These charts show a decline in return interval, ie, a lower frequency of extreme rainfall events and hence likely a lower frequency of local or more extreme flooding. As this is for South West Western Australia, climate models predict such a reduction as a result of global warming (with a consequent increased frequency of drought); although the paper from which this analysis comes attributes it to other causes.
A similar calculation could be done for Sydney, and would be done by the same methods. Problems do arise. The return interval for very high rainfall events (>100 years) are predicted from best fit curves such as shown on those graphs. They are, however, unreliable.
The Brisbane region, for example, has experienced at least 4 extreme rainfall events with a purported return interval >500 years in the last 150 years, most recently in the 2011 flood. Two of those events were in the 1890s, and it is possible that two such events occurred within weeks of each other in the 1890s. Clearly the best fit curve is not a reliable predictor at the top of the range. The 2011 flood was unique among these events on a number of grounds, including that it occurred at the time of the greatest flooding of Queensland by arial extent on record, it occurred in the run down from an El Nino (with the second greatest flooding of Queensland by extent occurring earlier the previous year in El Nino conditions). All, or nearly all other major floods in Brisbane have been associated with La Ninas. Further, it occurred without the involvement of any cyclone, unlike the others among the 4 or 5 rainfall events with >500 year notional return intervals, which all occurred when a cyclone, or the remnants of a cyclone tracked along the South East Queensland coast (either just off shore as in 1974) or in the Brisbane valley as in other occasions. Naturally, these unique features suggest global warming was a significant factor in the size of the flood; but because of the low return intervals (notional or actual), that cannot be shown statistically. That is why studies of extremes in precipitation concentrate on the much lower impact, higher return rate events.
-
dana1981 at 00:38 AM on 15 June 2016The Grand Oil Party: House Republicans denounce a carbon tax
This was just a blanket anti-carbon tax Resolution. I think many have long suspected that Exxon's carbon tax support is just lip service while they work against the policy behind the scenes.
-
Tom Curtis at 00:35 AM on 15 June 2016Extreme weather isn't caused by global warming
John Hartz @86, I find the IPCC glossaries sufficiently exact and easy to access. In the case of "extreme weather event", so also did meteoterm:
"extreme weather event
SOURCE:
IPCC 4th Assessment Report, WG 1 Glossary
RELIABILITY:
Verified
DEFINITION:
An extreme weather event is an event that is rare at a particular place and time of year. Definitions of rare vary, but an extreme weather event would normally be as rare as or rarer than the 10th or 90th percentile of the observed probability density function. By definition, the characteristics of what is called extreme weather may vary from place to place in an absolute sense. Single extreme events cannot be simply and directly attributed to anthropogenic climate change, as there is always a finite chance the event in question might have occurred naturally. When a pattern of extreme weather persists for some time, such as a season, it may be classed as an extreme climate event, especially if it yields an average or total that is itself extreme (e.g., drought or heavy rainfall over a season).
DEFINITION SOURCE:
IPCC 4th Assessment Report, WG 1 Glossary" -
John Hartz at 00:30 AM on 15 June 2016Extreme weather isn't caused by global warming
dvaytw @85:
In my opinion, the World Meterological Organization (WMO) sets the "gold standard" with respect to meterological terms. You can access the definition of "extreme weather" and other terms by going to the WMO's Metroterm* webpage.
*METEOTERM is WMO terminology database. It contains specialized terminology in six languages: Arabic, Chinese, English, French, Russian and Spanish. It includes the International Meteorological Vocabulary, the International Glossary of Hydrology and terms from related sciences that appear in WMO documents.
-
dvaytw at 22:57 PM on 14 June 2016Extreme weather isn't caused by global warming
Thanks, Tom. I appreciate the immense patience you folks have with my endless queeries. Your answer is very informative, but can you help me with a specific point? The guy has this inane idea that extremes are defined nowhere in the literature. He asks,
"So, what is the threshold variable for extreme rain events in Sydney? How would that be calculated?"
Can you answer this, or at least point me to a definition of "extreme rain" in an individual study? It sounds ridiculous, but he seems to think this is all just smoke and mirrors. I want to point him to something very concrete and graspable. -
denisaf at 20:37 PM on 14 June 2016Climate scientists have warned us of coral bleaching for years. It's here
Many Australians are now resisting the establishment of a coal mine in Queensland that will export coal to India as this acivity will add to the problems harming the Great Barrier Reef.
-
tmbtx at 17:24 PM on 14 June 2016Trump and global warming: Americans are failing risk management
The comic has too many low risk examples. There's not a small chance the house will burn down - we've thrown a party with 20 toddlers and are letting them all play with lighters.
-
Tom Curtis at 13:45 PM on 14 June 2016Most of the last 10,000 years were warmer
I am unsure Mike Hillis what point Hillis is arguing with respect to the GISP2 d18O proxy. Is it that it represents "much of the world's climate", or that it represents Northern Hemisphere temperatures, or that it represents North Atlantic temperatures. Whichever is the case he is shown to be wrong by the ice core records. Consider for example the difference between GISP2 and Guliya (from the Tibetan plateau) as shown in this graph of various polar and tropical ice cores:

It is quite clear that if either is representative of the Northern Hemisphere, then both should be highly correlated given that both are NH ice cores. But clearly they are not. Ergo neither is reprentative of NH temperatures. Still less are either representative of "much of the world's" temperature.
By similar reasoning, neither can GISP2 be representative of North Atlantic temperatures. Here are the Holocene d18O records of six Greenland ice cores:

As all draw their precipitation from the North Atlantic, if all represented North Atlantic temperatures they would by isomorphic. Again, clearly they are not, having distinctly different holocene slopes and inflection points. In particular DYE-3 shows a warming trend through the Holocene, while Agassiz and Renland show a more rapid cooling trend. Camp Century warms until 5-6 thousand years before 2000 AD, while the other records show much earlier (although not synchronous) inflection points.
A similar point can be made from the famous Global Warming Art Graphic:

The wide divergence of shapes of the curves preclude any from being a proxy of global temperature except on the coarsest of resolutions. However, even the GISP2 (light blue), North Atlantic sediment core (specified as yellow, but which I see as a very light lime green), and European pollen data (orange) show distinctly different shapes, even though all are Northern Hemisphere records, and all are significantly influenced by North Atlantic temperatures.
Part of Mike Hillis' problem is that North Atlantic temperatures do not vary synchronously. While one part of the NA may be warming, another may be cooling As the precipitation on Greenland comes from a small part of the North Atlantic, not the whole of it; that means Greenland ice cores can only represent the temperature of the whole of the North Atlantic, but only small parts of it. In the case of GISP2 and GRIP, zone of the North Atlantic from which precipitation is drawn varies, shifting to a more southerly (and distant) location when the North Atlantic Oscillation is negative. That means the GISP2 record cannot even be of a single region within the NA (based on Hillis's suppositions), but from two different locations with distinct mean temperatures, leading to an exagerated temperature seesaw based on changes in the NAO.
Further, even close locations such as GISP2 and GRIP (just 28 kms apart) show variations in the detail of the d18O record (See figure 3 here). This may not be due to site specific factors, however. Of five ice cores from the GISP site, the cross correlations over the period 1770-1987 show a high value of 0.552 and a low value of 0.464 (Table 1 here). GISP2 shows a correlations ranging from 0.408 to 0.549 to those GRIP cores. Interestinly White et al show the highest correlation with the mean of the 6 stacks to be with the mean of the coastal temperature record, with a correlation of 0.471 (Table 2, above link). The individual isotope records have correlations ranging from 0.172 to 0.502 (mean: 0.363, data from Table 1). For comparison, there is only a 0.279 correlation to the annual NAO index. The later suggest to me that temperatures over the Greenland Ice Sheet are a more significant factor in the d18O record then are sea surface temperatures at the site of evaporation, although that is still a significant factor.
-
sauerj at 13:44 PM on 14 June 2016The Grand Oil Party: House Republicans denounce a carbon tax
KR @5, Thanks again! ... Well put! Hansen calls it 'greenwashing'. With some of their shareholders publicly speaking up, there are some signs of hope.
-
scaddenp at 12:15 PM on 14 June 2016Most of the last 10,000 years were warmer
And if are dO18 values of -25 to -45 in greenland ice core are supposed to be representative of NH, then how are these values (-6.8 to -8.6) in Fig 1B in this paper of dO18 measurements from Central Alps not also representative?
-
KR at 11:16 AM on 14 June 2016The Grand Oil Party: House Republicans denounce a carbon tax
Sauerj - Exxon talks a great talk, but they don't walk the walk. I suspect much of their underemphasized position on carbon taxes boils down to PR, rather than actual intention.
-
sauerj at 09:43 AM on 14 June 2016The Grand Oil Party: House Republicans denounce a carbon tax
KR @2, Thanks! ... But, ExxonMobil has publicly unequivocally stated they support a carbon tax (not sure if they distinguish between rev-neu or not). My assumption was that they would support anything that puts the economic burden, by all industries, on a level playing field (which a carbon tax would). Why would they care if FF products are burdened? Could they not invest in renewables as much as the next guy? Heck they could maybe buy out the entire renewable industry if they wanted.
Is ExxonMobil saying one thing, but secretly telling politicians the opposite? I know I'm naive, but I have trouble believing that ExxonMobil execs would purposely lie boldly that much. Something tells me to give them more credit than that.
-
sauerj at 09:29 AM on 14 June 2016The Grand Oil Party: House Republicans denounce a carbon tax
One more question: Do you know if there was any discussion (in session) to tailor the wording of this resolution (by either party member) so to ONLY target NON-revenue neutral taxes? Hopefully so.
It would be heartening to know if at least an attempt was made (by someone) to specifically keep the rev-neu option available. If the ratified resolution had been worded like this, then this would have been a nod of acceptance toward the rev-neu option.
-
KR at 09:25 AM on 14 June 2016The Grand Oil Party: House Republicans denounce a carbon tax
Sauerj - I'm afraid given the sponsorship by fossil fuel interested that the push is against any pricing of externalities whatsoever. And given the current influence of big money on US politics, I don't see any forthcoming effort by Congressional Republicans to do anything sensible.
-
sauerj at 09:17 AM on 14 June 2016The Grand Oil Party: House Republicans denounce a carbon tax
A Few Questions: Did the resolution distinguish the difference between revenue-neutral & non-revenue neutral tax? And, thus leave a door open for the GOP to accept a revenue-neutral tax?
If no distinction was made, then was this 1) by accident (maybe not knowing the difference) or 2) was this detail proposely left 'in the dark' so to cleverly lump rev-neu taxes in with the same anti-tax politics as the non-rev neu taxes? And, thus cleverly poison rev-neu tax initiatives from gaining any further ground.
Regardless of this resolution, do you think the GOP members will still have enough political freedom to move toward the 'light' of the rev-neu initiatives, OR do you think this resolution will have enough political grip to stall both CCL lobby attempts & the growth of the BCSC for at least the next 12 months (next congress)?
The article questions if the BCSC members who are GOP are not really serious and may only be members to put on a show, so to pick up more middle-ground voters in districts where CC sensitivities may be above average. ... The realism of politics can be so depressing.
-
Riduna at 09:13 AM on 14 June 2016Will Fossil Fuel Prices Fully Recover?
As noted in the article, fossil fuels can, to some extent, substitute for each other. The on-going natural gas (methane) glut is expected to result in depressed prices for years to come. This could result in prolonged low price of coal, particularly for electricity generation, resulting in closure of less efficient smaller coal mines.
As an interim measure electricity generators may convert from coal to gas before converting from fossil fuels to renewables – or going out of business as solar develops into a 24/7 reliable and cheaper, source of energy.
-
Glenn Tamblyn at 08:29 AM on 14 June 2016Most of the last 10,000 years were warmer
Mike Hillis
Here is some more info from the same site scaddenp linked to. Interesting stuff. Read particularly the link about deuterium excess.
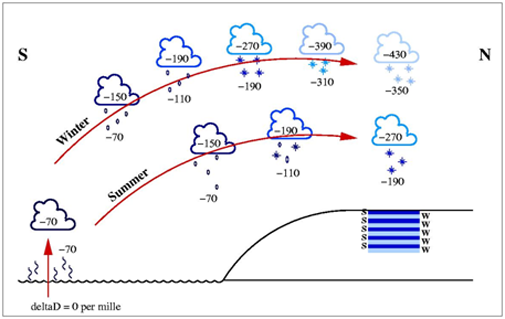
Wikipedia has a brief discussion here.This paper also discusses this and the fact the 18O and Deuterium are well correlated with surface temperatures at the depositing location whereas deuterium excess is correlated with temperatures at the evaporative source.
As the first link points out, D excess actually allowed the glaciologists to detect a transition in the source temperature in the ice core record that occurred within 1-3 years!. This is interpreted as a change in weather patterns so the water was coming from a different location. This rapid transition in the ice core record is actually used as the marker to define the start of the Holocene.
Your point about deposition vs condensation and that thus the main fractionation occurs at the evaporative source seems to be drawing too long a bow. That assumes that the only precipitation that occurs after initial evaporation all occurs as the final fall of snow. When in fact, as the schematic on my first link indicates, precipitation would likely occur at multiple stages over the journey of the moist air mass, much ot it as rain. Hail also would be based on condensation based fractionation. Snow that forms around water droplets would be a compound of deposition and condensation fractionation. Only snow that forms from pure deposition around CCN's woukld be pure deposition fractionation.
So the picture is much more of a hybrid than what you suggest.
With Deuterium excess available to determine the proportion of fractionation due to evaporation, that leaves the pure 18O and deuterium readings available tothen unpack the fractionation that occurs over the journey of the air mass.
Importantly, there is one piece of evidence suggesting ice cores are regional/local not hemispheric, which is average residence time for water in the atmosphere. This is estimated at around 9 days. In contrast intra-hemispheric mixing time - how long air takes to mix around within one hemisphere - is estimated at 1-2 months. This strongly suggests that most evaporated water falls out again on scales below hemispheric. -
scaddenp at 08:19 AM on 14 June 2016Most of the last 10,000 years were warmer
Mike, I am in SH, but I am pretty sure that a temperature range of -10 to -45C determined bydO18 is representative of Greenland and not the NH.
Your assertion that fractionation is primarily at evaporative source does not appear to be supported in literature (here and here for example).
If you have new research that contradicts, then please provide a cite.
-
Mike Hillis at 06:03 AM on 14 June 2016Most of the last 10,000 years were warmer
sacddenp, your link to the graph:
http://www.iceandclimate.nbi.ku.dk/images/images_research_sep_09/GRIP_93_pit.png
shows correlation between Greenland ice core temps and d18O, on a monthly basis. That means higher temperatures in July, for example, than April. This of course applies to everywhere in the Northern Hemisphere.
If the ice isotope proxy corresponds to temps in Greenland, and not everywhere else in the NH, then we can consider it a local proxy. It does not.
Now let's get back to my point about how snowfall results, not from condensation, but rather from deposition, which I point out is a much weaker fractionation force, for the reason I stated, than evaporation/condensation. This means the main fractionation happens at the evaporative source.
-
Tom Curtis at 00:29 AM on 14 June 2016Extreme weather isn't caused by global warming
dvaytw @83, you might find that individual studies use their own statistical cutoff points for what counts as "extreme weather". As the IPCC itself does not do research, they must rely on those studies, and therefore cannot use a specific cut off point, but must rely on those that exist in the literature. If you look at Box 3.1 in the SREX, the IPCC says:
"A large amount of the available scientific literature on climate extremes is based on the use of so-called ‘extreme indices’, which can either be based on the probability of occurrence of given quantities or on threshold exceedances (Section 3.1.2). Typical indices that are seen in the scientific literature include the number, percentage, or fraction of days with maximum temperature (Tmax) or minimum temperature (Tmin), below the 1st, 5th, or 10th percentile, or above the 90th, 95th, or 99th percentile, generally defined for given time frames (days, month, season, annual) with respect to the 1961-1990 reference time period. Commonly, indices for 10th and 90th percentiles of Tmax/Tmin computed on daily time frames are referred to as ‘cold/warm days/nights’ (e.g., Figures 3-3 and 3-4; Tables 3-1 to 3-3, and Section 3.3.1; see also Glossary). Other definitions relate to, for example, the number of days above specific absolute temperature or precipitation thresholds, or more complex definitions related to the length or persistence of climate extremes. Some advantages of using predefined extreme indices are that they allow some comparability across modelling and observational studies and across regions (although with limitations noted below). Moreover, in the case of observations, derived indices may be easier to obtain than is the case with daily temperature and precipitation data, which are not always distributed by meteorological services. Peterson and Manton (2008) discuss collaborative international efforts to monitor extremes by employing extreme indices. Typically, although not exclusively, extreme indices used in the scientific literature reflect ‘moderate extremes,’ for example, events occurring as often as 5 or 10% of the time. More extreme ‘extremes’ are often investigated using Extreme Value Theory (EVT) due to sampling issues (see below)."
This does not mean that "extreme values" are not precisely defined in original research. Nor does it mean the IPCC treats the issue imprecisely. However, to not overstate the case, they cannot use a precise common definition where one does not exist in the literature. What they do do is take the relative rigour of the statistical cut offs used in individual studies in weighing the evidence from the literature.
As noted on the bottom of the quoted section above, there are often very good reasons for the different cutoffs in different studies. Specifically, if the phenomenon in question has a limited data set, using a 2.5% cut off may result in insufficient data for normal statistical methods. EVT can be used in these cases sometimes, but is not as robust. Droping the cut off may allow the scientists to note, and discuss changes in frequencies that actually exist even when the change is not yet robustly detectable in "extreme extremes".
On top of that, some events are extreme events, and known to be extreme events even when no precise statistical criteria is defined. An example is any hurricane/cyclone/typhoon. Any such is an extreme event with regard to wind speed, and probably precipitation and storm surge as well. To expect the IPCC's discussion of extreme events to exclude all cyclones except the 5% of strongest cyclones would be absurd, but the statistical cut off based just on wind speed for cyclones will not be precisely known (even though clearly it will meet any reasonable such cutoff). The IPCC definition, by not specifying precise values allows discussions of the frequencies and strengths of all cyclones (and tornadoes, and floods) without arbitrary cutoffs being used to exclude relevant data.
-
dvaytw at 21:24 PM on 13 June 2016Extreme weather isn't caused by global warming
PS - I'm wondering, though: can anyone show me where to find the definition the IPCC uses for actual calculation of its probabilities regarding the contribution of ACC to extreme precipitation? Or if not that, at least, how to find this definition on one particular study of extreme precipitation?
I took Eclectic's point back to the argument, but he maintains that nevertheless a definition must be chosen if calculations are going to be made from it, and this makes sense to me with my child's understanding of the topic, at least.
And in case anyone is wondering, no, I am not a denialist troll trying to covertly advance these arguments myself. Personally I think the argument is ridiculous; I am just trying to solve the puzzle of how to defeat it without simply dismissing it out of hand.
-
MA Rodger at 16:53 PM on 13 June 2016Most of the last 10,000 years were warmer
scaddenp @90,
Your assessment of δ18O data is surely indisputable.
Mike Hillis @89,
I note that unsnipped @89 you restate what I branded @70 as your proposition (E), an unsupported assertion that the climate myth addressed by the OP is no myth. That is you tell us that, apparently, once "everybody knew that most of the Holocene was warmer than today" and add (now snipped) the implication that you believe (why we know not) that they were correct in that erstwhile position. All very "grassy knoll."
On more particular matters, if I read you right, while you said previously "Easterbrook correctly uses it (ie GISP2 ice core δ18O data) as much more than a local proxy, as does Alley," what you now mean is that "Easterbrook is wrong about the GISP2" and that Alley, who doesn't actually agree with Easterbrook's use of theGISP2 ice core δ18O data after all. is also himself wrong as he is happy to see the GISP2 ice core δ18O data as “a local record“ of temperature at “one site,” an idea that you brand as being “utterly and stupidly wrong.” So you thus presently consider that they are both utterly wrong. (I'm not sure if the use of adjectives “utterly” and “stupidly” are intended to have meaning or have purely an expletive role as you are on record informing the world that “wrong and utterly wrong are the same thing.”) Whatever, both Easterbrook & Alley are now wrong but for different reasons.
Instead, we now have a replacement for your now-defunct proposition (G) which is:- (H) “One thing we do know is that NONE of the moisture that falls on Greenland comes from Greenland, so it (ie. GISP2 ice core δ18O data) is anything BUT a local proxy.” That is, you are saying the data does not provide a record of the site's temperature history. Noting the comment @90, best of luck with that.
-
scaddenp at 09:51 AM on 13 June 2016Most of the last 10,000 years were warmer
I would say dO18 as a local temperature measurement is well established in theory and in measurement. See here especially the figure comparing dO18 temperature to Greenland temperature.
Prev 501 502 503 504 505 506 507 508 509 510 511 512 513 514 515 516 Next


