


 Arguments


Record hot 2015 gave us a glimpse at the future of global warming
Posted on 25 January 2016 by dana1981
2015 smashed the record for hottest year by about 0.14°C. To put that into perspective, the previous two hottest years (2014 and 2010) only broke the prior records by 0.002°C, according to Berkeley Earth data. The only time the temperature record was shattered by such a large margin was in the monster El Niño year of 1998.
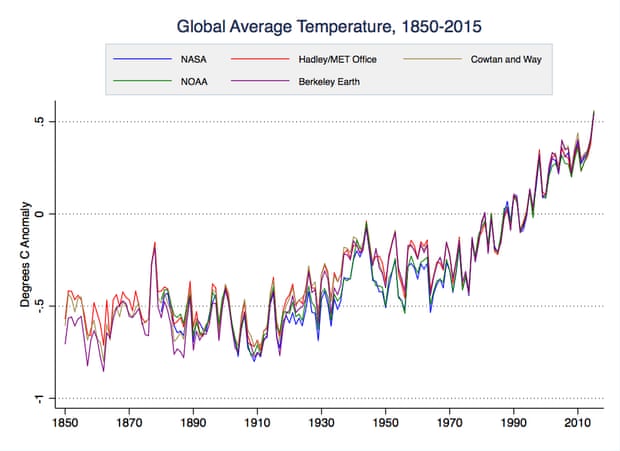
Various global surface temperature datasets, 1850–2015. Illustration: Zeke Hausfather
While the current El Niño event is also becoming monstrously strong, it’s only now reaching its peak intensity, and there’s an approximately 4-month lag before changes in El Niño are reflected in global surface temperature changes. Thus, the El Niño of 1998 had a greater warming influence than its 2015 counterpart. 2015 was nevertheless more than 0.2°C hotter than 1998, due to human-caused global warming.
As the animated graphic below shows, there’s a consistent warming trend among El Niño years, La Niña years, and neutral years. Over the past 50 years, there’s a 0.16°C per decade trend among each category, and individual years fall close to those trend lines. That underlying human-caused global warming trend is what’s causing annual temperatures to so frequently break records, with 4 new record-hot years in the past decade.
Berkeley Earth average global surface temperatures since 1965 categorized by type of El Niño year. Illustration: Dana Nuccitelli
As NASA GISS director Gavin Schmidt said,
The El Niño that we’re seeing is starting at the end of 2015, and so there hasn’t been enough time for that to really have an impact on the annual mean temperatures. So 2015 was warm even though there was an El Niño, and it would’ve been a record year even if you abstract out the El Niño affect, 2015 would’ve been a record warm year by a long chalk.
And due to the aforementioned lag, 2016 could be even hotter yet. Prof Adam Scaife, head of long-range forecasting at the Met Office, said in an interview with Carbon Brief,
Given the strength of the current El Niño, we expect 2016 to be even warmer globally than 2015. The lagged effects of El Niño are already starting to appear in the monthly temperature observations, which are registering more than 0.8 degrees above norm in recent months. This is consistent with our forecast for unprecedented warmth in the coming year. Overall, we expect El Niño to contribute around 25% to what will most likely be a new record global temperature in 2016. Much of the rest is down to climate change.
If 2016 breaks the temperature record yet again, it will be the first time in the past 150+ years that three consecutive years set a new annual global temperature record.
What about the satellite data?
Contrarians have responded to the news of record-shattering 2015 temperatures by noting that in the satellite data, it was only the third-hottest year on record in the lower atmosphere. There are two main reasons for this. First, atmospheric temperatures are more sensitive to changes in El Niño than surface temperatures. As a result, satellites still have 1998 as the hottest year on record, 0.14°C hotter than the second-hottest year of 2010, even though surface temperatures were about 0.07°C hotter in 2010 than 1998, and more than 0.2°C hotter in 2015.
Second, there’s an even bigger lag between changes in El Niño and changes in atmospheric temperatures, where it’s about 6–7 months. Thus the peak temperature influence of the current monster El Niño won’t be reflected in the satellite temperature record until summer 2016. As a result, 2016 is likely to become the hottest year in the satellite record.
However, the surface temperature data are more relevant to humans because they reflect temperatures where we live, and are less uncertain and more reliable than indirect satellite temperature estimates.
How hot are the oceans?
Over 90% of the energy trapped by the increased greenhouse effect goes into warming he oceans. A recent paper led by Peter Gleckler at Lawrence Livermore National Laboratory estimated that the oceans have been building up heat at a rate equivalent to 4 Hiroshima atomic bomb detonations per second since 1998. That’s over 2.3 billion atomic bomb detonations worth of heat building up in the oceans over the past 17 years.
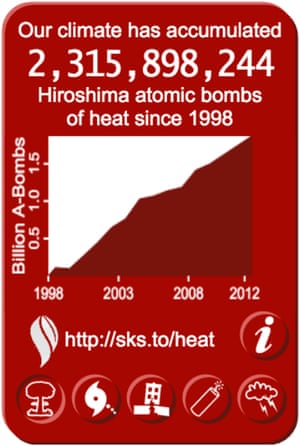
Widget counting global heat accumulation, up to 2.3 billion atomic bomb detonations since 1998. Illustration: 4hiroshimas.com
During that time, the oceans accumulated as much heat as they did during the previous 130 years, with 2015 reaching record levels.
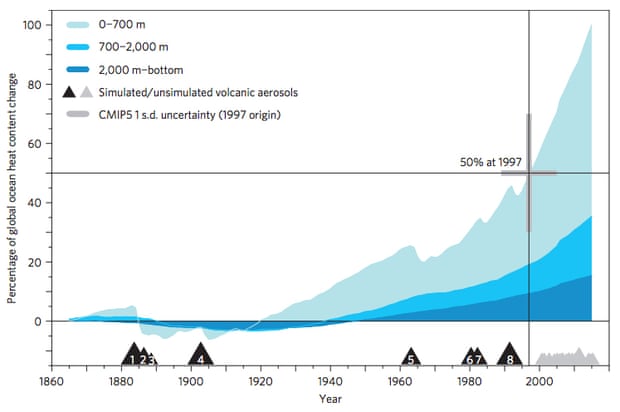
Ocean heat uptake as a percentage of 1865-2015 change for CMIP5 model average. Large grey cross indicates that 50% of the total uptake occurred in 1997. Source: Gleckler et al. (2016). Illustration: Nature Climate Change
In fact, research by Kevin Trenberth and colleagues suggests even this is an underestimate, and that from 1992 to 2005 the oceans built up heat at a rate of 6 atomic bomb detonations per second. Trenberth believes many other studies have underestimated the rate at which the southern hemisphere oceans are warming.
Previous estimates of ocean heat content change have been too conservative in the changes in the southern hemisphere. The absence of data does not mean absence of warming. Several estimates then use zero change in those regions. By better assessing what changes are likely in the no-data regions, based upon the regions where there are data, the ocean heat content changes increase.
Encouragingly, on average, climate models are nailing the increase in ocean heat content quite accurately.
What happened to the ‘pause’?
As the above ocean heat content chart shows, the overall heating of the planet never paused or even slowed down. The warming of surface temperatures did briefly slow, due to a period with more La Niña than El Niño events since the turn of the century. However, with the apparent return of more El Niño events, global surface temperatures are surging, and it’s hard to even see the slowdown anymore.
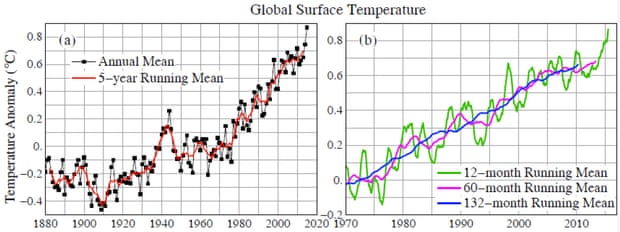
NASA GISS global surface temperatures. Right frame shows smoothing over various time periods. Illustration: James Hansen.
This argument is now relegated to the satellite temperature data, which have greater uncertainty, are more influenced by El Niño events, and diverge from direct weather balloon atmospheric temperature measurements.
For the global climate as a whole, there wasn’t even a warming slowdown (in fact it’s accelerated, as the Gleckler paper shows), and surface warming only temporarily slowed and is now speeding up again.
A glimpse at our hot future
As Trenberth wrote, the record heat that we’re seeing now will soon become the norm.


So because of this El Nino created jump in the temperature,we can expect another "hiatus" starting in 2017. The climate change deniers can have fun with this one. They can now start their graphs in 2015 and at least for a few years explain to us how the climate is cooling. That is, unless we have passed one or more of the tipping points and 2017 turns out to be warmer than 2016.
I like the quote at the end from Trenberth. Perhaps the best way to communicate this result, besides saying it's really warm and this warmth is having big negative consequences, is to predict when this global surface anomaly will become "normal". That is, how many years is this year's anomaly ahead of the long-term trend (say, 1970-2014 ... don't want to cherry-pick a biased end date). At about 0.15 C increase per decade, and 2015 being about 0.14 C warmer than 2010 and 2014 (with 2014 being approximately on the trendline?), then we should expect 2015 temperatures to be "normal" by about 2025.
Is this correct? On average we should expect to see years like 2014-2016 by 2024-2026? I think this also says that it would be abnormal to see another year so warm before then, and it would be really weird to see several more than one of them. Perhaps this kind of messaging to the media would help to avoid wasteful discussion of a new hiatus in the next decade.
Ah, I see by following the link to the Guardian, Trenberth indicates it would be 15 years before we could expect to frequently see anomalies such as observed in 2015.
Dana, in the extended section of the OP, it is claimed that El Nino, neutral and La Nina years all have the same trend of 0.16 C per decade. That claim is belied by the graph, however, were the slope of the trend line for neutral years is visibly less than that of El Nino and La Nina years, and where pixel count shows the trend lines for El Nino and La Nina years draw apart, showing the El Nino trend to be greater than the La Nina Trend. Could you note the exact values.
Steve L @2&3, calculating the trends for La Nina, Neutral and El Nino years seperately on the BEST LOTI (Sea Ice as Air Temperature) since 1966, it turns out that 2015 will be the average temperature for an El Nino year in 2018, for a neutral year in 2023 and for a La Nina year 2028. The precise year estimated will depend on the temperature set used, and the ENSO index used (I just used the classification in Dana's graph below).
That means that within three years, we can expect the average El Nino to match 2015 temperatures, with El Nino's occuring every three to four years on average. Put another way, by 2028 we can expect to have experienced five or so years approximately as hot as 2015, and likely one or two hotter.
I should note that in answering Steve L's question @5, I answered by own question @4. The trends are by my calculation:
La Nina years:0.156 C/decade
Neutral years: 0.152 C/decade
El Nino years: 0.163 C/decade
Talking about ocean heat content directly after saying the temps where we live (surface) are more relevant is a small hiccup in the flow of the argument. Neglecting uncertainty in OHC directly after mentioning that factor to favour the surface records over lower trop also popped out.
barry @ #7 . . . sorry, Barry, but your comments are so brief that they don't make much sense on their own.
Please expand your comments, so that I and other readers can understand whatever the message is (which you wish to convey) .
Also, in passing, perhaps you could mention how you think the "lower trop" [as you quote it] has relevance to the so-called surface air temperatures at ground level & sea-surface level. ( I confess that ) my initial impression is that the "lower trop" as measured by satellites, gives a mass-weighted average roughly at 3 kilometres above ground level ~ something which, like stratosphere temperatures, is interesting yet of tenuous connection with what's happening on land and sea, where we inhabit the planet.
barry,
Though your question is unclear I will offer something that may relate to your concern.
There is a connection between the surface temperature and ocean heat content.
I am not a climate scientist. I am science trained as an Civil Engineer with an MBA, but I have only followed this topic out of the need to better understand the potential impacts on my designs such as location specific maximum snow load, maximum wind speed, maximum rain intensity, maximum wave height.
Tha said, my understanding is:
When ocean circulation conditions produce a larger than average cool surface, such as a La Nina condition in the Tropical Pacific or similar conditions in other ocean areas, the interaction of the ocean surface with the atmosphere will keep more heat energy in the ocean than a neutral condition.
When ocean circulation conditions produce a larger than average warm surface, such as a El Nino, the interaction of the ocean surface with the atmosphere will keep less heat energy in the ocean than a neutral condition.
Some of the heat energy from the ocean surface interaction stays in circulation in the lower atmosphere (below the elevation of the typical 25,000 to 50,000 foot elevation zone of satellite temperature evaluation) and spreads around the planet temporarily affecting the global average surface temperature (cooler than neutral state during La Nina, warmer than neutral state during El Nino).
Another thing is going on. The ocean will take a very long time to reach a new heat content balance state with the recently rapidly warming global surface. And when conditions are more predominantly La Nina than El Nino (as they had been since 1998) the global surface temperature would not appear to be warming relative to the spike of 1998. However, during those times the rate of ocean heat capture would be even more rapid than during ENSO Neutral or La Nina conditions.
Barry,
I mistated my last sentence. Should have been "... more rapid than during ENSO Neutral or El Nino conditions."
Also, though I started following this subject because of Civil Engineering interest and concern, my concern has grown regarding the mechanisms and motivations behind the denial of the developing better understanding and the changes required (my MBA training). Hence my interest in this site and other groups focused on better understanding what is going on and determined to get the required changes of understanding and action to happen sooner rather than later (it will never be too late, but sooner is clearly better).
Recommended supplementary reading...
Analysis: How much did El Niño boost global temperature in 2015? by Roz Pidcock, Carbon Brief, jan 26, 2016
Eclectic, OPOF,
I wasn't asking a question, I was commenting on the flow of argument in the article - on the juxtaposition of two points and selective reference to uncertainty. Perhaps it would have been clearer if I'd referred to the "OP." I'm sure Dana would have got it. I was unsure if feedback is welcome but went ahead anyway.
Unless the readership is only the two climateball tribes, choosing what to omit when summarizing science is a tricky business, especially if you want to be persuasive. As I'm fairly well-informed about climate science and a critical reader, I mentioned two things that jarred for me. Others will not notice or care.
OPOF,
Hence my interest in this site and other groups focused on better understanding what is going on and determined to get the required changes of understanding and action to happen sooner rather than later
Our interests are similar. Communicating the science honestly and effectively is important. If there were a blog dedicated to effectice communication of science I would probably participate. Obviously, it is of considerable interest for the authors here.
The Debunking Handbook
(Actually, I think a semi-open forum to discuss effective communication of (climate) science is a good idea. Maybe there is one somewhere. The topic comes up on the blogs fairly regularly, including here, but doesn't survive long. How about a dedicated thread, mods?)
On the animated gif, the changing Y-axis for the neutral and el nino years is making my (figurative) neckbeard all incredibly itchy, and I find it visually very distracting.
You shouldn't be changing the scale between graphs.
I was interested to see if 2015 would be a record year within or without statistical (/structural) uncertainty. The UK Met Office has 2015 as a clear record-breaker even with the 95% uncertainty interval.
www.metoffice.gov.uk/news/releases/archive/2016/2015-global-temperature
NOAA also have a clear record-breaker.
www.ncdc.noaa.gov/sotc/global/201513
Whereas GISS have 2014 at top rank with "94% certainty."
www.giss.nasa.gov/research/news/20160120/
What is the confidence interval for GISS 2015 global?
0.87C +/- (?)
Slip of the finger:
- Whereas GISS have 2015 at top rank with "94% certainty."
barry@13,
I am still developing my thoughts on all of this. But basically, I support Skeptical Science remaining focused on the development of more understandable presentations of Climate Science related to Global Warming impacts of human activity.
What is becoming very clear to me is that the real problem to address requires more than just Skeptical (Climate) Science. Other sites similarly Skeptical are required for the other fields of science that are not being effectively developed and understood by the global population because, like climate science, the developing better understanding is undertood to likely be contrary to developed popular, profitable interests and contrary to unsustainable perceptions of prosperity that have developed.
In addition to the variety of Skeptical Science, there needs to be Skeptical Politics and Skeptical Economics.
What all of the Skeptical groups would have in common is the need to address misleading marketing.
Skeptical Marketing would be a common interest of all of the topic specific Skeptical groups. It would develop better awareness and understanding of how 'specific people' among us deliberately abuse misleading marketing to get away with developing and prolonging cheaper and quicker more damaging ways of living and getting what 'they want' even if it is able to be understood to not contribute to developing a lasting improvement for all of humanity.
It is important to get to the root of the problem which is identifying specific people and how they choose to behave. Skeptical Science does this related to climate science.
One of the most distrurbing developments due to the power of misleading marketing is the formation of powerful partnerships of callous greedy and intolerant people who work very hard at getting what they want any way they can get away with, including striving to get just enough electoral influence to get their type of people elected on election day, or to get elected people who dislike them to support their unacceptable desires because of the real fear of not being re-elected (that is the worst result because it can force an elected member to support a decision they understand is unacceptable because it may allow them to 'do other good things', like Democrats elected in Coal regions supporting Coal lobby interests so they can remain elected). And carefully timed effective misleading marketing is a key to the unacceptable success of these groups that likely fully understand the unacceptability of their pursuits.
Misleading Marketing (selective presentation of appealing claims, or totally false claims that will work because of a scientifically understood emotionally trigger) is a very well developed science. Misleading Marketing is far more popular, prevelant and successful than honestly and most fully informing others. And the damaging results of its success are clear, including the way it will produce worse results in a Freer socio-economic environment.
Misleading Marketing Science is the science most deserving of a Skeptical focus.
Barry,
In addition to my previous post the misleading marketing related to climate science is not just misrepresentation of the best understanding.
The fight against the developing better understanding of climate science started with efforts to keep the topic from becoming a topic that the general population was aware of. Many powrful wealthy people aware of the issue deliberately did not promote public awareness of the issue.
Another related aspect of misleading marketing related to climate science is attempts to divert attention to other 'human activity that could be blamed'. Population is one of the marketing diversionary tactics I have seen. People claim that the global populaton is the problem. Of course the real problem is the portion of the population with the highest per-capita impact. If the population is reduced without any reduction of the highest impacting portion of the population nothing would be accomplished.
A further misleading activity realted to climate science is efforts to claim that economically the costs faced by a current generation of humanity to stop cuasing challenges for future generations is 'accounted' to be more than the costs incurred by future generations. That economics through the generations is obviously a dihonest way of evaluating acceptability. It is like saying you can do something you believe gives you $1000 of personal benefit as long as the cost to your neighbour, as you figure it, is less than $1000.
Of course, another misleading marketing tactic against climate science awareness and required action is the creation of 'larger issues to be focused on' such as Terrorism. That tactic presumes that multiple issues cannot be concurrently addressed, and it ignores the reality that the socioeconomics and politics that are increasing the climate change problem are also creating a more significant terrorism problem.
Tom - yes, the neutral trend is 0.15°C per decade. It would have been more accurate to say 0.15–0.16°C per decade, but given the uncertainty involved, 0.16°C is close enough.
barry - sure there's uncertainty in the OHC data, and there's also a massively large trend.
lamont - yeah, the axes shouldn't have changed. Excel was acting up on me in the neutral graph, and that slipped past me. Annoying. I blame Bill Gates.
OPOF,
Loth to keep posting off-topic, this is my last one.
SkS, I think, is doing what Steven Schneider said he was doing.
On the one hand, as scientists we are ethically bound to the scientific method, in effect promising to tell the truth, the whole truth, and nothing but — which means that we must include all the doubts, the caveats, the ifs, ands, and buts. On the other hand, we are not just scientists but human beings as well. And like most people we'd like to see the world a better place, which in this context translates into our working to reduce the risk of potentially disastrous climatic change. To do that we need to get some broadbased support, to capture the public's imagination. That, of course, entails getting loads of media coverage. So we have to offer up scary scenarios, make simplified, dramatic statements, and make little mention of any doubts we might have. This 'double ethical bind' we frequently find ourselves in cannot be solved by any formula. Each of us has to decide what the right balance is between being effective and being honest. I hope that means being both.
Most climate change blogs, including SkS, are involved in advocacy. The difference between SkS and, say, WUWT, is that SkS articles are more soundly rooted in the science, reflecting the mainstream view, whereas WUWT almost always distorts or muddies. Where both are similar is that they are have an agenda. That's not a criticism, nor is it controversial. John Cooke once posted his reasons for SkS, and they are not too dissimilar from your own interests.
Science and advocacy are poor bed-fellows. Science rests on a non-biased approach, advocacy is the opposite. I've no doubt the authors here sweat over that friction.
I'm a long-term reader here, pretty much since the blog started in 2007. I've noticed the scales tip slightly towards advocacy, where SkS was a bit more neutral back in the day - the agenda was always there, but content included more scientific uncertainty and deference to future research bringing different results etc. On rare occasions this view prompts me to post, as I did upthread. I want SkS to be effective as well as honest - I'm kind of attached to it. Usually I say nothing because I don't want to dilute the messaging, for anyone who reads down the comments. But I think SkS would be more effective if content was more like it was of old: uncertainties mentioned, alternative views discussed without being dismissive (not fake skeptic views, though), and, like you often see in conclusions of peer-reviewed papers, acknowledgement of or calls for future research changing of refining understanding.
Of course, I may not be like the target audience. Perhaps most people are swayed by a more authoritative tone, but I find a balanced inclusion of such caveats more convincing - more trustworthy. And, re my first point (flow of argment), I want SkS to advocate as effectively as possible at the same time. On the posibility that I'm typical of the target audience, I posted my first comment; feedback on presentation of the argument.
Enough off-topic from me.