


 Arguments


Recent Comments
Prev 504 505 506 507 508 509 510 511 512 513 514 515 516 517 518 519 Next
Comments 25551 to 25600:
-
sidd at 15:55 PM on 13 January 2016NASA study fixes error in low contrarian climate sensitivity estimates
doi: 10.1038/ncomms10266 is a nice paper on the effects of clouds in Greenland preventing refreeze and ratcheting up melt, especially since firn is full. The paper illustrates that clouds have a spatial, temporal, ocean and many other fingerprint, and averaging these effects would mislead. -
Tom Curtis at 10:07 AM on 13 January 2016Why is the largest Earth science conference still sponsored by Exxon?
ryland @26, Yes or No: Government funding has not distorted the results of climate science, merely enabled its existance.
If no, in what way did it distort the science, and where is your evidence of that? If yes, what was your point in posting - and why have you not made it clear that you think there is no distortion from the funding before now?
Moderator Response:[PS] Ryland appears to be attempting offtopic commentary. DNFTT.
-
Rik Myslewski at 09:28 AM on 13 January 2016Surface Temperature or Satellite Brightness?
Thank you for the excellent, clear, and concise article. I've been trying to wrap my head around the uncertainties of satellite versus surface temperature readings, and thanks to you that wrapping is approaching, oh, let's estimate about 270º ± 5º ...
-
rocketeer at 06:42 AM on 13 January 2016Surface Temperature or Satellite Brightness?
I see that Spencer and Christy at UAH have a new (and, I believe, as yet unpublished) version of their satellite temperature record that makes the warming trend go away altogether, at for 2000-present. The are pushing this as an improvment to te earlier version which is used in the Skeptical Science trend calculator (as well as the very similar calculator at Kevin Cowtan's University page). Does anyone have further information on this new version of the data? I had a denier throw this at me with no sense of irony about all the noise being made about the Karl corrections constituting data manipulation. Also, any speculation about why the satellite data shows such a huge peak for the 1998 el nino, much higher than the 2015 el nino despite other evidence that their magnitude is similar?
-
Kevin C at 06:06 AM on 13 January 2016Surface Temperature or Satellite Brightness?
OK, I'll try, but I don't have time to draw the pictures.
Suppose we just have temperature measurements for 2 months. Then the trend is easy: (T2-T1)/t, where t is the time difference between the measurements.
But what is the uncertainty? Well, if the errors in the two observations were uncorrelated, then it would be σdiff/t, where σdiff = (σ12 + σ22)1/2
But suppose the errors are correlated. Suppose for example that both reading have an unknown bias which is the same for both readings - they are both high or both low. That contributes to the error for the two readings, but it doesn't contribute to the trend.
In terms of covariance, the errors have a positive covariance. The equation for the uncertainty in the difference with non-zero covariance is σdiff = (σ12 + σ22 - 2σ12)1/2 where σ12 is the covariance. And as expected, the uncertainty in the difference, and therefore the trend, is now reduced.
Now suppose we have a long temperature series. We can again store the covariance of every month with respect to every other month, and we can take those covariances into account when we calculate the uncertainty in an average over a period, or the uncertainty in a trend. However the covariance matrix starts to get large when we have a thousand months.
Now imagine you are doing the same not with a global temperature series, but with a map series. Now we have say 5000 series each of 1000 months, which means 5000 matrices each of a million elements. That's getting very inconvenient.
So the alternative is to provide a random sampling of series from the distribution represented by the covariance matrix. Let's go back to one series. Suppose there is an uncertain adjustment in the middle of the series. We can represent this by a covariance matrix, which will look a bit like this:
1 1 1 0 0 0
1 1 1 0 0 0
1 1 1 0 0 0
0 0 0 1 1 1
0 0 0 1 1 1
0 0 0 1 1 1But an alternative way of representing it is by providing an ensemble of possible temperature series, with different values for the adjustment drawn from the probability distribution for that adjustment. You give a set of series: for some the adjustment is up, for some it is down, for some it is near zero.
Now repeat that for every uncertainty in your data. You can pick how many series you want to produce - 100 say - and for each series you pick a random value for each uncertain parameter from the probability distribution for that parameter. You now have an ensemble of temperature series, which obey the covariance matrix to an accuracy limited by the size of the ensemble. Calculating the uncertainty in an average or a trend is now trivial - we just calculate the average or the trend for each member of the ensemble, and then look at the distribution of results.
If you want maps, then that's 100 map series. Which is still quite big, but tiny compared to the covariance matrices.
-
shoyemore at 05:16 AM on 13 January 2016Surface Temperature or Satellite Brightness?
Kevin,
Thanks again for a great post. I understand a covariance matrix, can you explain what you mean by an "ensemble of temperatures realisations". Why is that only RSS and HADCRUT have done this? Thanks.
-
Kevin C at 01:22 AM on 13 January 2016Surface Temperature or Satellite Brightness?
Bart: I'm not very interested in behaviour I'm afraid. You are as qualified as me (probably more) to discuss ethics and motivation.
With respect to the UAH data, as far as I am aware they have not presented an analysis capable of quantifying the structural uncertainties in the trend in their reconstruction. However they are working from the same source data as RSS, with the same issues of diurnal drift, intersatellite corrections and so on. While their method might be better or worse than the RSS method in constraining these corrections, in the absence of any analysis I think all we can do is assume that the uncertainties are similar.
Unfortunately uncertainty analysis is hard, and it very easy to do it badly. Given multiple sources of uncertainty analysis for a particular set of source data, in the absence of any other information I would generally trust the one with the greatest uncertainties. It is disappointing that we only have one analysis each of the surface and satellite record for which a comprehensive analysis of uncertainty has been attempted. Hopefully that will change.
-
One Planet Only Forever at 01:17 AM on 13 January 2016Surface Temperature or Satellite Brightness?
No matter how solid the science showing the unacceptability of a potentially popular and profitable activity may be, the ability to deceptively create temporary perceptions contrary to the developing better understanding can be very powerful. Especially if 'fancier more advanced technology' can be used as justification for the desired temporary perceptions.
Many people are clearly easily impressed by claims that something newer, shinier and 'technologically more advanced' is superior to and more desireable than an older thing.
The socioeconomic system has unfortunately been proven to waste a lot of human thought and effort. The creative effort and marketing effort focuses on popularity and profitability. Neither of those things is actually real. They are both just made-up (perceptions that may not survive thoughtful conscientious consideration of their actual contribution to the advancement of humanity).
The entire system of finance and economics is actually 'made-up'. The results simply depend on the rules created and their monitoring and enforcement. And conscientious thoughtful evaluation of whether something actually advances humanity to a lasting better future is 'not a required economic or financial consideration' (and economic games are played by a sub-set of a generation of humanity that in their minds can show that they would have to personally give up more in their time than the costs they believe they are imposing on others in the future. That twisted way of thinking, that one part of humanity can justify a better time for themselves at the expense of others ... taken to the extremes that personal desired perception acan take such thinking, is all too prevelant among the 'perceived winners' of the current made-up game)
That can be understood, especially by any leader in politics or industry. And yet the popularity, profitiability and perceptions of prosperity that can be understood to only be made-up can easily trump the development of better understanding of what is actually going on.
That push for perceptions of popularity, profit and prosperity has led many people be perceive 'technological advancements' to be desired proofs of prosperity and superiority. These unjustified thoughts develop even though those things have not actually advanced human thoughts or actions toward a lasting better future for all life. Those thoughts even persist if it can be understood that the developments are contrary to the advancement of humanity (the collective thoughts and actions), to a lasting better future for all life. And in many cases the focus on perceptions of success can distract or even cause a mind to degenrate away from thoughts of how to advance to a lasting better future for all of humanity.
That clear understanding that everyone is capable of developing is actually easily trumped by the steady flood of creative appeals attempting to justify and defend the development of new 'more advanced and desired technological things' that do not advance the thinking and action of humanity.
So, the most despicable people are the ones who understand things like that and abuse their understanding to delay the development of better understanding in global humanity of how to actually advance global humanity.
The Climate Science marketing battle is just another in a voluminous history of clear evidence regarding how harmful the pursuit of popularity and profit can be. Desired perceptions can trump rational conscientious thought.
Technological advancement does not mean better (the advancement of humanity being better), except in the minds of people who prefer to believe things like that. And such people will want to believe that more ability to consume and have newer more tehnologically advanced things (or simply more unnecessarily powerful or faster things like overpowered personal transport machine that can go faster than they are allowed to safely go in public). They will willingly believe anything that means they don't have to develop and accept the better understanding of how unjustified their developed desired perceptions actually are.
-
Bart at 01:00 AM on 13 January 2016Surface Temperature or Satellite Brightness?
But what about UAH?
Version 6 is a strongly adapted version that shows less warming than before, especially in the past 20 years. The LT trend, according to Spencer, is only 0.11 degrees per decade since 1979, which result in a large gap with 2m observation and also RSS.
I found a comment here, that says, among others, "They [Spencer and Christy] have continued this lack of transparency with the latest TLT (version 6), which Spencer briefly described on his blog, but which has not been published after peer review." and also with respect to TMT: "I think it's rather damning that Christy used the TMT in his committee presentation on 13 May this year. He appears to be completely ignoring the contamination due to stratospheric cooling."
I am interested in you view on this.
Bart S
-
Alpinist at 00:29 AM on 13 January 2016Surface Temperature or Satellite Brightness?
"but it is not our best source of data concerning temperature change at the surface." Which, coincidentally, is where most of us live...
Thanks Kevin for an excellent post.
-
Kevin C at 23:21 PM on 12 January 2016Surface Temperature or Satellite Brightness?
No, I didn't contact any other record providers (although I've talked to Hadley people about the ensemble in the past). As far as I am aware only Hadley and RSS have published the relevant analysis to allow the estimation of structural uncertainty.
Doing so for trends requires either a covariance matrix of every month with every other month (which is unwieldy), or an ensemble of temperature realisations. Fortunately Hadley and RSS have done this - it's a killer feature, and sadly underused - but the other providers haven't.
-
barry1487 at 22:15 PM on 12 January 2016Surface Temperature or Satellite Brightness?
Very useful. TLT and surface records have been much compared and contrasted, with predilections in Climateball fostering tribal affiliations with either. I can't remember seeing a post that laid out the differences in much detail until now.
Were Spencer or Christy approached for input?
-
ryland at 20:47 PM on 12 January 2016Why is the largest Earth science conference still sponsored by Exxon?
No I don't think governments "affect the way science is conducted' but I do think they affect what science is conducted. For example see here and here
Moderator Response:[PS] Your references show governments fund climate science (as they should). So? The problem? From where I sit, I dont see you making relevant comment on this article, but rather attempting to use this forum for political commentary. Plenty of other blogs for this.
-
ryland at 19:04 PM on 12 January 2016Why is the largest Earth science conference still sponsored by Exxon?
In answer to the question from PS@23. The first part of the deleted comment referred to Exxon knowing that many are easily seduced by money. The second part added that governments are aware of this too. My comment @3 made several days ago mentions Exxon fundng both renewables research and campaigns against climate change, I believe the deleted comment added to that.
KR@24 IMO you have no evidence whatsoever for your statements
Moderator Response:[PS] You are still not linking "pork-barrelling by governments" to anything about climate change science. Your personal opinions on the behavour of governments is not relevant to this topic unless you think it affects the way science is conducted.
-
Why is the largest Earth science conference still sponsored by Exxon?
ryland - You're claiming your previous (deleted) comment equating Exxon funding to government funding actually applies to a completely different (not to mention off-topic and completely unmentioned) context? Quite an inventive post-hoc justification, IMO.
Pull the other one, it's got bells on.
-
ryland at 15:00 PM on 12 January 2016Why is the largest Earth science conference still sponsored by Exxon?
I had no hidden agenda at all and certainly not about climate science or scientists. The line "The hardest thing to refuse is money" immediately made me think of porkbarrelling and the way in which Australian governments, at both State and Federal level, hand out tax payers' money to further their own electoral chances. If my comment was taken as "insinuations of fraud or agenda" I think that reflects more on the mindset of the reader than of the writer
Moderator Response:[PS] And the relevance to any part of climate science is?
-
Tracking the 2°C Limit - November 2015
angusmac - "I only stated (and cited references) that showed that temperatures in the MWP were similar to 1961-1990 mean tempratures."
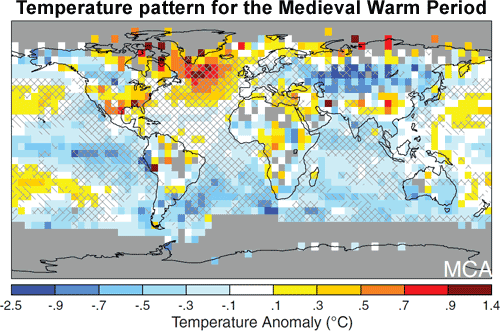
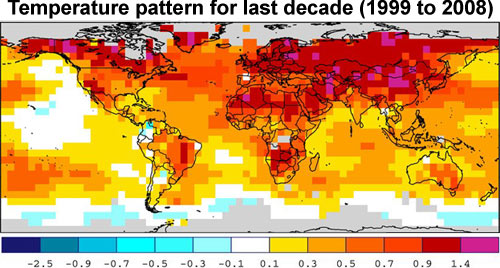
During the Medieval Climate Anomaly, a period of several hundred years, various regions reached temperatures similar to the latter half of the 20th century. But very importantly, not simultaneously - as per the recent PAGES 2k reconstruction:
There were no globally synchronous multi-decadal warm or cold intervals that define a worldwide Medieval Warm Period or Little Ice Age...
[...] Our regional temperature reconstructions (Fig. 3) also show little evidence for globally synchronized multi-decadal shifts that would mark well-defined worldwide MWP and LIA intervals. Instead, the specific timing of peak warm and cold intervals varies regionally, with multi-decadal variability resulting in regionally specific temperature departures from an underlying global cooling trend".
There was no MCA shift in global temperature anomaly comparable to recent changes. This has been pointed out to you repeatedly, with copious documentation by Tom Curtis in particular - your continued insistence on a MCA similar to recent temperatures seems to indicate that you aren't listening to the evidence presented.
-
scaddenp at 14:14 PM on 12 January 2016Why is the largest Earth science conference still sponsored by Exxon?
Ryland - as moderator I deleted a comment which was redolent with trolling and sloganeering. If you actually have something germane to say that is relevant to climate science, then try again - with examples, evidence and why you think what you say is relevant to climate science. Dont bother trolling with subtle insinuations of fraud or agenda.
-
Why is the largest Earth science conference still sponsored by Exxon?
ryland - Ah, implying the old "scientists are willing to lie for the money" canard. I haven't heard that in at least, oh, a week or so. I wonder if that qualifies as "sloganeering"?
Lobbyists who charge by the hour to write in support of CO2, coal, and unbridled fossil fuel use, writings they admit probably won't pass peer review, have nothing in common with academics who submit grant requests in open competition to produce meaningful science.
Professor Frank Clemente, a sociologist from Penn State university, was asked if he could produce a report “to counter damaging research linking coal to premature deaths (in particular the World Health Organization’s figure that 3.7 million people die per year from fossil fuel pollution)”.
He said that this was within his skill set; that he could be quoted using his university job title; and that it would cost around $15,000 for an 8–10 page paper. He also explained that he charged $6,000 for writing a newspaper op-ed.
When asked whether he would need to declare where the money came from, Professor Clemente said: “There is no requirement to declare source funding in the US.”
Yeesh. It's like you're not even trying anymore, ryland.
-
Tom Curtis at 13:27 PM on 12 January 2016Climate denial linked to conspiratorial thinking in new study
chriskoz @54, Sheehan writes:
"The paper was entitled "NASA faked the moon landing – therefore (climate) science is a hoax". The abstract of the study states: "Endorsement of a cluster of conspiracy theories [...] predicts rejection of climate science … This provides confirmation of previous suggestions that conspiracist ideation contributes to the rejection of science."
Note the term "conspiracist ideation". The English language is being brutalised in the social sciences to create a false sense of rigour.
When Jussim checked the data, he found that of the 1145 participants in the study, only 10 thought the moon landing was a hoax. Of those who thought climate science was a hoax, almost all of them, 97.8 per cent, did NOT think the moon landing was a hoax."
(Emphasis mine, elipsis in square brackets mine)
If you look at the underlined sentence, what is claimed by the Lewandowski paper is that:
1) If you are a conspiracy theorist, you are more likely to be a climate change denier.
It does not claim that:
2) If you are a climate change denier, you are more likely to be a conspiracy theorist.
The two claims are quite distinct. One is a particular claim about the population of conspiracy theorists, and makes no particular claim about the population of climate change deniers. The other is a particular claim about the population of climate change deniers and makes no claim about the population of conspiracy theorists.
However, when we look at the evidence presented by Sheehan, it is a statistic about the population of climate change deniers, not about the population of conspiracy theorists. That is, it shows that the data for the Lewandowski "moon landing" paper does not support proposition (2) above. (Actually, it only shows it for a restricted version of proposition (2), as there were a total of 10 conspiracy theories considered by Lewandowski et al.)
For some strange reason, the logician in me wants to insist that refuting 'if B then A' does not refute 'if A then B'. It really does not. Ony those who do not understand the meaning of the word "if" could think otherwise.
So the best that can be said of Sheehan's critique (which he copied of McIntyre, JoNova and a host of other 'skeptical' luminaries) is that he is incompetent at either at logic, or at reading comprehension, or both.
-
owenamoe at 09:10 AM on 12 January 2016Surface Temperature or Satellite Brightness?
Thanks for addressing this issue. Good post.
-
shoyemore at 04:09 AM on 12 January 2016Surface Temperature or Satellite Brightness?

Above is a comparison of RSS with balloon observed RATPAC-A @ 750mb atmospheric pressure in the atmosphere.
Senator Cruz made inaccurate claims about balloon observed temperatures also, as far as I can see.
Excellent post.
-
hank at 03:11 AM on 12 January 2016Why is the largest Earth science conference still sponsored by Exxon?
Those mentioning the 'algae fuel' etc ventures should remember that "teaching the controversy" is done by funding the extreme positions outside the center in all directions. THe tactic is to suck energy out of the political center where actual progress can be made. Fund the extreme "the only acceptable fuel is algae" and "the only alternative is wind" and "the only alternative is solar" while also funding ALEC and the Republicans — pull all the attention away from the moderate possibility of actual agreement.
They have money to try to make puppets of all the activist organizations out there. The hardest thing to refuse is money.
-
Tom Curtis at 19:54 PM on 11 January 2016Tracking the 2°C Limit - November 2015
angusmac @26, saying the MWP is global is ambiguous. Was the GMST durring the MWP warm relative to periods before and after? Yes, and in this sense it is a global event. Were there significant climate perturbances across the globe durring the MWP? Again, yes. And again, in this sense, the MWP was global. Were temperatures elevated in the MWP across most individual regions across the globe? No:
There were areas on increased warmth, and areas of increased cold relative to the mid-twentieth century (1961-1990). So in this sense, the Medieval Warm Period was not global, although the Medieval Climate Anomally was.
In contrast, we truly are seeing global warming currently:
In any event, you would do well to not just assert that the MWP was global (or that it was not), but to clarrify just in which sense you mean that it was global. Failure to do so will only lead to confusion.
With regard to the figure, the source linked by the second link in my post @18.
-
angusmac at 19:03 PM on 11 January 2016Tracking the 2°C Limit - November 2015
Tom Curtis@18
Your post is quite long and detailed. Therefore, I shall respond on a subject-specific basis in individual posts.Meantime, I am pleased that you concur that the MWP was global by citing events in Europe, Middle East, Eastern Africa, South Western United States and Peru. It would probably be worthwhile informing the Moderator at angusmac@10 of the global extent of the MWP.
Additionally, could you give me reference for your Figure 2 so that I may cross-check it?
Moderator Response:[JH] Snark deleted.
-
Glenn Tamblyn at 17:59 PM on 11 January 2016How much does animal agriculture and eating meat contribute to global warming?
Having run a cafe as one of the varied things I have done in my life, learning about food safety is a key need. And all food storage technologies have to deal with two things.
- Spoilage. That is your lettuces wilting. They may not be appetising or very nutritious but that doesn't make them intrinsically dangerous.
- Food poisoning. This is the bad stuff. Essentially bacteria being able to breed on/in your foodstuff to huge numbers. When you consume food that has this issue mostly your digestive system wipes out most of the bacteria. What it can't do is destroy the toxins that those bacteria produced while they were alive. That is what causes food poisoning. Actually getting ill from infection from food is much less common - Travellers Diarhoea (Giardia) for example.
So all storage technologies need to deal adequately with spoilage - dried meat for example is still edible, reasonably nutritious and reconstitutable.
Then they need to dealing with preventing food poisoning which is essential about something that acts as an anti-bacterial. The options are
- Drying. This kills bacteria or sends them dormant. But it can sometimes not be enough. Drying in a hot humid climate is less effective for as long. A little bit of moisture and warmth and the critters are off and running anyway. So drying works best in cold climates or hot dry climates. Mongolia, Nepal, American SW. An adjunct to this (see below) is fatty/oily meats. The fat is also anti-bacterial so this can extend the range where drying works, particularly for things like oily fish.
- Removal of oxygen. Vacuum packing is the modern method but some old storage techniques exclude oxygen
- Heating. Kill the critters.
- Cold. Freeze the critters and they go dormant
- Salting. Salt does bad things to bugs, dessicates them.
- Alkalis and Acids - outside their pH comfort zone they struggle.
- Fats and Oils - these are anti bacterial
- Sugar and Honey, also anti-bacterial.
So bacon (salting), dried and smoked fish, confit duck legs, pickles, chutneys, sauces and jams (thats jelly to you yanks), salami and many sausages (fats & salt), vegetables stored in olive oil, pickled onions, dried corn, dried tomatoes, etc. etc. are all food storage technologies.
Much of what is so wonderful about many cuisines is just a fortunate byproduct of the necessities of storing food before refrigeration arrived.
-
chriskoz at 17:15 PM on 11 January 2016Climate denial linked to conspiratorial thinking in new study
Paul Sheehan on smh commented on Lewandowsky 2012:
Distorted universities need a reality check
quoting the critique by Dr Lee Jussim from Rutgers University. Apparently Jessim "checked the data, he found that of the 1145 participants in the study, only 10 thought the moon landing was a hoax. Of those who thought climate science was a hoax, almost all of them, 97.8 per cent, did NOT think the moon landing was a hoax".
See also here. Jussim talks about "left-wing bias in social psychology". Anyone cares to shed light on that talk by Jussim? How credible are his claims?
-
Tom Curtis at 12:31 PM on 11 January 2016How much does animal agriculture and eating meat contribute to global warming?
Glenn, I more or less agree with everything you write @168, except as regards nomads. Nomads to not typically move continuously. Rather, they will move to a campsite (often frequently revisited), set up camp and stay for a period from a few days to a few months, then move on again. Given that meat can be sun dried in three days, and pemmican made in 3 to 6 weeks, that presents no major obstacle to the manufacture of dried foods. The advantage of the dried food is that it can provide food while on the move, when it is inconvenient to slaughter, or provide food over periods with low fodder (such as winter). The later allows stock levels to be reduced increasing the chance of getting the remainder of the herd through the period of low fodder. Consequently it is no surprise to find that Mongolian cuisine features dried meat, and heavily features 'dried milk' in the form of cheese.
-
Glenn Tamblyn at 11:22 AM on 11 January 2016How much does animal agriculture and eating meat contribute to global warming?
True Tom but there are nutritional reasons 'fresh is best' still applies to some extent where possible. However an important aspect of the 'living food storage' concept links 1 & 2. Animals can harvest low grade land through foraging on it.
However this takes time; it takes time to raise cattle, sheep etc to slaughterable size; time for them to slowly harvest the poor forage that is no use to us. Since we can only incrementally 'harvest' a cow or a chicken each day through milk and eggs as they in turn harvest the land, they act as an temporary storage system for the forage that has already been 'harvested' that we cannot get quick access to - meat. Without that we would get no benefit from having them.
And while there are variious low and high tech food preservation technologies, you then need to physically store the preserved food somewhere. Living storage is a part of the mix. Drying food for example isn't much use to nomadic people if they have to transport all that dried food. Living storage can walk with them as they travel.So what the mix will be at any location depends on local climate, soil fertility etc. technology, culture, all sorts of things. Meat animals are a necessary part of a balanced food supply system, filling in gaps that a pure vegetarian food supply can't.
Feedlots of grain feed cattle just so we can have lots of steaks that are marbled 'just so' aren't. That is a wasteful indulgence.But trying to project a pure vegetarian ideal as some do onto a world that doesn't always have land that can support a pure vegetarian diet is a sentimental indulgence.
-
ClimateBruce at 07:08 AM on 11 January 2016Myles Allen: Can we hold global warming to 1.5°C?
1.5 degrees is technically possible but likely way to costly.
Assuming that we will be able to stabilize the non-CO2 greenhouse gases (CH4, NO2, etc.) at their current levels (because reducing them will be really difficult in a more affluent and more populous world) and assuming that we can eventually phase out coal, it looks to me like we are already close to seeing a 2°C world this century based on current greenhouse gases in the atmosphere (not that 2°C is a meaningful target):
1. The aerosols from burning coal significantly dampen the temperature increase caused by CO2 emissions. According to Dr. Michael Mann, since the burning of coal must be ended to meet any meaningful temperature increase target, a more realistic target of atmospheric CO2 is 405 PPM, which will be reached in a few years (http://ecowatch.com/2015/12/24/dangerous-planetary-warming/2/)
2. We are already at 400 PPM for CO2, 450 PPM CO2e if the Kyoto greenhouse gases are included, and 480 PPM CO2e if all IPCC greenhouse gases are considered (http://globalchange.mit.edu/files/2014%20Energy%20%26%20Climate%20Outlook.pdf
3. The temperature increase at the end of 2015 was about 1.0°C and an additional .1°C increase is expected for 2016. In addition, the aerosols from the burning of fossil fuels are masking another .5°C of temperature increase. And the Earth’s current energy imbalance will likely lead to another .5°C increase over the coming decades based on the greenhouse gases already in the atmosphere. (If we can reach “net zero” anthropogenic CO2 emissions, the oceans will absorb significant amounts of CO2, but this will likely offset by natural emissions from global warming feedbacks (permafrost thawing, etc.))
4. With all of the weird weather that we have been getting from 1.0° C temperature increase and with another .5°C to 1°C “baked in”, it would seem that current atmospheric concentrations of greenhouse gases are already too highIf we are already close to seeing a 2°C world this century based on current greenhouse gases in the atmosphere, then in order to keep the global temperature rise this century to well below 2 °C above pre-industrial levels (per the COP 21 agreement) we need to remove the CO2 equivalent of all future greenhouse gas emissions from the atmosphere.
------------------------------------------------
Greenhouse gas sources and sinks from 2015-2100 (GTCO2e):
1522 - Net of all of the greenhouse gases emitted after 2015, assuming they peak in 2025 and are reduced linearly at 3 percent per year (net zero in 2058) (because we are very close to the atmospheric concentrations of CO2 and CH4 that will result in a 2.0° C temperature increase) (=580+942) (There will likely need to be significant CCS to meet the “net zero” goal, but the associated costs are not included here)
320 - Greenhouse gases emissions from 2058-2100 that need to be captured and sequestered (8*40) (IEA – https://www.iea.org/publications/freepublications/publication/technology-roadmap-carbon-capture-and-storage-2013.html – assumes the annual amount of CCS needed is stabilized in 2050, whereas it is likely to increase)
500 - GHG equivalent emissions from climate feedbacks from 2020-2100 (440 GTCO2e from permafrost and 60 GTCO2e from other sources)
-450 - CO2 absorbed by the oceans from 2050-2100 as net CO2 emissions approach zero. Oceans currently absorb 30-50% of CO2 from fossil fuel emissions (http://www.gdrc.org/oceans/fsheet-02.html). Assuming that there are “net zero” fossil fuel emissions in 2058 and using a 40% absorption rate of 2010 emissions in 2050 of about 12 GTCO2, which would be reduced in half by 2100, the total CO2 absorbed by the oceans from 2050 would be 50 * (12 + 6) /2, or 450 GTCO2 (this is just a “swag” but is probably in the right ballpark)
1892 - Total CO2 to be sequestered for a 2 degree world------------------------------------------------
To get an idea of the costs involved, simply multiply an optimistic lower bound of the expected dioxide removal costs for CO2 in 2050 ($100/ton – about ¼ of what the Natural Resource Council predicts for direct air capture (DAC) (http://www.nap.edu/catalog/18805/climate-intervention-carbon-dioxide-removal-and-reliable-sequestration) times the 2010 greenhouse gas emissions (about 50 GTCO2e). The result shows future generations would need to spend about $5 Trillion ($100 * 50 / 1000) to remove the CO2e for just one year of current emissions. Since emissions will not come down any time soon, we can expect that future greenhouse gas emissions that need to be captured and sequestered will be likely more that 2,000 GTCO2e, resulting in CDR costs likely in excess of $200 Trillion in this century for a 2° C world and likely more than $300 Trillion for a 1.5° C world.
Moderator Response:[PS] Activated Links. In future please use the link button in the comments editor to do this yourself.
-
Rob Honeycutt at 00:29 AM on 11 January 2016Tracking the 2°C Limit - November 2015
angusmac @23... The question of what the drivers were for the MWP is unrelated to baselining preindustrial temperature. The question of what global mean temperature would be without the effects of man-made forcings is relevant and is a far more interesting approach. Based on the modeled data I posted @16 it looks like the 1880-1909 baseline would be pretty close. It would be interesting to get actual figures for that modeled data for more accurate comparison.
-
Tom Curtis at 21:09 PM on 10 January 2016How much does animal agriculture and eating meat contribute to global warming?
Glenn Tamblyn @165, red meat, fish, and various vegetables and fruits can all be dried as an effective low tech storage option, which has the further advantage that you do not need to find feed for dried meat and (in appropriate locations) it is easier to protect dried meat from rats than to protect live animals from predators (including human predators). A far more important factor for keeping livestock would be the constant supply of milk and eggs. Consequently I consider your first and third points far more important than your second.
-
Eclectic at 19:54 PM on 10 January 2016How much does animal agriculture and eating meat contribute to global warming?
Glenn @ 165, you make a very good point, on the low-tech "food storage technology". I hadn't given it sufficient thought ~ and am obviously guilty of First World bias in my thinking, there.
Cassava, I hear, is a subsistence crop that can be left unharvested for an extra year (if not immediately needed) . . . but I had been picturing the commonality of crops otherwise as being very vulnerable to vermin, during storage.
Iron and high-quality protein [the essential amino acids] make livestock-sourced food a high-value food. So we have to compare livestock with the very premium end of the vegetable-based foods, when we compare costs [both dollar costs, and environmental costs].
-
SirCharles at 18:59 PM on 10 January 2016Hockey stick is broken
Also => List of large-scale temperature reconstructions of the last 2,000 years
-
Glenn Tamblyn at 18:04 PM on 10 January 2016How much does animal agriculture and eating meat contribute to global warming?
Further to Tom's point. Some general considerations wrt meat animals.
- They can forage on ground that can't support meaningful food crops. Don't just think cattle. Think shhep and goats. That land may actually support significant biomass but it isn't human consumable - unless we plan to genetically engineer humans to have multiple stomachs and chew cud. So animals can give us a significant yield from an otherwise indigestible but substantial calorie source.
- They also act as a food storage technology - harsh to think but true. It isn't enough to grow food. You need to store it. One might, just, survive on a diet of lettuce but it's shelf life is terrible. The major grain crops constitute a storable food supply. Livestock do as well. As long as they don't die, their metabolism is actually a food storage mechanism. It ain't enough to just grow food. We need to deliver it to our bodies in a steady measured way. Storage is key.
- They can concentrate many key nutrients and deliver them to us in useful forms - milk and eggs particularly.
-
Eclectic at 14:46 PM on 10 January 2016How much does animal agriculture and eating meat contribute to global warming?
Bother . . . it should have been: unrepentant. So much for my prof reading!
-
Eclectic at 14:29 PM on 10 January 2016How much does animal agriculture and eating meat contribute to global warming?
Tom Curtis @ 162, thank you for your kind comments.
On the Major Issue : us Speling Nazzis are deeply concerned that you are an unrepentent spelling denier. Rather than wrangle with you, I would simply refer you to the excellent website of the N.A.S. [ National Academy of Spellings ] which makes all clear, on the science of modern spelling . . . and which also provides a useful overview of mainstream pronunciation [ as agreed by a consensus of over 97% of Academician pedants ] including a full summarization of the importance of Anthropogenic Glottal Warbling. Sigh . . . I guess I should just be thankful you don't spell superçede with the French cedilla. ;-)
On the Minor Issue ( Climate Change ), I am in accord with you on the matter of "grass fed" livestock pasturing on "poor land". Certainly I am not advocating vegetarianism. Whatever the merits of that case may be, I cannot think it likely that the human race could achieve an overwhelming change of preference (to meatless diet) in anything less than many generations . . . by which time, the world will have gained 3 or 4 degreesC, and by when the meatless diet may have become moot.
A still smaller point : in Third World conditions, the meat in an omnivorous diet provides a useful iron source for those many citizens afflicted with iron-deficiency anaemia caused by high parasite loads. Though unfortunately, in many such cultures, the children & pregnant women having greatest need of meat are often rather low in the pecking order for receiving meat & eggs.
Finally, let me assure you of my goodwill & admiration of your energetic and scientific posts ~ which always make good reading. Mon camarade, I do not possess the influence to get you awarded the Légion d'honneur . . . but I certainly vote for you to receive the Order of Learnin' : First Class.
Two "esses" in Class ;-)
-
Tom Curtis at 13:55 PM on 10 January 2016Tracking the 2°C Limit - November 2015
angusmac @21, the map you show from Renssen (2012) does not represent any specific time period. Renssen states:
"To address the questions raised in the introduction, we analyzed the monthly mean simulation results to establish for each grid cell the maximum positive temperature anomaly relative to the preindustrial mean (see example in Fig. 2). The analysis resulted in global maps of this anomaly (Fig. 3aeb), which we consider to represent peak HTM conditions in the model. It is important to note that the anomalies on this map do not represent “real” climatic conditions, as they originate from different months in the year and from different times within the last 9000 years. In addition, we also mapped the timing of this anomaly in ka BP (Fig. 4a-b) and the month of the year in which this anomaly occurred (Fig. 5). This was done for both ORBGHG and OGMELTICE. The latter experiment is used here as the standard simulation, as it contains the impact of all considered forcings."
(My emphasis)
In fact, consulting figure 5, we see that the maximum temperatures are drawn from every month except May, and the consulting figure 4a, that while most occure in the three millenium span, 6-9 kya (with approximately equal portions from each of those three millenia), some occur as recently as the last millenia.
Further, consulting Figure 2, we see that temperature trends in different seasons may be exactly opposite each other. Indeed, given the insolation history in high NH lattitudes, that is exactly what we would expect. It follows that the maximum temperatures shown by Renssen are not annual averages for any year.
Given these strictures on the data, your use of it can only be called an abuse of data. If I had any confidence you knew what you are talking about, I would call it fraudulent. That is because the rise in temperatures for the 2 C guideline is a 2 C rise in the annually averaged Global Mean Surface Temperature (GMST). It is expected that:
- The increase in land temperature will be greater than the increase in sea surface temperature;
- The increase at higher latitudes, particularly higher northern latitudes, will be greater than in tropical regions; and
- The increase in winter will be greater than the increase in summer.
All these features have already been observed. The consequence is that a map of temperature maximums on the same line as that in Jenssen (2012) at a 2 C increase, even if constrained to the same year, would show significantly greater than a 2 C increase in temperature. In fact, from Marcott et al, which you frequently cite, we know the increase in annually averaged GMST in the Holocene Thermal Maximum to have been approximately 0.5 C relative to preindustrial values. Consequently, your argument @21 amounts to the claim that, because we surived temperatures 0.5 C above the GMST it is patently clear that temperatures 2 C above the preindustrial average will be without "any dangerous consequence".
I will further note that your assumption that the HTM was "without any dangerious consequence" is as faith based as your prior, similar assumption about the MWP. It is plausibly argued that in some areas of the world those conditions were very beneficial, as evidenced by the invention of agriculture. Agriculture, however, was invented in low latitude regions close to water (The middle east, the Indus delta, southern China, and Central America). Those are regions with low temperature increases, even on Jenssen's map. They are not the regions which you highlight.
Finally, here are model projected temperature anomalies for the 2050s (approximately 2 C warming) relative to the 1971-2000 mean:

Please note the archaic units to avoid confusion. As you can see, regionally in that situation, we will be facing temperatures as high as 10 C above the 1971-2000 average. Clearly even if Jenssen 2012 was an annually averaged map, it would be considerably cooler than what we are facing with BAU.
-
angusmac at 13:32 PM on 10 January 2016Tracking the 2°C Limit - November 2015
Rob Honeycutt@16
I did not state that current warming, "would be similar to the MWP without the assistance of man-made CO2." I only stated (and cited references) that showed that temperatures in the MWP were similar to 1961-1990 mean tempratures.
Nevertheless, I do agree that computer models only show current warming if anthropogenic forcings are included. However, my question is what caused the previous warm periods when the human contribution was negligible?
-
TonyW at 13:20 PM on 10 January 2016Carbon Brief’s 15 numbers for 2015
I can't really see the point of a study proclaiming that the apparently impossible is actually possible, however improbable. 1.5C requires something we don't have, working scaled carbon negative technologies and, even then, shows warming going above 1.5C at some point. Every time you get a study showing some target is technically achievable, more people will switch off - "we're saved". Much of the AR5 is couched in terms of likelihood. Let's have reporting on studies that have the same language. Limiting to 1.5C is not possible (high confidence).
188 pledges mean nothing unless the pledges are met. We have to wait another 5 years for that.
331 seats. Good point. It's sad that so many countries don't have genuine democracies. A comfortable majority with 39% (or thereabouts) of the vote is hardly democratic.
Zero emissions firmly based on science? I didn't see that from the linked article. Rather, it seemed to be firmly based on wishful thinking. I doubt that science could ever say it's possible (at least not with an industrial technolgical global society).
For years, we've been told that we have to start taking mitigation actions "now". It's starting to wear a bit thin. Surely we're past that point now and we're not going to limit warming to even 2C. Let's aim to limit below 3C, whilst acknowledging that some countries will dissappear, others will have drastically altered coastlines and all sorts of climate catastrophes will be visited on us. But 3C would be far worse.
-
sailingfree at 13:10 PM on 10 January 2016Temp record is unreliable
Here is a link to the Karl paper: http://www.sciencemag.org/content/348/6242/1469.full
See fig.2
-
angusmac at 13:01 PM on 10 January 2016Tracking the 2°C Limit - November 2015
angusmac@21 was my resonse to Rob Honeycutt@15
-
sailingfree at 12:54 PM on 10 January 2016Temp record is unreliable
Please show Karl's science paper, which puts the deniers' arguement to bed.
1. The corrections to the data from the last 70 years are small and hardly noticable on his plots.
2. Overall, the raw data shows MORE warming than the corrected data. That is correct: the corrections act to lower the warming.
-
angusmac at 12:25 PM on 10 January 2016Tracking the 2°C Limit - November 2015
I agree that the Holocene peak is preindustrial but I chose to use the MWP because there is more data available for the MWP.
Notwithstanding the above, Renssen et al (2012) estimate the spatial distribution of the Holocene Thermal Maximum (HTM) temperature anomalies as shown in Figure 1.
 Figure 1: Global Variation of Holocene Thermal Maximum Anomalies (Source: Renssen et al, 2012)
Renssen et al (2012) use a pre-industrial mean of (1,000 to 200) BP and it is evident from Figure 1 that most of Europe and North America experienced an anomaly of 2-3 °C during the HTM. Renssen et al (2012) is cited in 5.5.1.1 of AR5 WG1and they offer the following conclusions their paper:
- "At high latitudes in both hemispheres, the HTM anomaly reached 5 °C."
- "Over mid-to-high latitude continents the HTM anomaly was between 1 and 4 °C."
- "The weakest HTM signal was simulated over low-latitude oceans (less than 0.5 C) and low latitude continents (0.5-1.5 °C)."
I conclude from the above that many parts of the world exceeded the 2 °C limit without any dangerous consequences and that these temperatures occurred when CO2 was at ≈ 280 ppm.
-
Tom Curtis at 11:56 AM on 10 January 2016How much does animal agriculture and eating meat contribute to global warming?
Eclectic @161, that is a very valid point although not, perhaps, as strong as you think. Specifically, animals are very inefficient at converting vegetable matter to flesh. Consequently, in calory terms you lose 90% of the nutrition in animal feed relative to the case when humans eat the feed directly. Against that, the gain is not so much when protein requirements are taken into account. Further, animal manure does increase plant growth, so that there are efficiencies lost by going to a vegan diet. Never-the-less, a switch to a pure vegan diet would substantially decrease emissions. Just not by 100% of the total livestock emissions.
Despite that, I think it is worth preserving a meat supplemented diet. That is partially because, while the nutritional requirements provided by meat can be provided by plants, that cannot be done cheaply on a global scale. I feel the inevitable consequence of eliminating meat from the diet will be a return to the deficient nutrition that has been the lot of the poor over most of history, for most of the world - and in many cases falling below that level.
Further, some locations are suitable for rearing cattle, but not at all suitable for horticulture. I have in mind locations such as those near Mount Isa (where I grew up):

That is cattle country, but you could not raise vegetables or wheat without unrealistic and unsustainable expenses for irrigation. Many locations in Africa are also suitable for grazing but marginal at best for grain. Going vegan simply means that a large amount of food raising capacity is lost without suitable replacement. In Africa, it may be simply lost without replacement at all.
Having said that, I dislike the idea of fattening lots (even grass fed fattening lots) on land suitable for horticulture - something that happens a lot, and increasingly so in recent times.
With regard to the matter of the spelling of "supercede", I am a poor speller and probably cannot achieve a consensus with myself, let alone anyone else. As it happens, "supersede" is the preferred spelling, but that is just an example of frozen fashion. The linguistic roots are from middle english (superceden) and middle french (superceder), both with the c variant. It follows that in this case my spelling has merely failed to keep up with the arbitrary dictates of grammar nazis - on which basis I have no inclination to merely conform.
-
Pete Wirfs at 10:19 AM on 10 January 20162016 SkS Weekly News Roundup #2
Today, 1/9/2016, I found a flyer on my front door that contains a gish gallop of reasons to not support a carbon tax. It goes on to recommend several climate denial web sites and youtube videos. There are no indications on the flyer of who sponsored it. I would love to have someone publish a response in the local newspapers, or help me in doing so. Please contact me if you'd be interested in taking this on. I'm in Oregon.
-
angusmac at 09:49 AM on 10 January 2016Tracking the 2°C Limit - November 2015
Images in angusmac@13 fixed
 Figure 2 Kaufmann et al (2013)
  Figure 5.7 WG1 AR5
 -
One Planet Only Forever at 09:01 AM on 10 January 2016AGU’s Sharing Science is helping scientists talk to the rest of us
PaulG,
I am pretty sure BobH was referring to the current undeniable episode of rapid global warming (far more rapid that non-human induced processes would be) that is undeniably connected to the current rapid increase of atmospheric CO2 to levels well above the highest level that occured during the past 800,000 years (and the increase of CO2 can only be explained as being due to humans dredging up and burning fossil fuels).
What you described does not excuse a denial that recent human impacts are siginicant and a serious concern. And I agree with BobH that there is a strong tendancy for the Geophysicists among the scientifically trained to have that denial.
As a member of APEGA (Association of Professional Engineers and Geoscientists of Alberta) I am aware that most of the Geoscientists working in Alberta (and there are many) have decided to try to personally benefit from the burning of fossil fuels. And many of them have specialized to the point of having no viable employment in any other endeaviour. That would explain the motivation of many of them to deny the developing undeniable better understanding.
And many of them have written letters that get published in the APEGA publication that highlight their deliberate desire not to properly understand this issue. However, to be fair, many Engineers in Alberta are similarly biased regarding the issue of climate science.
Things have been so distorted by pursuit of profit, tax revenue and employment any way hat can be gotten away with in Alberta (the result of global competition in a free-for-all market) that at one point the elected President of APEGA actually personally declared (on behalf of all members) that an APEGA member's responsibility was to maximize the profit that could be earned and to defend the developed pursuits of profit, rather than the 'protection of the public interest from unacceptable pursuits of profit so that a sustainable better future is developed' which is the truer 'public interest' that APEGA members have the responsibility to protect.
-
Eclectic at 09:00 AM on 10 January 2016How much does animal agriculture and eating meat contribute to global warming?
Tom @ 157 and 158 et seq., Thank you for the excellent presentation. Seven billion people have to be fed, one way or another . . . so I should still like to make the point ( in the "opportunity cost" sense ) that, even if we all became Vegan vegetarian, then the increased nett CO2 emission from the extra "vegetable" production (sector) would need to be offset against the current high CO2-equivalent emissions of animal agriculture. This point seems to have been lost, in the welter of world statistics that you and Ryland (and others, earlier in this thread) have been discussing.
Also, can we come to a consensus on the spelling of supersede ? ;-)
Ryland @ 156, Sorry to see you "have no more to say".
Better, if you had more to say : such as correcting the wrong inferences you have made, regarding livestock GHG emissions affecting global warming.
Whether you meant livestock in the narrow sense of animal organic emissions, or you meant livestock sector (including all its transport, processing, and infrastructure usage of fossil fuels) . . . either way, you have come to an erroneous conclusion about the AGW effects of that particular food-production sector.
And Ryland, you have failed to address the several points I raised in post #155, about the relativities and real long-term outcomes on Global Warming from (non-vegetarian) food production emissions of all sorts.
-
Tom Curtis at 08:25 AM on 10 January 2016How much does animal agriculture and eating meat contribute to global warming?
I notice the OP states:
"An oft-used comparison is that globally, animal agriculture is responsible for a larger proportion of human-caused greenhouse gas emissions (14-18%) than transportation (13.5%)."
Given the facts laid out above, I believe this should be modified to state that animal agriculture is responsible for 14.5% including indirect emissions from feed production, transport and processing, and LUC, and that using a similar measure including indirect emissions, the transport sector emits as much as does the livestock sector.
Prev 504 505 506 507 508 509 510 511 512 513 514 515 516 517 518 519 Next


