


 Arguments


Recent Comments
Prev 504 505 506 507 508 509 510 511 512 513 514 515 516 517 518 519 Next
Comments 25551 to 25600:
-
BBHY at 01:09 AM on 21 January 2016Ted Cruz fact check: which temperature data are the best?
AuntSally @8, Curry says that not because it is the best method of measuring the Earth's temperature, but because it is the most useful piece of evidence she can point to that is contrary to the to consensus that the Earth is warming, and she sees herself in the Perry Mason role.
-
Tom Curtis at 15:17 PM on 20 January 2016The Quest for CCS
Digby Scorgie @46, if the world, or even just the US and China, could muster the political will to tackle AGW with the urgency with which they tackled WW2, we could reach zero net emissions in 20 years. It is neither technically not economically infeasible. It is, unfortunately, politically unrealistic; and I suspect we will pushing it even for a 50 year timeline based on politics alone. Holding concentrations constant requires reducing emissions to about 10% of current values so politically it is no harder than eliminating emissions altogether (though economically and technically it will be substantially more difficult as all the easy emissions cuts will already have been made). Timewise, however, there will likely be only a decade of difference between the point where we hold atmospheric CO2 constant and the point were we eliminate net emissions.
What I take from that assessment is that we should never let go of the point that it is technically and economically feasible to reach zero emissions in 20 years. Doing so lets the politicians of the hook. It allows them to go slow (or do nothing at all) when the only reason that is necessary is because they are determined to go slow or do nothing at all. Therefore, that it will probably take 50 years or more to reach zero net emissions is, IMO, an irrelevant fact. Because economic cost climbs with the rapidity of emissions reduction, we should focus on the 2050 target. That is because the 2050 target is consistent with keeping emissions below 2 C, and is the longest (ergo cheapest) target that is consistent with that target.
-
Glenn Tamblyn at 15:06 PM on 20 January 2016Ted Cruz fact check: which temperature data are the best?
Richard Lawson
The following from the post by Tamino linked from here shows this more clearly.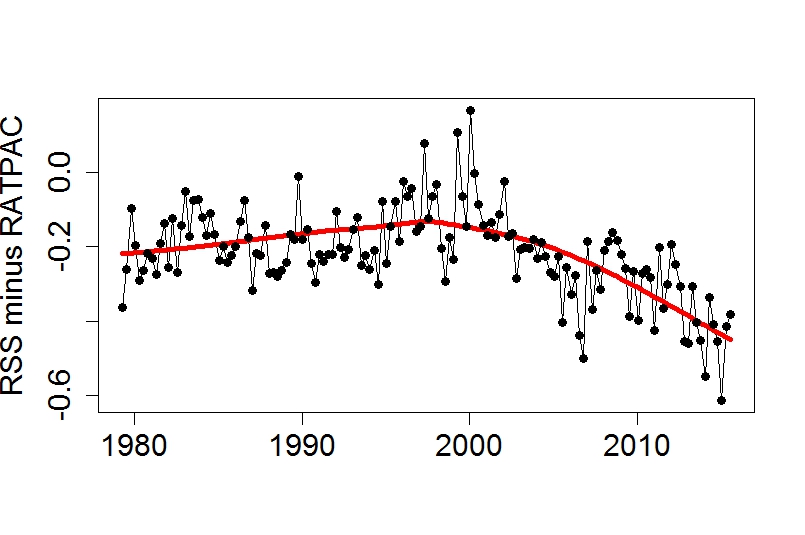
Difference between RATPAC and RSS. Looks like the divergence started more like 2000. That is about the time the satellites switched from being fitted with MSU's to AMSU.
So the suspicion is that something changed with the switch. Some unexpected drift in the AMSU's. But no one knows what yet. -
Digby Scorgie at 13:16 PM on 20 January 2016The Quest for CCS
Tom Curtis @45
I was trying to clarify my understanding of the science. I think I understand the implications now. I'm aware that in the long term it is essential that we reduce emissions to zero. I'm more interested in the short term — the next two decades. (Let me put it another way: If I live as long as my father, I've got two decades left.)
In the next two decades I'm sure we won't get to zero emissions. I doubt we'd even be able to hold carbon dioxide at 400 ppm. The implication is continued warming and worsening weather until our efforts to decarbonize begin to bear fruit after 2035. Is this a realistic assessment or is it too pessimistic?
-
John Mason at 13:08 PM on 20 January 2016A Rough Guide to Rainfall, Run-off and Rivers
Was deliberately keeping this as simple as possible!
Basically, latent heat is the energy that is needed to phase-change a substance (in the case of this post, water) to a higher state, which means from solid to liquid then gas or in other words from ice to water to water vapour (or in the case of sublimation from solid straight to gas). Such phase transformations gobble up energy. However it works both ways, so that when water vapour condenses or when liquid water turns to ice, energy is released. In convective weather situations, large amounts of latent heat are released as air rich in water vapour gets lofted to its condensation (or freezing) level: the heating has the effect of increasing the atmospheric instability because the rising air parcel, already buoyant since its surroundings are relatively cold, becomes even more so having been warmed internally by latent heat release.Jeff Haby has a piece on latent heat if anyone wants to get complicated:
http://www.theweatherprediction.com/habyhints/19/
Or try this from the IPCC:
https://www.ipcc.ch/ipccreports/tar/wg1/276.htm
Moderator Response:[PS] Fixed link
-
Eclectic at 11:47 AM on 20 January 2016There is no consensus
TheRobin @ 728, my viewpoint is much more the layman's , compared with Tom Curtis's more scientific assessment.
I had a look through some of Duarte's blogging output, about a year ago. That guy has a very weird way of viewing the world [to put it politely] . . . and my recommendation is that you will be wasting your time reading his ideas. Life is too short, to make it worthwhile spending time sifting through such quasi-sapient ramblings. Duarte is clearly intelligent, but his ratiocination is rather disconnected from reality.
Moderator Response:[PS] Eclectic - please refresh your memory of the Comments Policy. In particular, note the "no ad hom, no inflammatory tone, no accusations of fraud". Recent comments have pushed or been over the line.
-
nigelj at 11:12 AM on 20 January 2016Ted Cruz fact check: which temperature data are the best?
We will probably never have the ability to measure the warming trend exactly. We have to just accept there is a warming trend of significance.
Perhaps we should apply Occams Razor. Temperatures are warming. This warming is not explained by solar energy. This leaves the greenhouse effect.
-
sidd at 10:28 AM on 20 January 2016A Rough Guide to Rainfall, Run-off and Rivers
A sentence or para about latent heat release might be appropriate, if the author would care to add a comment ? -
Tom Curtis at 08:35 AM on 20 January 2016There is no consensus
TheRobin @728, I have addressed Duarte's criticism elsewhere. The upshot is that even if we allowed his criticisms as being entirely valid, and removed from the study all papers to which it applies, it would only reduce the consensus to 96.8%. That reduction ignores that several of the papers on Duarte's list were classified as 4, and therefore did not contribute to the consensus value; and that no doubt there were opposite errors were papers supporting the consensus were excluded or classified as 4 (both of which are known to have been the case). Ergo the 96.8% represents a generous overestimate of the impact of taking Duarte's criticism into account.
It is astonishing how consistently critics of Cook et al (2013) fail to estimate the impacts of their criticism on the 97%; and how consistently the impacts are negligible at best. There is a reasons why Duarte's criticism will not make it into peer review - but will be endlessly bandied around by those for whom rhetoric is more important than analysis.
-
Tom Curtis at 08:24 AM on 20 January 2016The Quest for CCS
Digby Scorgie @44, in the short term economic inertia ensures there will be more CO2 emissions. Consequently the information about zero emissions is relevant with respect to long term targets for emission reductions only. It is sometimes said that we need only reduce emissions by 50% with the assumption that the rest will be taken care of by the factors that currently remove about 50% of emissions from the atmosphere, but that is not correct. Even emissions as low as 10% of current values will ensure near constant atmospheric composition by balancing the reduction in CO2 overtime by natural drawdown. The result would be a further warming equal to about half of the warming todate over time. Emission rates of 1% of current values will probably ensure a slow long term rise in CO2 levels, with a consequent slow rise in temperatures. This will not be harmful in the short term because of the slow rate of temperature increase, but in the long term can easilly push temperatures in which the tropics are seasonally uninhabitable (not just uncomfortable, but literally uninhabitable). Further, even zero net emissions will not stop further sea level rises (although they will limit there scope).
All of this is important because it means we should be aiming, within 35 years (or 50 years on the outside) to reduce total human emissions to zero. It does not suggest we can plausibly reduce human emissions to zero in a year or even 15 years.
-
Rob Honeycutt at 07:55 AM on 20 January 2016Ted Cruz fact check: which temperature data are the best?
Sorry, I wasn't actually trying to be sarcastic. I was just having some fun. It wasn't intended to be at your expense, but rather for your enjoyment.
The secret hint is, the book Tamino is selling in the sidebar is his own book.
-
barry1487 at 07:52 AM on 20 January 2016Ted Cruz fact check: which temperature data are the best?
knaugle,
Put 'Tamino is statistician' into your search engine. You should find your answer somewhere in that list.
(shwiff!) [dive roll]
-
knaugle at 07:15 AM on 20 January 2016Ted Cruz fact check: which temperature data are the best?
Regarding #10, I wasn't trying to invite sarcastic stuff. Problem is if I don't know who someone is, not even the slightest hint, I'm inclined to be suspicious and the TAMINO site is suspect in my book. Though considering what Michael Mann has gone through, not proclaiming one's identity to the blogiverse is understandable.
-
Rob Honeycutt at 06:49 AM on 20 January 2016Ted Cruz fact check: which temperature data are the best?
And Eli Rabett is really... (thwip!)... Aaaaagh!
-
Ted Cruz fact check: which temperature data are the best?
Tamino is a statistician who has written a lot about global warming.
His blog is here, and the blog post containing the graph that compares RATPAC and RSS is here. -
Rob Honeycutt at 06:46 AM on 20 January 2016Ted Cruz fact check: which temperature data are the best?
Tamino's identity is one of those closely held open secrets that everyone is aware of. He's a statistician named...(thwip) ACK! ...Poison...dart...to...the...neck.
-
Digby Scorgie at 06:32 AM on 20 January 2016The Quest for CCS
Andy
I reread your blogpost. I think I have it now:
If emissions of carbon dioxide are suddenly cut to zero, the delayed warming resulting from the inertia of the system is almost exactly balanced by the cooling resulting from the declining concentration of atmospheric carbon dioxide. For at least the short to medium term the average global temperature therefore remains approximately constant.
But in the real world, even if action is taken to begin limiting emissions, carbon dioxide will continue to rise above 400 ppm although at a decreasing rate of increase. After some time the concentration will reach a maximum and then begin falling. Right?
The implication is that in the short term we'll still suffer from a rising global temperature and a worsening climate — enough to cause the collapse of global civilization? Don't know. And if it collapses, will fossil-fuel use fall drastically? I should think it would.
-
knaugle at 06:18 AM on 20 January 2016Ted Cruz fact check: which temperature data are the best?
So WHO is tamino? The link/site gives no indication who or what is behind it.
-
TheRobin at 05:40 AM on 20 January 2016There is no consensus
Has anyone looked at the rebuttal from José Duarte regarding Cook's 97% consensus paper? (http://www.joseduarte.com/blog/cooking-stove-use-housing-associations-white-males-and-the-97)
He makes quite a good case about various biases being in the methodology along with pointing out how the claimed standards have not been met in various ways.
From what I can tell he makes a pretty compelling case that the 97% consensus is way overstated as a result of those errors.Moderator Response:[RH] Please inform us when Duarte gets his rebuttal through peer review and we can discuss it at that time.
-
Brandon R Gates at 04:46 AM on 20 January 2016Surface Temperature or Satellite Brightness?
Kevin, Thanks for setting me straight as well as for your further explanations, and of course the article itself which has helped me better understand a number of other things regarding uncertanties in all temperature anomaly time series.
-
AuntSally at 01:34 AM on 20 January 2016Ted Cruz fact check: which temperature data are the best?
Alright, let me rephrase. In the video, Judith Curry asserts satellite data (presumably mid-trop MSU) is "the best data we have." I'm looking for a resource that clarifies her statement. Am unable to find, from her, a more detailed explanation of this statement. Anyone know what her reasoning is (presumably she has her reasons for this assertion).
-
Joel_Huberman at 00:51 AM on 20 January 2016Satellite record is more reliable than thermometers
The graphic says that 2.3% of global warming is going into the atmosphere. In the context of satellite measurements, it would be useful to know what percent of warming is going into the lower portion of the atmosphere where people live and where standard thermometers are located, and what proportion is going into each of the atmospheric layers measured by satellites. Since atmospheric density decreases rapidly with altitude, I suspect that mid- and upper-troposphere measurements represent extremely small portions of the heat capacity of our total Earth system. But I'd like to see the numbers; I'm not able to calculate them myself.
-
Kevin C at 00:44 AM on 20 January 2016Surface Temperature or Satellite Brightness?
I've made the following changes to the article to address the issue of the HadCRUT ensemble not including all of the uncertainies (as far as I can).
Figure 3 and 4 captions now include the following additional text:
The HadCRUT4 ensemble omits some sources of uncertainty: I estimate the spread in the trends should be increased by 7%.
Neither the Hadley or RSS data are global in coverage, both omitting a large area of the Antarctic and a smaller region of the Arctic, however differeng in other regions. The uncertainty is therefore only evalauated for the region covered. I've changed:
The UK Met Office assesses all these sources of uncertainty and uses them to produce an ensemble of 100 possible versions of the temperature record (Morice et al. 2012). By looking at the variation between members of the ensemble, we get an indication of the uncertainty in the record.
to:
The UK Met Office assesses these sources of uncertainty and uses them to produce an ensemble of 100 possible versions of the temperature record (Morice et al. 2012). By looking at the variation between members of the ensemble, we get an indication of the uncertainty in the record over the region covered by the observations. (Additional sources of uncertainty including changes in coverage and partially correlated errors slightly increase the uncertainties.)
Since neither record is global in coverage, discussion of the new infilled record and its effect on the uncertainties is irrelevant. I've removed the following sentences:
In 2010 the main difference between the records was due to differing coverage of the poles (Hansen et al. 2010). When Robert Way and I modified the HadCRUT4 record to account for incomplete coverage, we found that the corresponding uncertainties were reduced by about a factor of 2 (Cowtan & Way 2014, section 6.1). So we expect that the new infilled HadCRUT4 record from the Met Office will reduce the uncertainty in the surface temperature record.
and:
Combining the effects of coverage and the sea surface temperature corrections, the uncertainty in the surface temperature record is unlikely to change very much.
-
Kevin C at 21:15 PM on 19 January 2016Ted Cruz fact check: which temperature data are the best?
Is it due to differences in compensating for satellite drift or satellite temperature
That's exactly it. The RSS ensemble is constructed from different plausible values for each of the model parameters and adjustments required to construct the satellite record from the raw brightness data.
The spread of the RSS ensemble is an indication of the uncertainty in those adjustments.
However there is a second source of uncertainty: Not only are there uncertainties in the parameters used within a particular reconstruction method, there are different methods. So there is a second source of spread which can be measured (if rather more crudely) by comparing products from different groups (and arguably different versions from the same group in some cases).
Both of these apply both to the surface and satellite record, which is why having multiple versions is useful. Having an ensemble spread for the individal methods is also important, but currently only Hadley and RSS provide these.
-
ryland at 20:00 PM on 19 January 2016Ted Cruz fact check: which temperature data are the best?
The comment is made "On the other hand, different groups processing the same raw satellite data arrive at very different estimates of the warming trend in the atmosphere." I just don't understand why processing of the same data gives different results. Is it due to differences in compensating for satellite drift or satellite temperature or something else altogether? And is RSS more correct because those results agree more closely with surface stations? But as there is considerable emphasis on the fact that satellite and surface stations are not measuring the same thing is this a valid conclusion? I do apologise for this display of naivety/ineptitude/ignorance call it what you will. but I would be grateful if someone could explain why these differences occur. One further question, why use all the data if some are apparent outliers?
-
Richard Lawson at 19:46 PM on 19 January 2016Ted Cruz fact check: which temperature data are the best?
What is the reason for the divergence between RSS and RATPAC that happens around 2013? There is pretty good agreement before that time.
-
Kevin C at 19:31 PM on 19 January 2016Surface Temperature or Satellite Brightness?
Brandon: The 2sigma for the RSS ensemble is 0.067C/decade, so about 50% higher than the value from the paper. The 95% range would correspond to a 4sigma range, which leads to a similar conclusion.
Mears (2011) only included data to 2009. The 2sigma spread of the ensemble I plotted on that period is 0.059C/decade, which explains a part of the discrepancy. I am assuming that the remaining difference comes from the ensemble I plotted being from a later revision, but I'll ask Carl Mears.
-
BBHY at 18:42 PM on 19 January 2016Ted Cruz fact check: which temperature data are the best?
As I see it, the Ted Cruz type folks view this as a Perry Mason episode. Although the accused has 20 points of evidence indicating guilt, Perry always finds the one piece of evidence that refutes it all, shows his client is innocent and reveals the real murderer. They see themselves as Perry, and CO2 as the falsely accused. They think all they need to do is declare something about sunspots or cosmic rays and that will prove that CO2 is innocent.
The problem with that line of thinking is that while it makes for great TV courtroom drama, that is not how science works. There are many different, independent lines of evidence supporting the finding that excess CO2 in the atmosphere is warming the planet, and no single piece of contrary evidence can refute them all. Most of the contrary evidence doesn't even hold up to close examination.
We know with great certainty that CO2 absorbs infrared heat radiation. Nobody has proposed any mechanism that can possibly prevent CO2 from absorbing infrared heat radiation, and thereby causing the planet to warm. But even if they found such a mechanism, they would then still have to show how some other mechanism is warming the planet, with exactly the same characteristics as excess CO2. There is no known mechanism with such characteristics. So, that's two impossible tasks right there. But they continue to try to show that all the different temperature readings of the surface, ocean and air temperature are somehow wrong, that the measurements of heat flow into and out of the Earth are somehow wrong, and how the climate models are somehow wrong. how measurements of solar radiation are somehow wrong, etc. There is simply no single piece of contrary evidence they can possibly find that can refute all these different lines of evidence implicating excess CO2 as the cause of the warming of our planet.
-
David Lewis at 16:52 PM on 19 January 2016Ted Cruz fact check: which temperature data are the best?
Wouldn't the Argo float data indicating an almost steady rise in ocean heat storage be the most significant indicator that the planet is heating up? Its physics, isn't it?
A bit of a shift in heat distribution in the ocean takes place, i.e. El Nino, and a major shift in global surface temperature results. The ocean is a big dog and average global surface temperature, or even less, average mid tropospheric temperature, are tiny tails.
The only thing that could account for the ongoing accumulation of heat in the oceans is that there is a planetary energy imbalance.
Running satellite data through a model to compute average global mid troposphere temperature is basically irrelevant compared to this, no matter what it says.
-
Digby Scorgie at 14:32 PM on 19 January 2016The Quest for CCS
Andy
I should've read your blogpost yesterday, but I've done so now. I think I now understand what you mean. Let's see if I can summarize correctly:
If we boost carbon dioxide to 400 ppm and hold it steady at that level, there is a delay before the climate system reaches equilibrium. The average global temperature rises to a certain level and then stabilizes there.
If we add excess carbon dioxide so as to boost the level to 400 ppm but then stop adding any more, natural processes immediately start removing some of the excess carbon dioxide. The concentration of carbon dioxide decays exponentially (looking at the shape of the curve), but the average global temperature stops rising any further.
(Damn, now I don't understand why the temperature doesn't also fall, after a delay, in the latter case also. I'll have to reread your post!)
In the real world we cannot just stop our emissions all at once, but the sooner we start cutting emissions the better. Do I have that right?
-
Eclectic at 14:16 PM on 19 January 2016Ted Cruz fact check: which temperature data are the best?
J. Curry, judging by her website, relies upon a large amount of smoke & verbiage [ not "smoke & mirrors"! ] to cast a rather dense haze over the AGW topic. "Smoke" is the appropriate term, because the approach resembles the Haze of Uncertainty cast by Big Tobacco, for so many decades, to obscure the public's clear vision of the realities.
Cui bono? (as the lawyers would say). Money is always worth looking at ~ AFAIK no money is passed to her directly . . . unlike Dr Soon & a few others on the Silver Spoon of Heartland Spinstitute and suchlike hidden-donor propaganda machines. However, it is said that funds are paid into a company that she is closely associated with ~ and of course those funds would be used for expenses only (we would like to think!).
More importantly, in the cui bono line : for some types of personality there is a great attraction in notoriety ; in being seen as a maverick. I should imagine that this is quite a large factor, for those (handful) of real climate scientists who are turning a blind eye to the actual evidence.
And then, there's those all-expenses-paid trips for presenting testimony to Senate committees etcetera. All grist, for those who prefer 15 years of fame ( rather than the clichéd "15 minutes" ). Lights, cameras . . . and disinformation!
Moderator Response:[PS] Multiple comments policy violations. Let's drop this and stick to science.
-
Bob Loblaw at 13:08 PM on 19 January 2016Surface Temperature or Satellite Brightness?
hank:
Does this help?
-
Nick Palmer at 09:04 AM on 19 January 2016The Quest for CCS
Andy. In the last few years, almost under the radar, the potential of agricultural, pasture, forestry and horticultural soils to resquester carbon that they have lost over the last couple of hundred years has has been increasingly recognised.
I have checked the maths myself and there truly seems to be sufficient capacity to at least offset all current emissions but also, some say, sufficient to actually start drawing "ppms" of carbon back out of the atmosphere.
Here's an intro...
https://www.washingtonpost.com/opinions/2015/12/04/fe22879e-990b-11e5-8917-653b65c809eb_story.html -
AuntSally at 09:02 AM on 19 January 2016Ted Cruz fact check: which temperature data are the best?
What. In the world. Is going on with Judith Curry? Does anyone have any insight into her perspective? Christy and Spencer are well known to be down the path of right wing religious zealotry... but what's the story with Curry?
Moderator Response:[PS] Please stick to science.
-
uncletimrob at 08:03 AM on 19 January 2016Ted Cruz fact check: which temperature data are the best?
Thanks. The last sentence says it all!
-
Brandon R Gates at 07:08 AM on 19 January 2016Surface Temperature or Satellite Brightness?
Kevin,
I'm reading through Mears et al. (2011), and find Table 2 reports 2-sigma trend uncertainty estimates for TLT as 0.044 K/decade, whereas Figure 4 of this note puts the 95% CI for RSS TLT at about 0.13 K/decade. Explanation for that nearly 3x difference is not readily apparent to me from reading the paper as both calculations appear to be estimating the same thing. Could you please explain my error in understanding and/or give a justification for the difference in estimates?
-
hank at 04:23 AM on 19 January 2016Surface Temperature or Satellite Brightness?
Is there a map of where around the planet the balloon measurements have been made over the past 15-20 years? Do those data points get matched closely with satellite data points for the same location/date/time? I've been wondering if the dramatic change in air quality over India and China during that period makes any difference in how the atmosphere looks to the satellites. If the balloon and satellite data match up, that would rule that speculation out. (I know, this amounts to a "please prove me wrong" but speculation is all I have.)
-
tmbtx at 02:21 AM on 19 January 2016A Response to the “Data or Dogma?” hearing
It's great to see these posts on the satellite methods and their uncertainty. I've trying to find some intermediate-level explanations of how it works and now I've got them. Nice, and thanks.
-
hankspage at 02:05 AM on 19 January 2016A Response to the “Data or Dogma?” hearing
As a structural engineer I don’t claim to be any kind of expert in climate science. However it has become my favorite subject and the one thing I am most concerned about for my children and grandchildren. Therefore I do a lot of reading about the subject. Also as a structural engineer I don’t get to fudge the numbers based on my political beliefs or the results would be catastrophic.
The subject of the pause in warming during this century has been completely aggravating to me. Living in East Texas I am completely surrounded by deniers that use this argument constantly. So I made a simple excel spreadsheet which showed the ‘degrees per decade’ rate of temperature from each year to 2015 using the NASA data at ‘http://data.giss.nasa.gov/gistemp/tabledata_v3/GLB.Ts+dSST.txt’ starting at 1975. At the year 2008 the number started getting very high since the time frame was so small and the temperature for those years was increasing rapidly. But before that the average degrees per decade increase was 0.273. The lowest rate of increase for the entire 40 year period was using 1998 which showed a rate of 0.124 degrees/decade because the temperature for 1998 was so high. If you use 1997 the rate is 0.206 and if you use 1999 the rate is 0.263 degrees/decade. This is the definition of cherry picking and went a long way towards debunking the argument of my peers that there had been no increase in temperature this century.
I have a feeling the satellite data would show the same results. -
One Planet Only Forever at 01:10 AM on 19 January 2016The Quest for CCS
Glenn,
My response to your leaky boat example is:
What if you need to mobilize a group of people to plug the leak you are aware of, but everyone else is enjoying the dance party and maybe a little drunk? Add the likelihood that a few popular loud-mouths who say very appealing things that keep the partires focused on their good-time because they want to party to continue (they know about the leak and understand the importance of plugging it, but do not want it done at the expense of the Party they are enjoying, or do not want it done because the are profiting rapidly at the gamblig tables and think they gave a great hand to win the pot before he real tragedy becomes so apparant to everyone taht it shuts the party down).
Now, instead of the boat case which has everyone on the boat in personal peril, which is a very different case than climate change, the case is a group of partiers who decide to enjoy something personally enjoyable but potentially very damaging like starting fires. And they initially did it without thinking about the potential for the fire to get out of control so they were starting them anywhere that suited their interests in havig a better time. And you are one person trying to get the partiers to stop lighting those fires because of the chance they could get out of control and cause massive damage to others. But again a few smooth talking personally profiting marketers who understand the risk want the partying to continue because they are making a killing selling things to cook on the fires to all the intoxicated and party addicted revellers. Introducing a fire extinguisher will not be very succeessful.
Now extend the scenario to a case where none of the partiers believe there is any chance that they personally will suffer any of the consequences of their partying (and they are likely correct that they personally will not suffer serious consequences). How likely are you to be able to develop a technological answer to the problem that does not 'stop the unacceptable aspects of the party' sooner than the partiers are willing to shut it down.
That last case is the scenario we face. More responsible technology alredy exists. It existed 30 years ago. The partiers enjoying the party the most refuse to change how they party, because it would not be 'as enjoyable' and the liou-mouth people who understand the need to change the party behaviour will continue to appeal to keep the party going until they personally see that they will get even more popularity and profitability from changing the way the paty is enjoyed (and those people will never try to figure out how to 'ensure that everyone on the plant and far into the future can enjoy the party' (there is no money in that and it is hard work and some people will not like you).
The Promoters of unsustainable and damaging party activity need to be kept from succeeding, even if they have revved up a grand party with lots of people enjoying their good time at the expense of everyone else (and wanting to continue to enjoy their party as oblivious as possible to the damage they are doing ... because understanding that would be a real Buzz-Kill.)
So my point is that the technological solution envisioned to 'solve the problem' may not be possible (because it has to satisfy the people at the top of the party pyramid that they will be even better off).
The technology needed has existed for a long time. However, in many cases the answer is a dramatic reduction of energy consumption by the activities of the wealthiest. And anyone who won't dramatically reduce their energy consumption by choosing to pursue the lower impact ways of profiting or doing things, giving up on what they understand is an unacceptable way of enjoying their life, may need global humanity to give them the motivation for a hard-reboot of their 'life perspective'.
A significant price on carbon would be a 'hard-reboot' and is clearly contrary to the interests of the promoters of the currently most popular way to party. It has been known for decades that it would be required. That massive price on carbon is clearly the best technological solution, if you consider develoments of new financial and socioeconomic arrangements 'Technology'. And if technology is considered to be the way things are done then indeed changes to the financial and socioeconomic system are 'technological developments'.
And I would propose that it is most likely that such technological developments will create the most rapid change of human activity. And I would even suggest that the technological development you refer to 'limited to mechanical things' relies on the socioeconomic changes occurring (will not be popular without the socioeconomic changes). Without the socioeconomic changes it is possible that no level of 'mechanical technology' will be able to change the way the most fortunate among huamanity choose to try to get away with "Enjoying Their Partying".
Back to my previous comment. The ability of the people who have undeservingly become wealthy and powerful to abuse misleading marketing to keep the Party going the way they want is the real problem, and needs to be worked on more aggressively than 'mechanical technological development'.
-
Tom Curtis at 00:21 AM on 19 January 2016The Quest for CCS
wili @39, see here. With zero emissions, CO2 concentrations falls (through achieving equilibrium of pCO2 in the ocean) at approximatly the same rate that feedbacks cause a rise in temperature to the Equilibrium Climate Response for a given concentration. Because the rates are approximately equal, the net effect is that temperatures would remain approximately constant even with feedbacks taken into account. In the longer term, the rate of fall after ocean pCO2 equilibrium, further falls due to rebuffering the ocean, and chemical weathering approximate in rate the slower temperture rise to the Earth System Reponse, ie, the long term temperature response due to slow feedbacks like retreat of ice caps. The net effect is shown in this diagram:

It should be noted the errors in these estimates are quite large, and the data is consistent with either slightly rising temperatures, or slightly falling temperatures with constant emissions. More likely, temperatures will slightly rise at some times, and slightly fall at others due to the rates and relative strengths of the responses not always precisely conciding.
-
wili at 23:27 PM on 18 January 2016The Quest for CCS
"in a zero-emissions world, CO2 concentrations would fall" ??
I thought in your piece www.skepticalscience.com/Macdougall.html , that figure 3 shows that temperatures in fact won't fall in a zero-emissions world (except under very optimistic assumptions about sensitivity) because even a partial inclusion of some of the permafrost feedback will at least counter the CO2 absorbed by the oceans. And that was back in 2012.
Have these calculations changed for some reason, or am I missing something?
-
Tom Curtis at 21:34 PM on 18 January 2016Tracking the 2°C Limit - November 2015
angusmac @41, I am not going to respond formally to your post until it is clear that it will not be deleted for its rather egregious posting under the wrong topic. If it is so deleted, by all means repost in on the correct thread. If you feel there is some part of the discussion that asolutely belongs on this thread, you can then link to that repost and highlight briefly only what is relevant, and why it is relevant to the OP here.
I will note that it is extraordinary in science to only make criticism on weblogs (which is where you will find the criticism of Marcott et al), and to expect a more formal response by Marcott without demanding a more formal critique by the science assassins "climate auditors" represents a stunning hypocrissy.
Moderator Response:[PS] Can I suggest that any discussion relating to Marcott et al be conducted in this thread? I dont intend to delete the angusmac comment since it obviously involved some effort to construct and isnt totally offtopic, but I would appreciate responses in more suitable threads.
-
angusmac at 19:15 PM on 18 January 2016Tracking the 2°C Limit - November 2015
Rob Honeycutt@39 & Tom Curtis@32
Rob, I agree that the conversation has veered off course for this comment thread but I do wish to make the following comments regarding Marcott et al (2013) that are relevant to baselining preindustrial temperatures:
- Marcott et al state that their results indicate that “global mean temperature for the decade 2000–2009 [HadCRUT3] has not yet exceeded the warmest temperatures of the early Holocene (5000 to 10,000 yr B.P.).” Therefore, if we were to use their reconstruction, we would be near to the Holocene peak.
- 80% of the Marcott et al proxies are derived from marine archives and consequently would underestimate global land-ocean temperatures. Consequently, the Marcott et al results should be adjusted upwards for an apples-for-apples comparison with land-ocean temperatures, as suggested by Glenn Tamblyn@9.
- Proxies tend to have multi-decadal to centennial resolutions and should not be compared directly with annual instrumental temperatures. Kaufman et al (2013) consider this by presenting the most recent 30-year period (1983-2012) from HadCRUT4 as shown by the star in Figure 2. However, a good case could be made for using a longer period for the instrumental mean when comparing it with proxies that are of centennial resolution e.g., Marcott et al (2013).
 Figure 2 (Kaufman et al, 2013)
Tom, I had thought that the uptick at the end of the Marcott et al reconstruction would provide a good correlation with instrumental temperatures but Marcott et al stated that their 1890-1950 warming was “probably not robust.” If it is not robust then why show it?
Further research indicated that there had been criticism of the paper, which resulted in a Q&A blog by Marcott et al in RealClimate which stated that, “the 20th century portion of our paleotemperature stack is not statistically robust, cannot be considered representative of global temperature changes, and therefore is not the basis of any of our conclusions.”
“Not robust” is an understatement when you compare Figure S3 from Marcott et al (2013) with Figure C8 in Marcott’s PhD thesis (2011). This comparison shows that there are differences in the two reconstructions in general and, in particular, the last 500 years shows completely different results. For example, there is an uptick in Figure S3 in the 2103 version and no uptick in Figure C8 in the 2011 versions (see Figure 1).
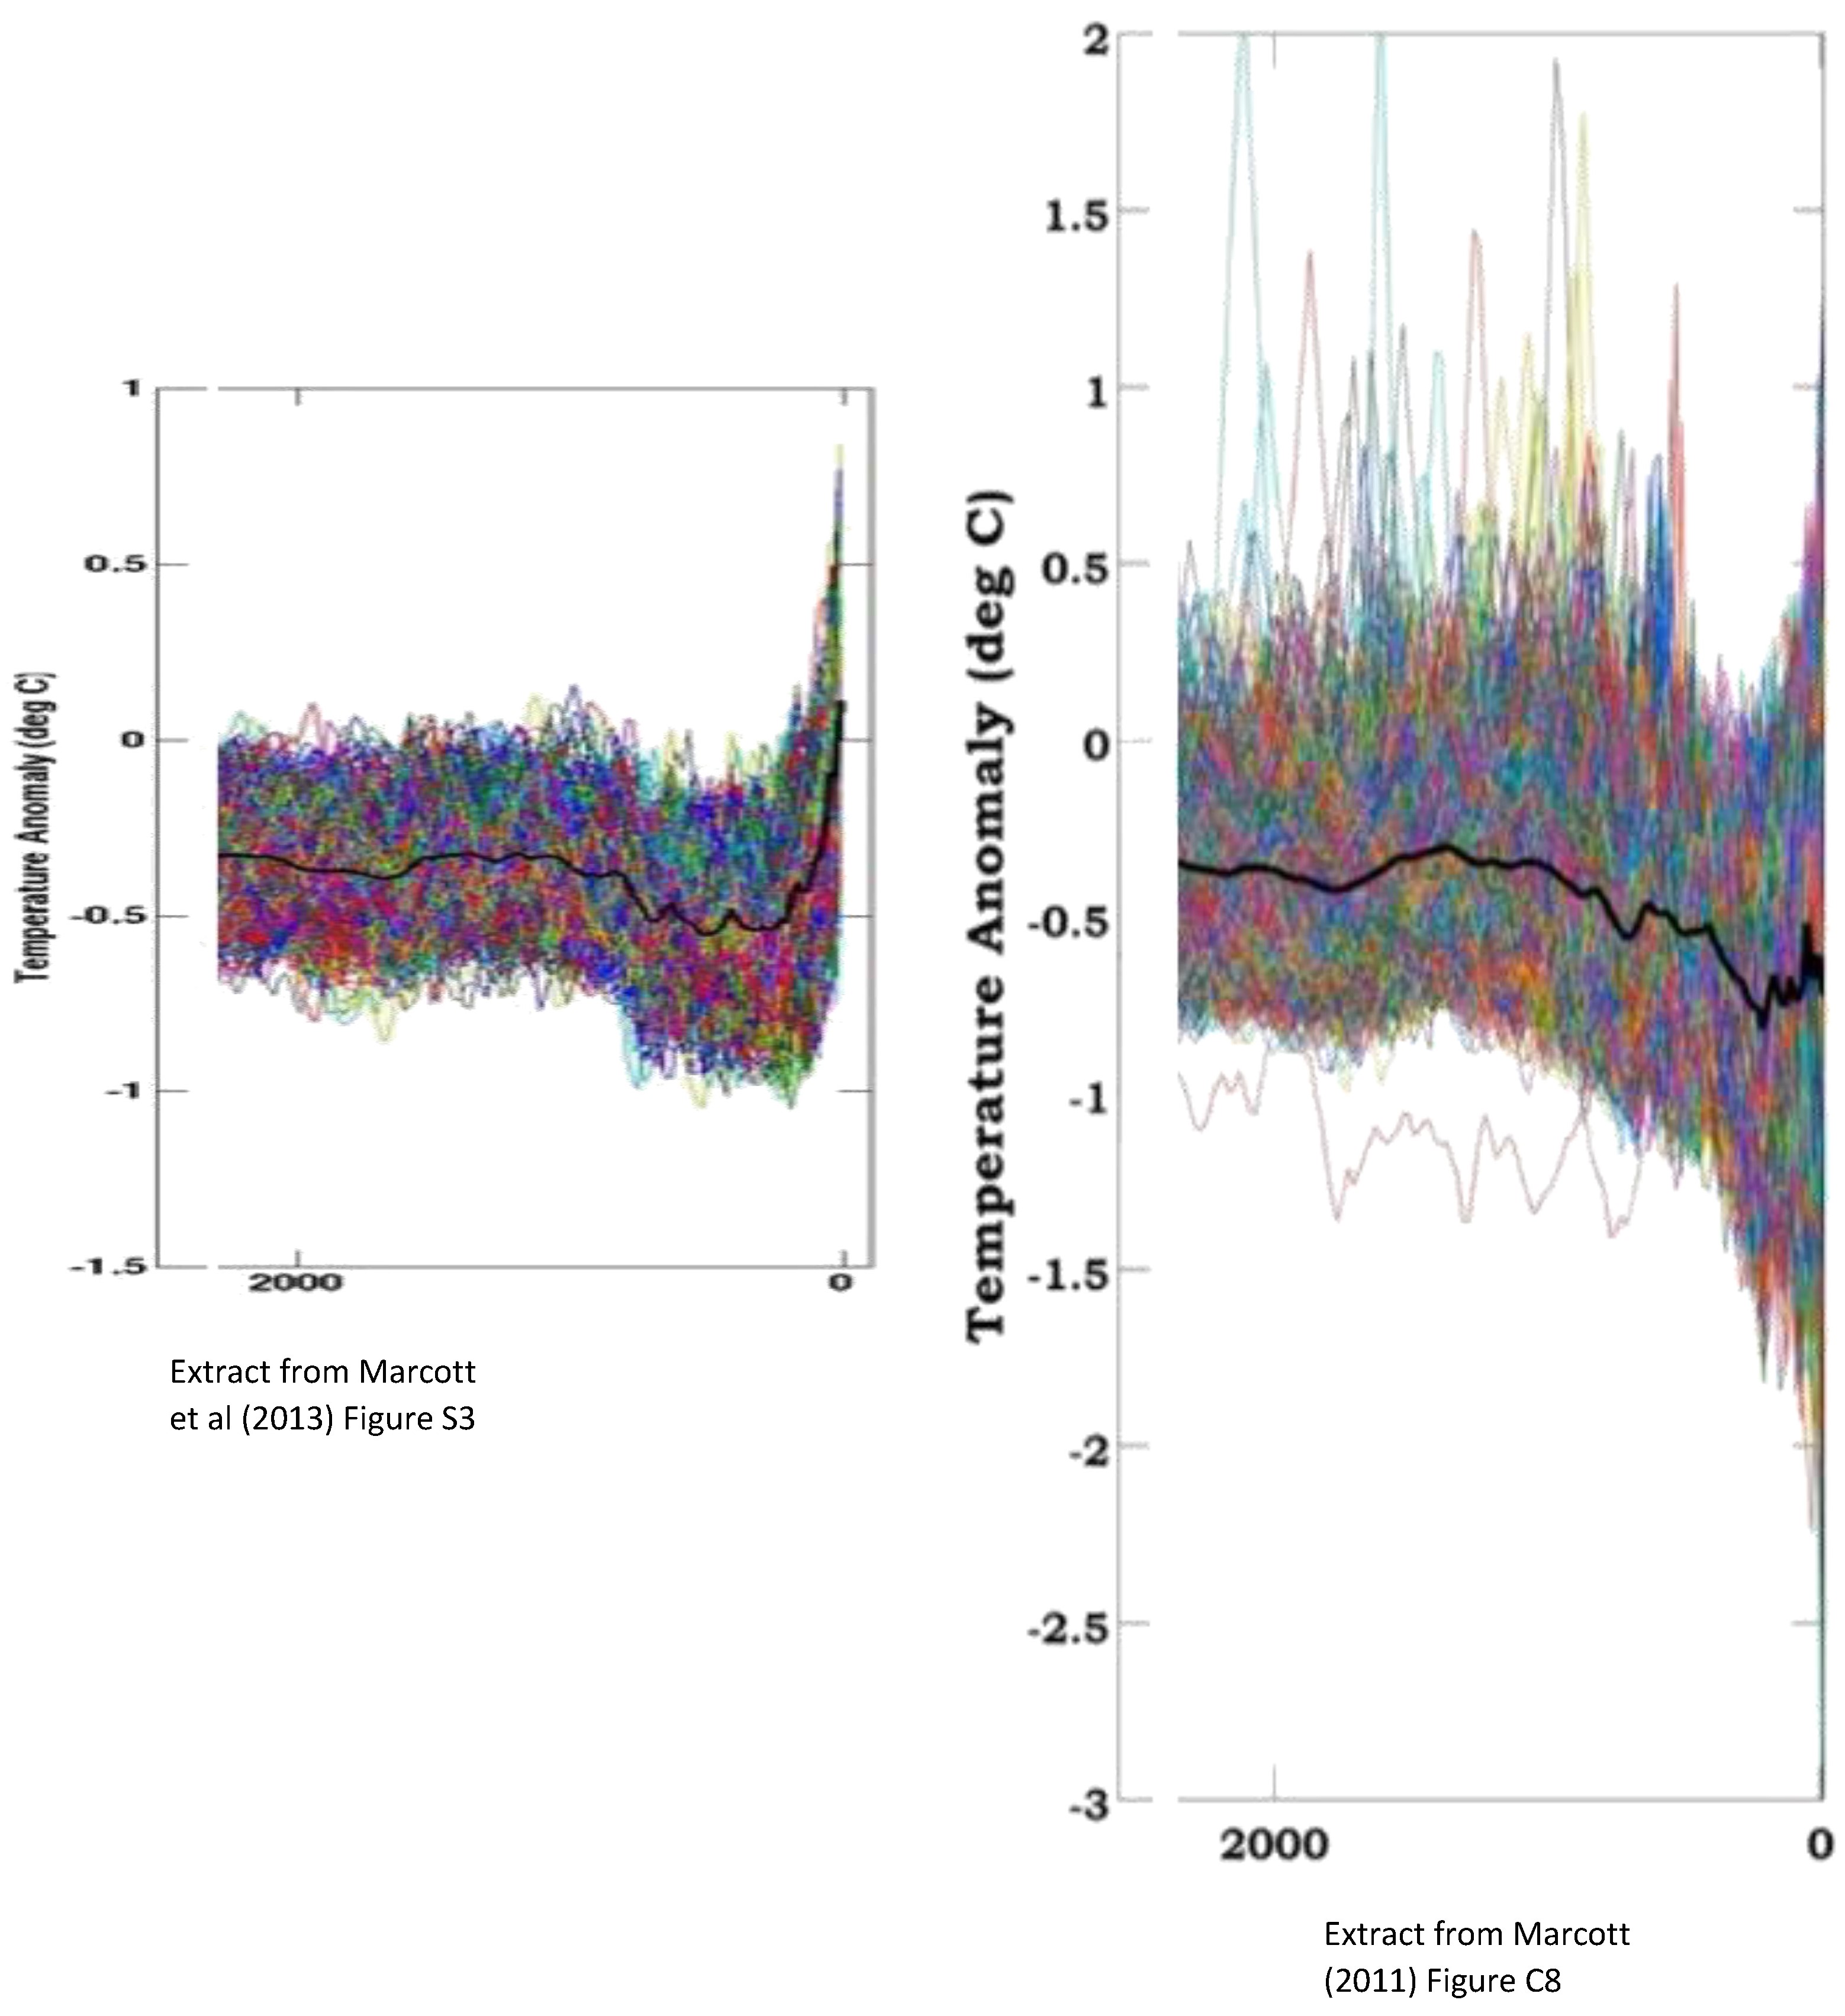
Figure 1: Extracts from Figure S3 (Marcott et al, 2013) and Figure C8 (Marcott, 2011)
A difference of approximately 0.8 °C in the two versions of the reconstruction is presented in Figure 1 – yet they use the same proxies. Marcott et al do not address this significant difference by their “not robust” statement.
Regarding the criticism of their paper, it is very unusual to address such criticism in a weblog, as done by Marcott et al. It is normal scientific practice to address criticism in clarifications/corrigenda to the original paper in the pertinent journal because this allows a technical audit on the veracity of the paper. Not having done so certainly casts doubt on the robustness of the last 500 years of the reconstruction and perhaps even the entire paper.
In light of the above discrepancies in Marcott et al (2013), I would not recommend it as a reasonable paleo reconstruction.
-
Andy Skuce at 19:07 PM on 18 January 2016The Quest for CCS
Digby
To keep concentrations constant at 400ppm would require continued emissions, albeit at a much lower rate than today's. These emissions would be required to make up for the CO2 that would continue to be taken up by the oceans and biosphere. In such a low emissions/constant concentration world, temperatures would continue to rise.
On the other hand, in a zero-emissions world, CO2 concentrations would fall and the temperature would remain roughly stalled.
Neither scenario is plausible in the very near future. We have a long way to go before we stabilize concentrations and further still before we reach zero or negative emissions, which we will need to halt the rise in global temperatures.
Check out the link I posted in #33 above. It's not very intuitive.
-
Brandon R Gates at 17:48 PM on 18 January 2016A Response to the “Data or Dogma?” hearing
Thank you for posting this follow-up. I offer a critique of following paragraph:
“Model input errors” and “different variability sequences” require a little further explanation. Let’s assume that some higher extraterrestrial intelligence provided humanity with two valuable gifts: a perfect climate model, which captured all of the important physics in the real-world climate system, and a perfect observing system, which reliably measured atmospheric temperature changes over the last 18 years. Even with such benign alien intervention, temperature trends in the perfect model and perfect observations would diverge if there were errors in the inputs to the model simulations,[h] or if the purely random sequences of internal climate oscillations did not “line up” in the simulations and in reality (23, 24, 30, 32-36).
It is my understanding, going all the way back to Lorenz (1963), Deterministic Nonperiodic Flow [1] that the more appropriate way to think of the weather/climate system is that it would NOT diverge from previous behavior if all the initial inputs were exactly the same. "Purely random" evokes the concept of a stochastic system where there is no such guarantee by definition.
I understand that what Drs. Mears and Santer mean by "purely random" is that with the the real system, which is massive and complex, we do not have the observational fidelity OR computational ability to reliably predict short-term climate trends (i.e., weather) in advance due to the sensitivity a deterministc system has for initial conditions — therefore, it behaves as an "effectively random" system for the purposes of exactly timed, very precise prediction of future states.
However, because it is an almost completely deterministic system, we can at least theoretically hope after the fact to suss out a causality chain for the various modes of internal variability and/or pertubations in external forcings which do contribute to constant change even absent our influences. I think this is a distinction which separates our argument from the magical thinking of the "climate is always changing (and nobody knows why)" crowd ...
... not that many of them see it that way since Lorenz (1963) is often abused as "proof" that climate cannot possibly be projected or predicted over the long-term because ... chaos.
---------------
[1] http://eaps4.mit.edu/research/Lorenz/Deterministic_63.pdf
-
Ceist812534 at 17:45 PM on 18 January 2016A Response to the “Data or Dogma?” hearing
Cruz should have also been questioned on why he would use a graphic from "Steve Goddards" blog. Tony Heller even boasts about it on his blog (see "Ted Cruz used my graph").
The 'hasn't warmed in 18 years etc" graph is Lord Monckton's deceptive graphic that does the rounds of contrarian blogs.
-
Digby Scorgie at 17:43 PM on 18 January 2016The Quest for CCS
Andy
You pinpoint what I don't understand. Suppose for the sake of argument that one can expect an average global temperature of two degrees above pre-industrial when carbon dioxide is at 400 ppm. And suppose also that it takes 25 years for the temperature to rise to the two-degree level after carbon dioxide hits 400 ppm. Why then, will this not occur if one suddenly stops adding more carbon dioxide to the atmosphere?
Glenn and OPOF
You've given me a lot to think about that I unfortunately don't have time to respond to at the moment. I'll try later.
I see that, still, nobody has noticed my sneaky final comment! Suppose global civilization (not regional) does actually collapse by 2040. What will be the effect on fossil-fuel use? Will it fall a lot?
-
Glenn Tamblyn at 15:31 PM on 18 January 2016The Quest for CCS
OPOF
Yes and no. Is technology the answer? To what problem?
If you are in a boat that is unsound and sinking, your long term answer, your strategic answer is to get the boat to dry land. But if it is sinking too quickly you need a short term, tactical answer, something to plug the leaks so that you can make it to shore.
Technology may not be 'the answer' as you say in the longer term and we need to rethink how we do things. But in the short term we either shut off our entire energy supply and head back to the Dark Ages in which case your rethink becomes moot.Or we do nothing while just working on the rethink and we go back to the Dark Ages anyway as serious climate change knocks everything down and again your point is moot.
Or we do some technological stuff so we still have energy and not too much climate change and thus don't return to the Dark Ages, then/as well we implement your change.
Now can we put off your change till later while focusing on the short term technological fix? If we try for your change will peoples short term push-back against it also prevent the implentation of the tech fix? Will most people freely embrace your change - I will but I may not be representative - or will they need some spur to do so.
Personal view, and it is probably negative, and a bit cynical, is that your change is absolutely needed, but it won't happen until most people have had the living beejeesus scared out of them by what is happening. Then they will clamor for all the change to happen overnight.
A good first step might be changes that reign in the use of the media to promote the entire consumer society dream-machine. Getting control of the media out of the hands of business would be a powerful first step.
Nothing wrong with advertising (to make known) that company X sells product Y - " Hi, we are General Motors and we make cars. If you need a car come to one of our 'car-buying-places' and see if you like any of ours". Thats it. Not one iota more.
But if you want to do more, to 'pitch' your product, sorry, you will have to wait until a potential customer visits your 'car-buying-place'
Step 1, shut down Madison Avenue. Imagine a life, a world, where we only see an advertisement if we go looking for them. We never ever see unsolicited ads, in any context, ever!Give it a generation and how does our thinking start to change?
-
Glenn Tamblyn at 15:08 PM on 18 January 2016The Quest for CCS
Digby, I am not saying I think commercial developments will change emission levels, quite possibly they won't. But if anything is going to surprise us I think it is that.
And anything that significantly changes emission levels is by definition a change to BAU.
Will this be enough. No. But it might buy time to do more.
As for civilisation collapsing by 2040, I tend to agree with Andy. Later this century is quite possible. 2040 I think it is more likely we are seeing the starting phases of a collapse. If a collapse were to occur, it won't happen overnight. It would be protracted over many decades.
Past civilisational collapses took time and they were more local. What we might see in a 2040 timeframe is a start to the breakdown of the links of globalisation with our societies reverting more to regional civilisations. Then each of those regional societies experiencing collapses at differing paces through the rest of the century and beyond.
And we would only really talk of a collapse of civilisation as a whole if all the regions collapse. Countries with good food supply to population ratios, local raw materials supplies, cultural diversity and good education will fare better.
So Europe & North America, Perhaps China (although it's population is a big stressor), perhaps Russia, Argentina, may fare better. My country of Australia may not fare as well. We tick many of the boxes but we would need to re-establish an industrial base to be more self-sufficient. And the USA's current internal cultural divisions may be it's biggest single weakness and vulnerability.
Governments have extraordinary emergency powers when times get tough. So regional civilisations might still survive even if they aren't as democratic.
Prev 504 505 506 507 508 509 510 511 512 513 514 515 516 517 518 519 Next


