


 Arguments


Recent Comments
Prev 505 506 507 508 509 510 511 512 513 514 515 516 517 518 519 520 Next
Comments 25601 to 25650:
-
One Planet Only Forever at 07:26 AM on 18 January 2016The Quest for CCS
Digby and Glenn, Your discussion has gotten me thinking.
What is needed is a change of attitude in Humanity, not technological development.
Hopefully, the global acceptance of thoughtful considerate rigorously developed understanding will prevail sooner and quicker. Humanity could rapidly achieve the required results if the biggest impacting people simply changed their mind and accepted that they did not deserve their developed perceptions of prosperity and superiority.
My MBA training decades ago and my observations of what has been going on based on living and working in Alberta, combined with reading the presentations by others of what I do not personally observe has led me to the conclusion that technological development is not an 'answer to anything'. It is a 'result'. It is a development resulting from human desires.
Technology is the 'result of choices made about the application of development of better understanding'. And right now the focus is clearly on technology related to pursuits of popularity, profitability and perceptions of prosperity. That focus develops higher technology toys and benefits for wealthy people (and weaponry and security measures) without any conscientious responsible limits on development to ensure it is not contrary to the advancement of humanity to a lasting better future for all.
And the marketing push for 'more impressive toys' affects the choices made regarding the types of better understanding that are pursued. It also affects how that new learning is 'marketed' (shared and promoted). Research that is focused on potential popularity and profit can be a distraction from research into better understanding how to advance humanity to a lasting better future for all.A particular area of research that lacks funding (because its results are highly likely to be contrary to the developed interests and desires of many wealthy and powerful people) is research into why the current socioeconomic system has developed so much damaging and unsustainable activity. The answer is almost certain to be that the system encourages the development and success of attitudes and actions that can be understood to be unacceptable, but are easily made popular and very profitable (for as long as can be gotten away with).
So, technological development is not 'the answer'. Socioeconomic change is the answer. How quickly that change occurs is anybodies guess.
The biggest improvement will occur when the people personally responsible for the most impact change their mind and limit their pursuits of profit and pleasure to actions that are clearly understood to develop toward a lasting better future for a robust diversity of life on this planet.
If all of the currently wealthy and powerful people who do understand this (and I am almost certain that they all do understand it), stopped fighting against it becoming the guiding force of global humanity then improvement could develop very rapidly, because there would be no barriers or distractions.If all of the wealthy and powerful will not change their minds (a very likely case), then another path to success is the conscientious responsible wealthy and powerful people collectively working to ensure the gamblers who try to prolong their ability to get away with unacceptable actions quickly become losers. This will take longer and be a slower change.
The efforts to terminate the success of the irresponsible callous pursuers who have become wealthy and powerful (or want to become wealthy or powerful that way) is the current path. And we are at the low end the scale regarding the rate change of limiting the damaging successes of people who choose to be callous greedy people. Many powerful wealthy nations still elect leaders who are clearly not a conscientious as they know they should be, because they do not want to be, or do not need to be, conscientious when being responsible would be contrary to popular profitable interests and the unsustainable perceptions of prosperity and superiority that such interests can create.
It is clear that the conscientious and responsible among the wealthy and powerful need the support of the general population. The general population needs to desire conscientious responsible leadership focused on developing a lasting better future for all. That transition of the general population to support such leadership is the biggest challenge, because it is very easy to impress people with scientifically developed marketing appeals to greed and intolerance. In addition to being a big challenge, that change of attitude, not technological change, must be accomplished if humanity is to actually advance to a better future.
The bottom line is that the focused needs to be on understanding the unacceptable power of misleading marketing. Effectively addressed that damaging development, the power of deliberately misleading appeals to vanity, greed and intolerance, is essential. And that objective relates to far more than the developing better understanding of climate change. It relates to all of the pointless and likely to be damaging distractions developed by socioeconomic pursuits of 'impressions of advancement and superiority'.
The technology for humanity to live is a sustainable part of the robust diversity of life on this amazing planet already exists. The lack of popularity and profitability of that attitude is the problem. And that attitude problem will not be solved by technological development.Skeptical Science is clearly targeting the right issue. It is one of many efforts striving to figure out how to raise awareness of the steady stream of unacceptable developments that have been produced, promoted and prolonged in the current global socioeconomic experiment.
What is obvious is that the experiment is not producing the 'claimed' results. And the arguments that 'better results will develop if there is more freedom for people to do whatever they want' clearly are not based on a rational conscientious evaluation of what is going on.
The failure of the 'freedom' experiment and the development of better understanding regarding its failure will lead to changes of attitude. That is why some powerful wealthy people are drumming up opposition to 'leadership guided by thoughtful considerate rigorous developed understanding'.
Some wealthy powerful people have a lot to lose if the socioeconomic political game actually changes. Developing better understanding of what is required to advance humanity is almost certain to be contrary to the interests of many wealthy and powerful people. And humanity has no real chance of advancing until those undeserving people among the wealthy and powerful change their mind or fail to succeed.
There are many books out there presenting information along those lines, including Naomi Klein's "This Changes Everything", but so many more. The likes of Shakespeare and Dickens wrote about unacceptable developed attitudes and the required changes. Even many Greek and Chinese philosophers were pointing this out. And it is embedded in almost every religious text.
At some point that understanding has to become the guiding force for humanity to actually advance. But people will have to get over the belief that they can do whatever they please. And that will require limits on the effectiveness of misleading marketing. It is all about the marketing.
Marketing that fully presents the best understanding of something is obviously 'better', except in the minds of those who want to benefit from marketing.
-
Magma at 06:13 AM on 18 January 2016A Response to the “Data or Dogma?” hearing
A good, informative post. Mears in particular must become frustrated seeing his work constantly misrepresented.
With respect to ongoing research, I wonder if a series of high-resolution measurements in the 53-57 GHz band from an airborne microwave spectrometer (vertical looking up, vertical looking down and horizontal) under measured conditions of temperature, pressure and humidity might allow improved deconvolution of the satellite data. Most of the emission curves in the papers I've looked at have a very simplified, idealized look to them. (Maybe this has already been done, but if so I've missed it.)
As an aside, I think 48 references in a short blog post must be close to some kind of record. -
Andy Skuce at 05:58 AM on 18 January 2016The Quest for CCS
Digby, I'm not at all familiar with the work of Aled Jones, so I shouldn't comment. Nevertheless, claims of societal collapse on a global scale in 25 year's time seem implausible to me. Certainly, regional crop failures could lead to collapse in already unstable countries and the effects of that collapse could spread regionally, beyond the country's borders. The unfolding tragedy in Syria provides a model of this.
I think it's important to distinguish between the inertia of the climate system and the inertia of the global economy. I wrote a blogpost sometime ago that tried to clarify this. The climate system will actually respond quickly to any change in GHG concentrations and if, by some miracle, we could stop all emissions today, then global warming would stop very soon. The problem is, we can no more easily stop our emissions tomorrow than we could stop breathing or eating. To immediately shut down fossil-fuel consumption certainly would lead to global societal collapse.
It was Hemingway, I think, who wrote about the way people go bankrupt: slowly at first, then quickly. When you look at social revolutions in the past, they too show long periods of slowly simmering inaction followed by periods of rapid, revolutionary change. Looking back, the question "what took them so long?" often springs to mind.
I'm hoping that the Paris agreement marks a turning point between the 21-year slow phase and a much faster rate of decarbonization over the years to come. It had better.
-
Jonas at 19:48 PM on 17 January 20162016 SkS Weekly News Roundup #3
>Environmental change rate unprecedented
When will #peakdestruction be reached?
How many species and humans will earth be able to carry from then on? -
Digby Scorgie at 19:35 PM on 17 January 2016The Quest for CCS
Glenn
You're implying that, notwithstanding the inertia of the climate system, cutting fossil-fuel use in the next few years will be sufficient to cause a significant deviation from the business-as-usual path. But will it? Not being a climate scientist, I don't know.
Assuming the world model used by Aled Jones is accurate, any change would have to take effect well before 2040. It has to stop the climate becoming so much worse than it is now that food production suffers. Andy, can you help?
-
Glenn Tamblyn at 17:27 PM on 17 January 2016The Quest for CCS
Digby
Not so sure I agree that only modest reductions are likely before 2040 although that is certainly possible. The wildcard in this is the continuing drop in prices for solar, wind and batteries and the potential for serious scaling up when critical mass is achieved.
For example, Tesla hace built their Giga factory and are considering more. What happens when/if the economics are such that every car manufacturer reads the tea leaves and decides that they need to get into electric cars big time, pronto. Every car company starts building multiple battery factories and retooling their factories. Its a significant investment sure but on the scale of what car companies spend to bring each new model to market now it isn't out of the ball park.
If they decided it was the right thing to do and was urgent, they could switch 1/2 their model range to electric in 10 years.Similarly, how far off is it before all new build power generatiion is renewables. In 2014 it was 1/2 of all new capacity. Chile recently held an auction for some capacity, open to all technologies equally. Renewables scored the lot.
You might be right. But the next 5-10 years will tell. Either we will see a major shift started, not particularly driven by governments. Or we wont. -
Digby Scorgie at 14:42 PM on 17 January 2016The Quest for CCS
Let me get this straight. We need to decarbonize by about 2050. This requires drastic reductions in fossil-fuel use, beginning soon. Use of CCS, with or without BE, would help.
If we focus on the next 25 years (to 2040), I suspect that, to be realistic, there will be only a small reduction in fossil-fuel use. Also, from all I've read about CCS, I conclude that any help in that department will also be small.
But, considering only the next 25 years, does it matter? As I understand it, geophysical inertia ensures a delay of 25 to 50 years before average global temperatures reach the level expected for 400 ppm of carbon dioxide. We have another 0.5 degrees of warming locked in.
Now, over the course of the previous 25 years there has been a marked increase in extreme weather events. These have already had an adverse effect on food production, including in North America. During the next 25 years we can expect these events to become more frequent and intense, leading to even greater damage to food production. In effect, in the near term we will not be able to deviate from the business-as-usual scenario.
Meanwhile, the global population continues to increase, implying a greater demand for food, even as the supply is falling. Global civilization might not survive this. Indeed, I see that Aled Jones and his Global Sustainability Institute predict a collapse of global civilization by 2040.
It seems that Jones and company use a souped-up version of the world model used for "Limits to growth". The model is supposed to be good just for near-term predictions, but I imagine they couldn't resist running it to 2040. The predicted collapse surprised them, but this scenario seems to me all too plausible.
I conclude that any action taken on fossil-fuel use and CCS will not have much effect on the climate for the next quarter century. During this period the worsening climate might well result in the collapse of global civilization.
What intrigues me is the possibility that, if global civilization does collapse before 2040, the result will be the drastic fall in fossil-fuel use that we couldn't otherwise manage ourselves. The planet will have done the job for us.
Please feel free to pick holes in the above scenario.
-
Mothra at 05:15 AM on 17 January 2016Climate's changed before
I usually offer deniers an analogy with forest fires.
Forest fires are often caused by lightning, a natural cause.
Does that mean that forest fires are ONLY caused by nature? Of course not. [Smokey the Bear has been telling us that for years.]
Forgive me if that's old and familiar to you.
I appreciate your website, it's excellent.
-
michael sweet at 21:16 PM on 16 January 2016Surface Temperature or Satellite Brightness?
Tom's comment above might be used as an OP to counter the claims he refutes, if the incorrect claims by Christy and Dellingpole start to be widely cited. It will be hard to find his specifics if they are left as a comment.
-
Kevin C at 21:10 PM on 16 January 2016Surface Temperature or Satellite Brightness?
We can also check different subsets of the weather stations against each other, as I do in the video. We can check different SST platforms against each other, such as weather buoys against Argos. We can check island weather stations against surrounding SSTs. We can check in situ observations against skin temperature data from infrared satellites. We can check in situ observations against reanalyses based on satellites (including MSUs) or barometers and SSTs. All of these have been done, and more such comparisons are in the pipeline.
The UKMO Eustace project will be relevant in future too.
-
Tom Curtis at 13:43 PM on 16 January 2016Surface Temperature or Satellite Brightness?
Some of you are undoubtedly already aware of the excellent video on satellite temperatures recently released by Peter Sinclair:
There is now some denier pushback against that video, led by the infamous James Delingpole, ;at Breitbart.
Some of the pushback (typically of Delingpole) is breathtaking in its dishonesty. For instance, he claims:
"This accuracy [of the satellite record] was acknowledged 25 years ago by NASA, which said that “satellite analysis of the upper atmosphere is more accurate, and should be adopted as the standard way to monitor temperature change.”
It turns out the basis of this claim, is not, however, a NASA report. Rather it was a report in the The Canberra Times on April 1st, 1990. Desite the date, it appears to be a serious account, but mistaken. That is because the only information published on the satellite record to that date was not a NASA report, but "Precise Monitoring of Global Temperature Trends" by Spencer and Christy, published, March 30th, 1990. That paper claims that:
"Our data suggest that high-precision atmospheric temperature monitoring is possible from satellite microwave radiometers. Because of their demonstrated stability and the global
coverage they provide, these radiometers should be made the standard for the monitoring of global atmospheric temperature anomalies since 1979."A scientific paper is not a "NASA report", and two scientists bignoting their own research does not constitute an endorsement by NASA. Citing that erronious newspaper column does, however, effectively launder the fact that Delingpole is merely citing Spencer and Christy to endorse Spencer and Christy.
Given the history of found inaccurracies in the UAH record since 1990 (see below), even if the newspaper column had been accurate, the "endorsement" would be tragically out of date. Indeed, given that history, the original claim by Spencer and Christy is shown to be mere hubris, and wildly in error.
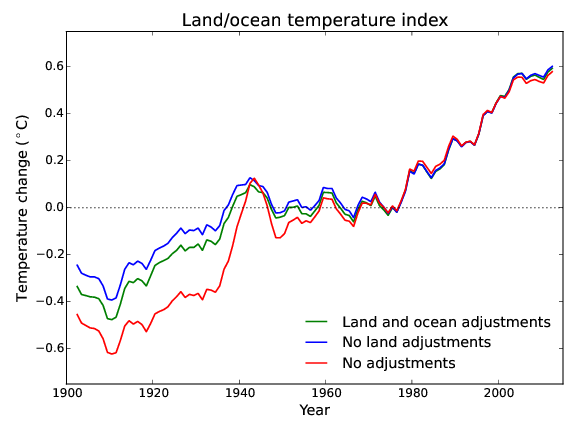
Delingpole goes on to speak of "the alarmists’ preference for the land- and sea-based temperature datasets which do show a warming trend – especially after the raw data has been adjusted in the right direction". What he carefully glosses over is that the combined land-ocean temperature adjustments reduce the trend relative to the raw data, and have minimal effect on the 1979 to current trend.
He then accuses the video of taking the line that "...the satellite records too have been subject to dishonest adjustments and that the satellites have given a misleading impression of global temperature because of the way their orbital position changes over time." That is odd given that the final, and longest say in the video is given to satellite temperature specialist Carl Mears, author of the RSS satellite temperature series, whose concluding point is that we should not ignore the satellite data, nor the surface data, but rather look at all the evidence (Not just at satellite data from 1998 onwards). With regard to Spencer and Christy, Andrew Dessler says (4:00):
"I don't want to bash them because everybody makes mistakes, and I presume everybody is being honest..."
Yet Delingpole finds contrary to this direct statement that the attempt is to portray the adjutments as dishonest.
Delingpoles claim is a bit like saying silent movies depict the keystone cops as being corrupt. The history of adjustments at UAH show Spencer and Christy to be often overconfident in their product, and to have made a series of errors in their calculations, but not to be dishonest.
The nest cannard is that satellites are confirmed by independent data, in balloons - a claim effectively punctured by Tamino:

Finally, Delingpole gives an extensive quote from John Christy:
"There are too many problems with the video on which to comment, but here are a few.
First, the satellite problems mentioned here were dealt with 10 to 20 years ago. Second, the main product we use now for greenhouse model validation is the temperature of the Mid-Troposphere (TMT) which was not erroneously impacted by these problems.
The vertical “fall” and east-west “drift” of the spacecraft are two aspects of the same phenomenon – orbital decay.
The real confirmation bias brought up by these folks to smear us is held by them. They are the ones ignoring information to suit their world view. Do they ever say that, unlike the surface data, the satellite datasets can be checked by a completely independent system – balloons? Do they ever say that one of the main corrections for time-of-day (east-west) drift is to remove spurious WARMING after 2000? Do they ever say that the important adjustment to address the variations caused by solar-shadowing effects on the spacecraft is to remove a spurious WARMING? Do they ever say that the adjustments were within the margin of error?"
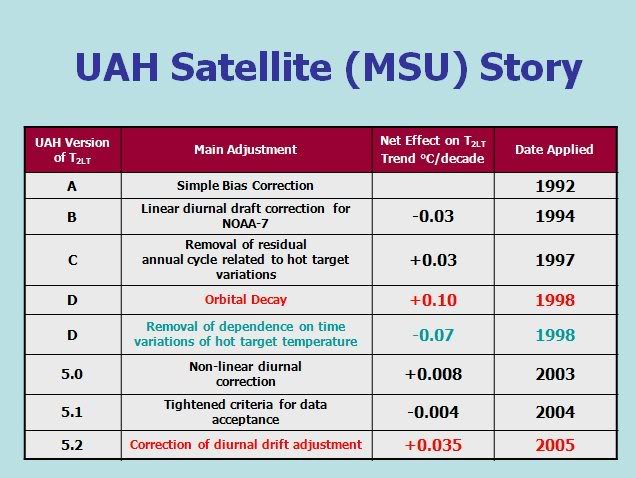
Here is the history of UAH satellite temperature adjustments to 2005:
Since then we have had additional corrections:
- 5.2: Eliminate NOAA 16 data, +0.01 C/decade; Dec 2006
- 5.2: Discovered previous correction eliminated NOAA 15 by mistake, unknown amount; Dec 2006
- 5.2 Switch from annual to monthly anomaly period baseline, +0.002 C/decade; July 2009
- 5.5 Eliminate AQUA data, + 0.001 C/decade
There were also changes from version 5.2 to 5.3, 5.3 to 5.4 and 5.5 to 5.6 which did not effect the trend. Finally we have the (currently provisional) change from 5.6 to 6.0:
- 6.0, Adjust channels used in determining TLT, -0.026 C/decade; April, 2015
Against that record we can check Christy's claims. First, he claims the problems were dealt with 10-20 years ago. That, of course, assumes the corrections made fixed the problem, ie, that the adjustments were accurate. As he vehemently denies the possibility that surface temperature records are accurate, he is hardly entitled to that assumption. Further, given that it took three tries to correct the diurnal drift problem, and a further diurnal drift adjustment was made in 2007 (not trend effect mentioned), that hardly inspires confidence. (The 2007 adjustment did not represent a change in method, but rather reflects a change in the behaviour of the satellites, so it does not falsify the claim about when the problem was dealt with.)
Second, while they may now do model validation against TMT, comparisons with the surface product are done with TLT - so that represents an evasion.
Third, satellite decay and diurnal drift may be closely related problems but that is how they are consistently portrayed in the video. Moreover, given that they are so closely related it begs the question as to why a correction for the first (Version D above) was not made until four years after the first correction for the second.
Moving into his Gish gallop we have balloons (see link to, and image from Tamino above). Next he mentions two adjustments that reduce the trend (remove spurious warming), with the suggestion that the failure to mention that the adjustments reduce the trend somehow invalidates the criticism. I'm not sure I follow his logic in making a point of adjustments in the direction that suites his biases. I do note the massive irony given the repeated portrayal of adjustments to the global land ocean temperture record as increasing the trend relative to raw data when in fact it does the reverse.
Finally, he mentions that the adjustments fall within the margin of error (0.05 C per decade). First, that is not true of all adjustments, with two adjustments (both implimented in version D) exceding the margin of error. Second, the accumulative adjustment to date, including version 6.0, results in a 0.056 C/decade increase in the trend. That is, accumulative adjustments to date exceed the margin of error. Excluding the version 6 adjustments (which really change the product by using a different profile of the atmosphere), they exceeded the margin of error by 38% for version 5.2 and by 64% for version 5.6 (as best as I can figure). If the suggestion is that adjustments have not significantly altered the estimated trend, it is simply wrong. Given that Christy is responsible (with Spencer) for this product, there is not excuse for such a mistatement.
To summarize, the pushback against the video consists of a smorgazbord of innacurate statements, strawman presentations of the contents of the video, and misdirection. Standard Delingpole (and unfortunately, Christy) fare.
-
Olof R at 21:18 PM on 15 January 2016Surface Temperature or Satellite Brightness?
Glenn Tamblyn #19,
Po-Chedley et al 2015 use and praise the methods of NOAA STAR, and together with their own new diurnal drift correction, they can reduce the error/uncertainty substantially. They do a Monte Carlo uncertainty simulation, like that of RSS. From table 3 in that paper:
Trends ± 95% CI in tropical TMT (20 S-20 N)
Po-Chedley 0.115±0.024 °C/decade
RSS 0.089±0.051 °C/decade
Thus, Po-Chedley et al can reduce the uncertainty by half compared to RSS, and their narrower interval fits almost perfectly to the upper half of the RSS uncertainty interval.
There is other evidence that the true temperature trends of the free troposphere should be in the upper part of the RSS uncertainty interval. One example is this chart , an investigation of the claim "No warming for 18 years", with a collection of alternative indices from satellites, radiosondes and reanalyses.
-
chriskoz at 21:16 PM on 15 January 2016Kids ask US presidential candidates to debate science
Sample of questions (in original article) is impressively exhaustive. Some of that questions clearly have nothing to do with science and cannot come from young kids, e.g.:
How should we manage immigration of skilled workers?
That's a socio-economic problem that kids honestly don't care about. Myself, I didn't even know about such problem until I started my uni education, i.e. I was well into the voting edge.
-
uncletimrob at 19:48 PM on 15 January 2016Kids ask US presidential candidates to debate science
This is a really interesting study and reminds me of the 1960's and 1970's student protests. As a teacher I can assure anyone that quality time spent with 13 - 17 year olds, in an environment where they are stimulated, valued and listened to will show you that they:
1) do care about the future
2) do have an understanding of the issues of today and how they may affect the future
3) are concerned about extinctions and environmantal damage
4) do have an understanding of what climate change is and means.
Unfortunately Pollies look to the next 4 years, not the next 40 (or more) that our children will be exposed to. So the eyes, ears and hearts of the future are often ignored.
-
Paul D at 19:15 PM on 15 January 2016Kids ask US presidential candidates to debate science
I recently tried talking about science and energy with my (UK) Minister of Parliament who is Conservative.
What I found is this:
1. A backbench MP who is interested in higher positions and sees politics as a career is unlikely to say anything to members of the public/voters that would contradict their political parties official policy.2. A mainstream MP will acknowledge climate change is real and we have to do something about it. However the party ideology and the MPs economic and social beliefs will always have a higher priority. It's because their brains have had years of self indoctorination that continually influences the path they take.
3. The bottom line is always winning the next election which will result in short term policies overriding any long term issues. A quick fix appeases party activists and opinion polls.
4. An MP will stop talking if you clearly have a completely different take on the subject. Put yourself in the place of a customer who wants a special version of a mass produced product, you ask the Apple sales person for an Android iPhone, they will tell you to go and shop somewhere else. MPs are products or product sales people, if you don't want their product and they can get plenty of business without changing, then they will get bored with you. -
Tom Curtis at 13:24 PM on 15 January 2016The Quest for CCS
Andy @28, I do want to emphasize the "relatively" in "relatively trivial levels associated with transport and processing". To see what that means, compare S4-7 (forest residues, counterfactual: leave in forest), S8 (forest residuces, counterfactual: burn as waste), and the previously mentioned 9b (salvaged dead trees, counterfactual: remove and burn at roadside figure 28 in the report). These have approximate emissions intensities as follows:
S4-7: 310 +/- 230 KgCO2e/MWh
S8: 25 +/- 40 KgCO2e/MWh
S9b: 0 +/- 100 kgCO2e/MWh
Natural Gas: 440 kgCO2e/MWh
Coal: 1020 KgCO2e/MWh
The difference between scenario S4-7 and S8 is that the branches that constitute the litter decay slowly in S4-7, thereby constituting a temporary carbon sequestration relative to the immediate combustion. Between S8 and S9b the difference is that combustion of a whole tree is inefficient, resulting the production of methane. Crucially, the difference between S8 bioenergy usage, and the counterfactual is that the counterfactual avoids all the transport and processing costs. Therefore, to a close approximation, that 25 KgCO2e/MWh represents the emissions represents the emissions from transport and processing.
As you can see, it is less than 10% of the cost relative to leaving the litter in situ, which cost is fairly representative of the costs or benefits of different changes in LU. A beneficial change in LU (barren, grass or agricultural land to plantation of naturally regenerating forest) will swamp that component; while for a harmful switch the transport and processing emissions will be swallowed by the error margin.
Hence "relatively trivial".
-
Andy Skuce at 12:41 PM on 15 January 2016The Quest for CCS
Tom, I don't think it's quite right to claim that the transport and processing emissions are relatively trivial. I'm no expert on these matters, so I may have misunderstood something, but it seems that there is a lot of energy used to gather, dry, pelletize and transport the product (wood pellets) used in UK electricity generation. This involves the consumption of natural gas and petroleum. For example, Western Canadian wood pellets used in the UK (made from waste wood), the energy consumed could range anywhere from ~20% to ~80% of the final electrical output of the UK power stations.

Here is the graph showing the GHG intensity, measured over 100 years, of using waste wood for different sources. As you can see, emissions are mostly less than using natural gas, but are rarely near or below zero. And it's not just a matter of LUC.

Now, there are counterfactuals that make biomass consumption emissions-negative, for example, when agricultural or abandoned land is reforested, or where the management intensity of existing forests is increased (see Figures 5 and Figure 6, below). Mostly, the resource quantities in N America that qualify for negative emissions are smaller even than the demand for Britain alone.
And, of course, the life-cycle emissions of other kinds of biomass grown and used in other parts of the world may be entirely different, but these were beyond the scope of the DECC report.

Perhaps I went too far in saying that all biomass use is not carbon neutral, but, among the scenarios studied by DECC, the majority of them are. However, I think that it is certainly wrong to assume, as the EU currently does, that biomass combustion does not produce net GHGs.
-
Tom Curtis at 10:04 AM on 15 January 2016The Quest for CCS
Andy Skuce @26, looking at the executive summary of the DECC report, it becomes obvious that the energy intensity of biomass is absolutely dependent on Land Use Change (LUC) over the short period. Scenario 9b (Deadwood from natural disturbance where the wood would otherwise have been burnt by the roadside) represents an interesting case in that it involves no LUC in the counterfactual. The report shows an energy intensity of approx +/- 100 kgCO2e/MWh in this case, with the uncertainty arising from whether emissions from processing and transport are outweighed by the more efficient combustion with avoided CH4 emissions. As emissions from combustion by the roadside and from natural decay will be approximately equivalent (though on a shorter timescale) this scenario approximates to that of biomass energy with no LUC.
Beyond that, carbon stocks in situ at a given site depend on the current land use, with:
Old Growth Forest > Naturally Regenerating Forest > Plantations > Agricultural and/or Grassland (a)
Thus if you cut down naturally regenerating forest to provide space for plantations, there is a large net loss of stored carbon and the biomass generated over the short to medium term will have large effective emissions to compensate for that difference. On the other hand, if you take abandoned land/grassland/agricultural land and convert it to plantations, there is an increase in carbon storage in the land so that the biomass energy produced has a net negative carbon intensity over the short term, even without CCS.
Clearly this means that over timeframes required to restore forests to natural conditions, carbon intensity from biomass energy from any source will trend towards the emissions from transport and processing. Assumed to operate in perpetuity, they will approach that level as an asymptote. That is, the biomass energy is essentially carbon neutral (ignoring the relatively trivial levels associated with transport and processing) except for the effects on LUC.
Of course, it is unreasonable to plan on the assumption a process will continue in perpetuity. That is particularly the case as biomass energy is often assumed to be a coal substitute to extend the life of existing plants. Ergo it follows that the energy intensity will approximate to emissions from LUC from preproject state to final project state/ energy produced over the lifetime of the project. Thus, biomass from plantations grown on abandoned/agricultural/grassland that is returned to its original state after the end of the project is essentially CO2 neutral, while bioenergy from disturbed forests will have positive carbon intensities, potentially as great as coal in the short term but in the long term >200 years are carbon neutral provided the land harvested is allowed to return to a natural forest state. And for completeness, bioenergy from agricultural waste do not add to emissions from the agricultural project itself.
Would you agree this is a fair summary?
If so it is in agreement with all I have said above, except that I have treated the bioenergy as essentially carbon neutral but noted that emissions from LUC do need to be accounted for (but accounted for separately). I would agree that the DECC accounting method is better when examining the effects of individual projects.
-
Andy Skuce at 05:16 AM on 15 January 2016The Quest for CCS
To be clear, I answered "yes" to ryland's question @5 because he/she used the word "somewhat". There are cases, as Tom has pointed out, where biomass use can help reduce GHG concentrations at the same time as providing energy, particularly if/when BECCS is employed. What is wrong, however, is the assumption made by the EU and others that all biomass burning (without BECCS) is carbon neutral. Biomass burning is somewhat self-defeating and it has other mostly nasty environmental impacts, as well, on land use, water use and ecosystem preservation.
i would urge everyone to look through the DECC report I referenced in @7. This study has the fingerprints of David Mackay all over it. The emissions impacts of different kinds of biomass vary very widely and depend on a multitude of assumptions about geography (where we gather the fuel, where we burn it), counterfactuals (ie, what would happen if we didn't burn the biomass) and the time periods over which we measure the effects. Perhaps the only sweeping conclusion we can draw is that biomass energy, as it is currently practised, is not carbon neutral.
-
John Hartz at 04:15 AM on 15 January 2016Surface Temperature or Satellite Brightness?
Recommended supplemental reading/viewing:
Experts Fault Reliance on Satellite Data Alone by Peter Sinclair, Yale Climate Connection, Jan 14, 2016
-
Tom Curtis at 03:29 AM on 15 January 2016The Quest for CCS
Joel_Huberman @23, Land Use Change. More correctly I should refer to Land Use, Land Use Change & Forestry (LULUCF) but that is a bit of a moutful.
-
RedBaron at 03:23 AM on 15 January 2016How much does animal agriculture and eating meat contribute to global warming?
Glenn # 168
This is the most important point made on this whole page:
"Feedlots of grain feed cattle just so we can have lots of steaks that are marbled 'just so' aren't. That is a wasteful indulgence."
Since ultimately we are discussing how to change the current system to something that doesn't contribute as much if any to AGW, they key is what effects can be achieved by which changes.
The problem with the switch to vegetarianism/veganism is that we are still stuck with all the problems associated with fossil fuel derived haber process ammonium nitrate in crop production, and the resultant soil degradation that stems from that.
A properly integrated animal husbandry and crop production model needs little to no haber process nitrogen once SOM reaches ~4%-5% +/- and produces a synergy where waste and pests from one are food for the other. Finally several integrated systems have been shown to actually be net carbon sinks, sequestering more carbon in the soil than their associated emissions. For this reason, ultimately the changes required to mitigate AGW the most are to re-integrate animal husbandry production into cropping systems, rather than either feedlots or eliminating animal husbandry altogether.
I am not trying to diminish the harm livestock production causes now, just pointing out that we are talking about changing that harm to a benefit. Animal husbandry properly managed and fully integrated into crop production is the better option over veganism, though both are probably somewhat of an improvement over the CAFO and grain production models most commonly used now.
-
Pol Knops at 03:11 AM on 15 January 2016The Quest for CCS
Indeed in addition to CCS we have to move to BECCS. But given the enormous amounts required (and thereby the land requirements) even BECCS won't be sufficiently.
As JWRebel noticed there are indeed more ways for Carbon Dioxide Removal:
- enhanced weathering: spreading Olivine and let it react with CO2. The cost are mainly depending on buying the olivine (and therefor the logistics).
- accelerated weathering; making of products with CO2. But this is still in a research phase. Although we want to scale up.
-
Joel_Huberman at 00:43 AM on 15 January 2016The Quest for CCS
Tom Curtis @ 12. What's "LUC"?
-
ryland at 23:43 PM on 14 January 2016The Quest for CCS
Glenn Tamblyn @20. Advertisements from various suppliers of wood pellets state they are from trees. As an example this ad from CPL (see here) states "The wood used for biomass wood pellets either comes from wastes from industries such as sawmilling or from virgin trees that have been specifically grown for the purpose of creating pellets". This extract from a letter from Save americasforests to the Senate shows the concerns expressed about the use of trees for biomass. (reference). The extract states:
"However, this legislation goes even farther in contributing to global climate change. It instructs the Forest Service to take the wood logged from these forests and burn it in wood-energy plants. Nothing could possibly contribute more to global climate change than increasing logging on our national forests and then burning the wood in biomass plants".
I'm sure there are many sources of biomass but at the moment trees appear to figure prominently as a biomass source
-
Tom Curtis at 23:35 PM on 14 January 2016The Quest for CCS
Glenn Tamblyn @20, I don't think the charcoal burning needs to be old fashioned (which is labour intensive). I do agree that CCS can only be a bit player in reducing emissions to zero; and CCS of biofuels is likely to also only be a bit player in generating net negative emissions or compensating for fugitive emissions in a zero net emissions regime. The fun thing is, however, I don't have to make any predictions on the issue. If we get a well established carbon price, the market will sort it out.
-
Kevin C at 23:04 PM on 14 January 2016Surface Temperature or Satellite Brightness?
Olof #18: Nice work.
On the coverage uncertainties, I hadn't really thought that through well enough when I wrote the end of the post. The RSS and HadCRUT4 ensembles don't contain coverage uncertainty, so infilling won't reduce the uncertainty. I'll update the end of the post (and post the changes in a comment) once I've thought it through some more (in fact I'll strike it through now).
If we are interested in global temperature estimates, we have to include the coverage uncertainty, at which point the infilled temperatures have a lower uncertainty than the incomplete coverage temperatures. For the incomplete temperatures, the uncertainty comes from missing out the unobserved region. For the infilled temperatures, the uncertainty comes from the fact that the infilled values contain errors which increase with the size of the infilled region. In practice (and because we are using kriging which does an 'optimal' amount of infilling) the uncertainties in the infilled temperatures are lower than the uncertainties for leaving them out.
-
Glenn Tamblyn at 21:53 PM on 14 January 2016Surface Temperature or Satellite Brightness?
Olof R
Interesting....
There seems to be a fundamental need here. Before proceeding to the adjustments such as for Diurnal Drift etc, there needs to be a resolution of the question: 'does the STAR Synchronous Nadir Overpasses method provide a better or worse method for stitching together multiple satelite records'?
-
Glenn Tamblyn at 21:36 PM on 14 January 2016The Quest for CCS
Yeah Tom, old fashioned charcoal-burner technology is a possibility. It could be done quite locally to the harvest point and reduce the captured carbon to a more concentrated form. And also a form that is less likely to breakdown when sequestered.
But that is adding another processing step with its own costs, losses, inefficiencies etc.
All these things are cost/benefit trade-offs, whether those things are measured in dollars or joules.But ultimately all technologies that involve bulk materials handling of gigatonnes of something may turn out to be too inefficient.
I still think approaches that use nano-technology, natural processes, pre-existing natural matter and energy flows etc. are the more likely to succeed at scale.If we have to build an industrial revolutions worth of kit to do it, it ain't gonna work.
-
Glenn Tamblyn at 21:24 PM on 14 January 2016The Quest for CCS
ryland.
The assumption that BECCS is about trees is perhaps even less valid. The best crops for BECCS are likely fast growing species. Trees don't always fit that bill. Various grasses have been considered. The impressive growth rates of Bamboo for example might recomend them. -
Olof R at 20:59 PM on 14 January 2016Surface Temperature or Satellite Brightness?
Kevin, Good demonstration of the uncertainty in satellite and surface records..
I want to highlight another aspect of uncertainty associated with the new multilayer UAH v6 TLT and similar approaches. UAH v6 TLT is calculated with the following formula (from Spencers site):
LT = 1.538*MT -0.548*TP +0.01*LS
MT, TP, LS is referring to the MSU (and AMSU equivalents) channels 2,3 and 4 respectively.
There are other providers of data for those channels, NOAA STAR and RSS, with the exception that they do not find channel 3 reliable in the early years. STAR has channel 3 data from 1981 and RSS from 1987..
As I understand, each channel from each provider are independent estimates, so it should be possible to choose and combine data from different providers in the UAH v6 TLT formula.
Some examples as follows:
UAH v6 TLT 1979-2015, trend 0.114 C/decade
With STAR data only 1981-2015, trend 0.158 C/dec.
STAR channel 2&4, UAH v6 channel 3, 1979-2015, trend 0.187 C/dec.
UAH v5.6 channel 2&4, STAR channel 3, 1981-2015 trend 0.070 C/dec
So, with different choices of channel data, it is possible to produce trends from 0.070 to 0.187, and interval as large as the 90% CI structural uncertainty in RSS..
Here is a graph with the original UAH v6 and the combination with the largest trend:

If anyone wonders if it is possible to construct a UAH v6 TLT equivalent in this simple way from the individual channel time series, I have checked it and the errors are only minor:
Original trend 0.1137
Trend constructed from the three channels 0.1135
#17 Kevin, If you replace the uncertainty ensemble of Hadcrut4 with that of your own Hadcrut4 kriging, what happens with the spatial uncertainty?
Is there any additional (unexpected) spatial uncertainty in Hadcrut kriging, or is the uncertainty interval of RSS still 5.5 times wider, which it was according to my calculation (0.114 vs 0.021 for 90% CI)?
Moderator Response:[RH] Image width fixed.
-
Tom Curtis at 20:11 PM on 14 January 2016The Quest for CCS
Sorry, not "which is why" but "which is one good reason (among several others related to conservation)".
-
Tom Curtis at 20:10 PM on 14 January 2016The Quest for CCS
wili @16, which is why we should not cut old growth forests for biomass, nor to convert them to plantations or other agricultural use. On the other hand, converting agricultural land to plantations (or some more rapidly growing crop) for biomass mass may be beneficial.
-
wili at 17:31 PM on 14 January 2016The Quest for CCS
"Wild untouched forests store three times more carbon dioxide than previously estimated and 60% more than plantation forests"
-
Tom Curtis at 16:52 PM on 14 January 2016The Quest for CCS
wili @14:
"Second, our findings are similarly compatible with the well-known age-related decline in productivity at the scale of even-aged forest stands. Although a review of mechanisms is beyond the scope of this paper several factors (including the interplay of changing growth efficiency and tree dominance hierarchies) can contribute to declining productivity at the stand scale.We highlight the fact that increasing individual tree growth rate does not automatically result in increasing stand productivity because tree mortality can drive orders-of-magnitude reductions in population density. That is, even though the large trees in older, even-aged stands may be growing more rapidly, such stands have fewer trees. Tree population dynamics, especially mortality, can thus be a significant contributor to declining productivity at the scale of
the forest stand."(Stephenson et al, 2014, "Rate of tree carbon accumulation increases continuously with tree size")
That is, as trees get bigger they crowd out the competition, which fact more than compensates for the increased carbon accumulation per tree.
While this may raise tricky questions as to the best time to reharvest renewably harvested natural forests, it does not void my analysis above.
-
wili at 16:30 PM on 14 January 2016The Quest for CCS
"... for most species mass growth rate increases continuously with tree size. Thus, large, old trees do not act simply as senescent carbon reservoirs but actively fix large amounts of carbon compared to smaller trees; at the extreme, a single big tree can add the same amount of carbon to the forest within a year as is contained in an entire mid-sized tree. "
www.nature.com/nature/journal/v507/n7490/full/nature12914.html
-
wili at 16:17 PM on 14 January 2016The Quest for CCS
Andy, thanks for the thoughtful answer at #6. I found the last bit particularly well put:
"I'm probably not alone in not wanting to live in a valley below a big CCS operation, because might not be as bad and very unlikely to be a catastrophe is not reassuring enough. If CCS is ever to be deployed at the scale that some of the modelers envisage, then among the required tens of thousands of projects, involving who-knows-how-many injection wells, unexpected disasters are certain."
-
Tom Curtis at 14:29 PM on 14 January 2016The Quest for CCS
ryland @11, you get your 'yes' answer only by assuming the wood used will be hardwoods felled from old growth forests. More likely they will be softwoods from plantations.
Further, pulp fiction does not address the issue with biomass and CCS. When biomass is burnt in a CCS facility, 75%+ of the CO2 produced is captured and sequestered. That means the replacement trees need only grow to 25% or less of the mass of a mature tree before additional growth draws down excess CO2 from the atmosphere. With a pine tree, that can be five years or less growth.
Finally, the pulf fiction analysis is mistaken in any event. In a mature biomass industry, there will be plantation timber in all stages of growth. Assuming a time to maturity of 20 years. Then for each km^2 of wood harvested and burnt, there will be 20 km^2 of wood at various stages of growth the annual sequestration by the full industry will equal the annual emissions (without CCS).
The pulp fiction scenario would apply where old growth forest is harvested for biomass on a non-renewable basis. Even there, however, the pulp fiction story gets the accouting wrong. In such a scenario, the full CO2 emissions from clear cutting the forest will be accounted for as LUC. Requiring that it be accounted for again at point of combustion would simply require that it be accounted for twice. Thus, while it would a bad, very unsustainable mitigation policy to burn biomass from old growth forests, the CO2 emissions from such a practice are still accounted for (just not at the power plant).
Further, while I say it would be bad to burn biomass from forestry (as oppossed to plantation) timber, that does not necessarilly apply to wood waste for which no other suitable use (including composting) can be found.
And finally, in my home state (Queensland, Australia) the vast majority of biomass burnt is wast cane from the sugar refinery process which is used to power the crushing and refining operations. The cane takes only a year to grow. Equivalent rapid growth biomass is no doubt found in many locations, and completely undercuts the (faulty) logic of the pulp fiction scenario. Fitting CCS to the cane powered refineries would be a positive benefit to the environment without question (though probably not economic).
-
ryland at 14:03 PM on 14 January 2016The Quest for CCS
Thanks for the replies to my post @5 on the use of living trees as an energy source. I got a "Yes" @7, a qualified "No" @8 and a "No" @9. Intuitively I tended to favour the "yes" as it takes a long time to regenerate forests that, comparatively speaking, are felled in an instant. Thus large mature living trees are felled and replaced by immature trees with a consequent significant fall in carbon sequestration. This is discussed in some detail in John Upton's series "Pulp Fiction" referred to by Andy Skuce @7 and from that it seems "Yes" may well be correct.
From this series it also seems the EU are not being entirely kosher on their emissions, as wood is classed as carbon neutral. Consequently emissions from wood are not counted. In addition power generators burning wood avoid fees levied on carbon polluters and to add insult to injury, receive "hundreds of millions of dollars in climate subsidies"
-
John Salmond at 13:44 PM on 14 January 2016The Quest for CCS
Academic: 'CCS laughable' (13min) https://www.youtube.com/watch?v=S8-85Q46Lw4
-
Bob Loblaw at 12:10 PM on 14 January 2016Medieval Warm Period was warmer
Answering here, as requested by the moderators, rather than the other thread that Tom points to (Angusmac elsewhere).
Angusmac's argument that the MWP was global seems to be akin to using past southern hemisphere summer temperatures as a direct comparison to current global mean temperatures, under the argument that "summer happens everywhere, so it's global"
...all while ignoring that it's pretty hard to find a time when both the southern and northern hemisphere had summer at exactly the same time.
-
Tom Curtis at 11:42 AM on 14 January 2016The Quest for CCS
Ryland @5, no. Trees sequester more carbon per annum when growing to maturity than when mature. If you cut down mature trees to allow regrowth, and bury the carbon so it is not released back to the atmosphere, you will sequester more carbon than by leaving forests undisturbed.
Glenn Tamblyn @8, intuitively better yet would be to cook the wood in a charcoal oven which:
1) Allows you to capture the energy of combustion of the hydrygen in the cellulose as an energy source;
2) Reduces the sequestered mass still further by eliminating nearly all but the carbon from the tree mass.
Whether it is actually better than burning the wood and capturing the CO2, or just burring the tree depends on the specific details of the actual process used, which depends on available technology. It may be that burning the entire tree, capturing the CO2 and burying can actually give a net energy surplus per tonne of Carbon sequestered relative to other methods.
More probably, it may give an economic advantage in that the wood can be burnt in coal fired power stations fitted with CCS and the costs avoided in early write offs of those plants as we move away from coal may make an otherwise less efficient process better cost wise.
-
Tom Curtis at 11:30 AM on 14 January 2016Tracking the 2°C Limit - November 2015
I have responded to Angusmac @37 on a more appropriate thread.
Moderator Response:[PS] thank you for cooperation. Would all other commentators do likewise please.
-
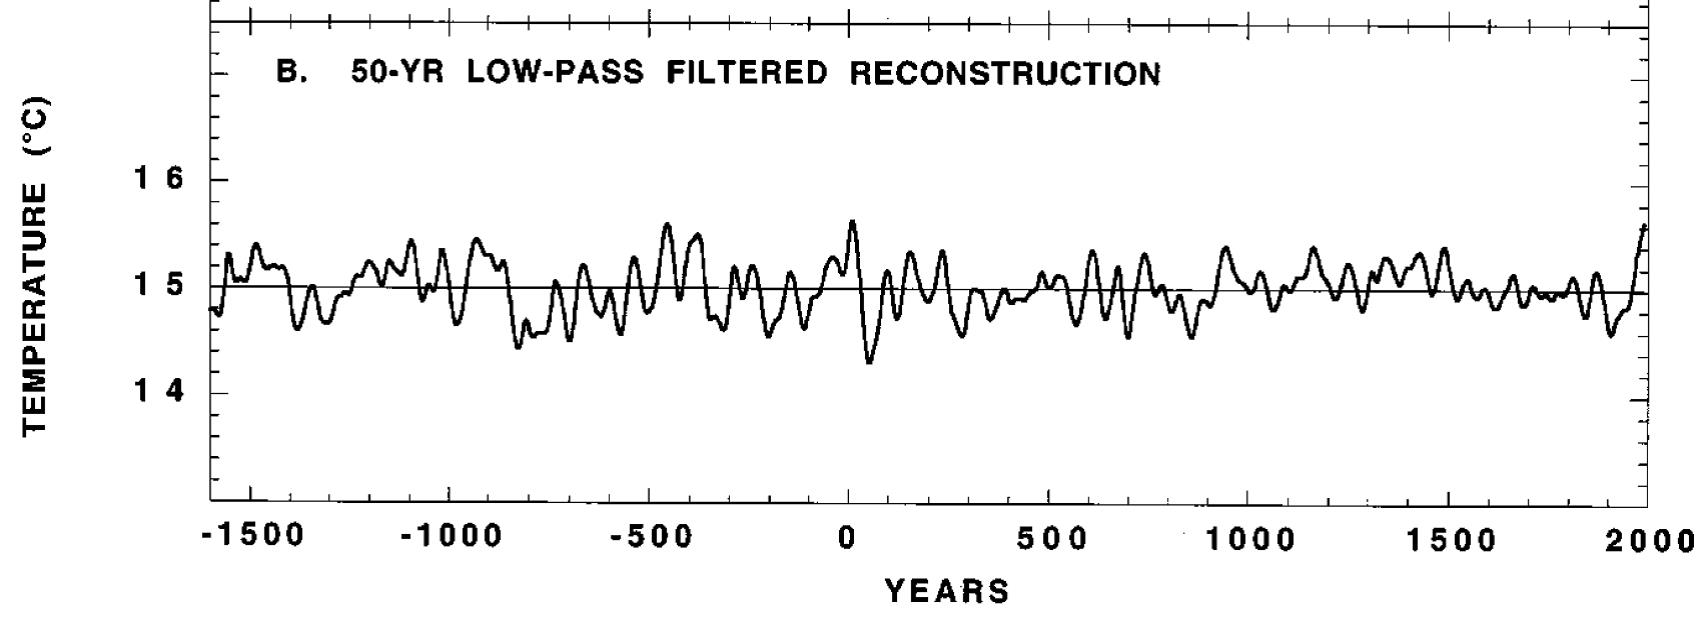
Tom Curtis at 11:28 AM on 14 January 2016Medieval Warm Period was warmer
This is a response to Angusmac elsewhere.
Angusmac, I distinguished between three different meanings of the claim "the MWP was global":
"Was the GMST durring the MWP warm relative to periods before and after? ... Were there significant climate perturbances across the globe durring the MWP? ... Were temperatures elevated in the MWP across most individual regions across the globe?"
In response you have not stated a preference to any of the three, and so have not clarrified your usage at all. In particular, while your citing of the AR5 graphs suggests you accept this first meaning, you then go on to cite the Luning and Varenholt google map app, which suggests you accept also the third, false meaning. Your question as to whether or not I believe the MWP was global remains ambiguous as a result, suggesting you are attempting to play off agreement on the first definition as tacit acceptance of the third, and false position.
With regard to the Luning and Varenholt google map app, KR's response is excellent as it stands and covers most of what I would have said. In particular, as even a brief perusal of Luning and Varenholt's sources shows, the warm periods shown in their sources are not aligned over a set period and include colder spells within their warm periods which may also not align. Because of the possible failure of alignment, any timeseries constructed from their sources proxies will probably regress to a lower mean - and may not be evidence of a warm MWP at all. (The continuing failure of 'skeptic' sources such as Soon and Baliunas, CO2Science and now Luning and Varenholt to produce composite reconstructions from their sources in fact suggest that they are aware that doing so will defeat their case - and have taken a rhetorically safer approach.)
In addition to this fundamental problem, two further issues arise. The first is that Luning and Varenholt do not clarrify what them mean by "warm" on their map legend. One of their examples helps clarrify, however. This is the graph of a temperature reconstruction from Tasmanian tree rings by Cook et al (2000) that appears on Luning and Varenholt's map:
They claim that it shows a "Warm phase 950-1500 AD, followed by Little Ice age cold phase." Looking at that warm phase, it is evident that only two peaks within that "warm phase" rise to approximately match the 1961-1990 mean, with most of the warm phase being significanly cooler. It follows that, if they are not being dishonest, by "warm phase" they do not mean as warm as the mid to late twentieth century, but only warmer than the Little Ice Age. That is, they have set a very low bar for something to be considered warm. So much so that their google map app is useless for determing if the MWP had widespread warmth relative to late 20th century values or not.
As an aside, Cook et al stated "There is little indication for a ''Little Ice Age'' period of unusual cold in the post-1500 period. Rather, the AD 1500-1900 period is mainly characterized by reduced multi-decadal variability." Evidently they would not agree with Luning and Varenholt's summary of the temperature history shown in that graph over the last one thousand years.
The second point is that it amounts to special pleading for you to accept the IPCC global temperature reconstruction that you showed, which is actually that of Mann et al (2008), but to not then also accept the reconstruction of spatial variation on MWP warmth from Mann (2009) which uses the same data as Mann (2008):
Apparently the data counts as good when it appears to support a position you agree with, but as bad when it does not. If you wish to reject Mann (2009), you need also to reject the reconstuction in 2008 and conclude that we have not reliable global temperature reconstruction for the MWP (unless you want to use the PAGES 2000 data). If, on the other hand, you accept Mann (2008), end your special pleading and accept Mann (2009) as our best current indication of the spatial variation of MWP warmth.
-
Glenn Tamblyn at 11:25 AM on 14 January 2016The Quest for CCS
Ryland
In principal no since you grow trees, sequester their carbon and crow more trees. However, there are still lots of issues with BECCS. The land area required that competes with agriculture, nutrient requirements to maintain the growth potential of that land, then the need to transport the biomass to the power stations, then transport the captured CO2 to another site for sequestration.
In one sense BECCS is a misnomer. It should actially BECCRRS - Bioenergy Carbon Capture, Release, Recapture and Sequestration.
When we harvest the plant crop we have already captured the carbon! Then we take it to a power station, release it through combustion, recapture it (but not all of it) from the smoke stack, then sequester it.
Maybe a simpler approach is to simply take the organic matter and directly sequester that! The tonnage required would be lower - by mass organic molecules such as cellulose have a higher proportion of carbon than CO2 does. -
Andy Skuce at 11:23 AM on 14 January 2016The Quest for CCS
ryland:
Yes.
See John Upton's excellent series Pulp Fiction and the UK DECC report on biomass life-cycle impacts.
-
Andy Skuce at 11:17 AM on 14 January 2016The Quest for CCS
wili:
The potential for catastrophic leakage from CCS wells that fail is certainly a serious concern. There are, though, some differences in scale and rate between what is happening at Porter Ranch and the tragedy at Lake Nyos. I understand that the rate of gas release in California is about 1200 tons per day (please forgive the Wiki references), whereas, the Lake Nyos release was a very sudden eruption of 100,000-300,000 tons of CO2, basically three months to a year's worth of the California gas leak in less than a day, as the entire lake catastrophically degassed like a shaken Champagne bottle.
I'm not exactly sure what would happen in the case of a CCS well blowout and I suspect nobody else is either, since it has never happened. There have been CO2 blowouts from mines and wellbores (and some have caused fatalities), but a CCS blowout might be different because the CO2 is likely stored in the form of a super-critical fluid. My understanding is that when such a fluid is subjected to depressurization and changes to the gas phase, it causes a refrigeration effect (the Joule–Thompson effect), which slows the degassing process and forms ice, dry ice and hydrates which may also block or slow the flow. See Bachu (2008). I believe that the expectation is that a failed CCS well will sputter out gas, seal itself and then sputter out more gas in a cycle, as the rock and wellbore cools and warms up again.
In other words, a failed CCS well might not be as bad as Porter Ranch and is very unlikely to be a catastrophe as bad as Lake Nyos. Having said that, I'm probably not alone in not wanting to live in a valley below a big CCS operation, because might not be as bad and very unlikely to be a catastrophe is not reassuring enough. If CCS is ever to be deployed at the scale that some of the modelers envisage, then among the required tens of thousands of projects, involving who-knows-how-many injection wells, unexpected disasters are certain.
-
ryland at 10:45 AM on 14 January 2016The Quest for CCS
Wouldn't the use of biomass be somewhat self defeating as the use of living trees not only has an impact environmentally but also reduces the global carbon sink capacity
-
wili at 10:09 AM on 14 January 2016The Quest for CCS
As current events in California indicate, gas 'stored' in underground wells does not necessarily stay there. If the gas escaping from Porter Ranch had in fact been CO2, and if had been a quiet night, there may have been no need for an evacuation--everyone in the valley below would have been suffocated to death in their sleep. (As happened at Lake Cameroon's Lake Nyos in 1986.)
-
Kevin C at 09:26 AM on 14 January 2016Surface Temperature or Satellite Brightness?
John Kennedy of the UK Met Office raised an interesting issue with my use of the HadCRUT4 ensemble. The ensemble doesn't include all the sources of uncertainty. In particular coverage and uncorrelated/partially correlated uncertainties are not included.
Neither RSS and HadCRUT4 have global coverage, and the largest gaps in both cases are the Antarctic then the Arctic. Neither include coverage uncertainty in the ensemble, so at first glance the ensembles are comparable in this respect.
However there is one wrinkle: The HadCRUT4 coverage changes over time, whereas the RSS coverage is fixed. To estimate the effect of changing coverage I started from the NCEP reanalysis (used for coverage uncertainty in HadCRUT4), and masked every month to match the coverage of HadCRUT4 for one year of the 36 years in the satellite record. This gives 36 temperature series. The standard deviation of the trends is about 0.002C/decade.
Next I looked and the uncorrelated and partially correlated errors. Hadley provide these both for the monthly and annual data. I took they 95% confidence interval and assumed that these correspond to the 4 sigma width of a normal distribution, and then generated 1000 series of normal values for either the months or years. I then calculated the trends for each of the 1000 series and looked at the standard deviations of each sample of trends. The standard deviation for the monthly data was about 0.001C/decade, and for the annual data about 0.002C/decade.
I then created an AR1 model to determine what level of autocorrelation would produce a doubling of trend uncertainty on going from monthly to annual data - the autocorrelation parameter is about 0.7. Then I grouped the data into 24 month blocks and recalculated the standard deviation of the trends - it was essentially unchanged from the annual data. From this I infer that the partially correlated errors become essentially uncorrelated when you go to the annual scale. Which means the spead due to partially correlated errors is about 0.002C/decade.
The original spread in the trends was about 0.007C/decade (1σ). Combining these gives a total spread of (0.0072+0.0022+0.0022)1/2, or about 0.0075 C/decade. That's about a 7% increase in the ensemble spread due to the inclusion of changing coverage and uncorrelated/partially correlated uncertainties. That's insufficient to change the conclusions.
However I did notice that the ensemble spread is not very normal. The ratio of the standard deviations of the trends between the ensembles is a little less than the ratio of the 95% range. So it would be defensible to say that the RSS ensemble spread is only four times the HadCRUT4 ensemble spread.
Prev 505 506 507 508 509 510 511 512 513 514 515 516 517 518 519 520 Next


