


 Arguments


Recent Comments
Prev 508 509 510 511 512 513 514 515 516 517 518 519 520 521 522 523 Next
Comments 25751 to 25800:
-
chriskoz at 07:21 AM on 1 January 2016Alberta's new carbon tax
You underscore the high 65 tonnes per capita emissions in AB (much higher than national 15 tonnes), blaming its tar sand industries, rich McMansions.
But figure 7 shows that Saskatchewan emissions be even higher (I'm eyeballing 68 tonnes per capita). So, AB with all its tar sands does not seem to be the biggest problem in CAN.
Where do all those incredible emissions in SK come from? Why, in your analysis of CAN mitigation pledge, do you concentrate on AB, the second biggest polluter but ignore SK, the biggest one?
Or am I reading Figure 7 which show record emissions by SK, wrongly?
-
A Buoy-Only Sea Surface Temperature Record Supports NOAA’s Adjustments
dazed - As per the Karl et al article and supplemental materials, the buoys were given a higher weighting when computing the SST due to their lower noise level, as in the referenced Smith et al 2008 paper (which you state you have read?). Not to counteract differing trend lines, as you posit, but explicitly to emphasize the best data in the merge. The supplemental data is quite clear on that.
Note that removing a constant bias due to sampling method doesn't in any way force the various trends to be colinear; that would require an offset and (unjustified) scalar changing over time.
Regarding correlations, note that ERSSTv4 correlates much better with the buoys than ERSSTv3b, both in trend and in details of the anomalies, as shown in the OP:
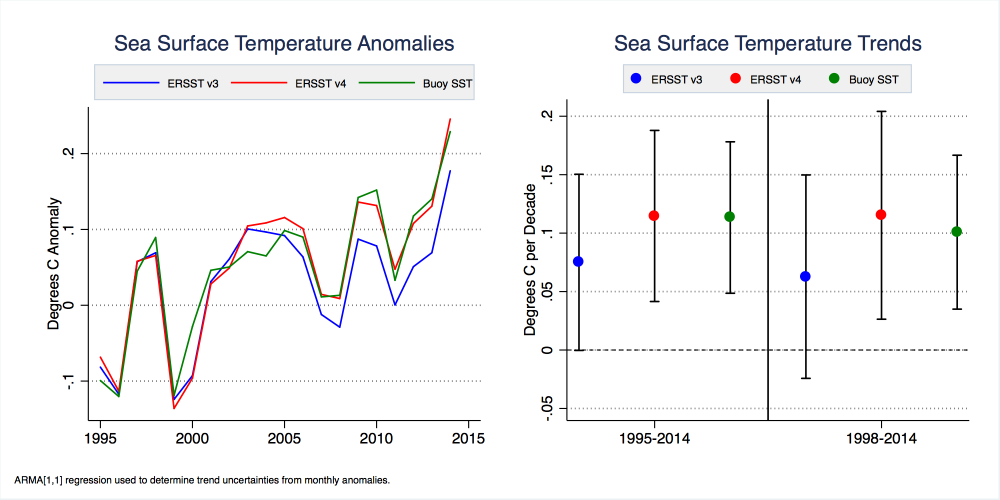
So that work has already been done. If you want to run your own stats on the correlations, go ahead - but ERSSTv4 is clearly an improvement.
"I claimed that it would be better to compare buoy vs. ship data if you're trying to validate the NOAA adjustments" - That is, in fact, the basis of Karl et al, comparing those data sets to see how to merge them properly.
---
Again, I'm not seeing any meat in your issues with Karl et al, or for that matter the Hausfather and Cowtans article regarding it. Rather, I'm seeing what I think are several misconceptions best addressed by carefully reading Karl and the earlier Smith papers and supplementals.
-
Rob Painting at 06:00 AM on 1 January 2016A Buoy-Only Sea Surface Temperature Record Supports NOAA’s Adjustments
dazed & confused - " 3) I claimed that a better test of fit between 2 time series is a test of correlation, not comparing the trends. Again, I think this is pretty standard stuff. I'm not sure what statistical analysis I would do to convince you."
This is a key issue, you've made this claim repeatedly, but provided no statistical analysis that this approach would be a better estimate of the true temperature anomalies. All these measurement methods have spatial and time-varying biases. The buoy data, for instance, have been demonstrated to have greater precision than the ship data. The buoys have become the dominant source of data in recent times and the ship data have dwindled, so wouldn't we logically expect to see the correlation between these two measurement methods grow worse in time? The trends will diverge. You seem to be claiming they'll remain the same. Hence I'd like to see some analysis that supports your assertions. If all I get is another wordy reply then I can only surmise that you cannot back up your claims with actual number-crunching.
"Threatening me with a mod intervening seems like a strong-arm tactic. Are these the tactics you use to smash anyone who doesn't agree with your point of view?"
See the comments policy - specifically sloganeering. Needless repetition of a meme constitutes sloganeering. Whether a moderator chooses to intervene is another matter, but I suspect your continual failure to back up repetitious claims with actual analysis may draw a moderator's attention.
"I don't even think I've ever claimed anything about the hiatus"
No, but I suspect it was mentioned purely for troll value because the 'pause' is a common myth amongst AGW deniers. Continued sea level rise amply demonstrates how absurd that whole myth is. -
Duaney at 05:57 AM on 1 January 2016Rapid climate changes more deadly than asteroid impacts in Earth’s past – study shows.
What we know from all the comments is that the Earth will have episodes of warming and cooling, all by itself, regardless of mankind. Some of these events will be rapid or slow, depending on the cause. The rapid change's are associated with mass extinctions. There is evidence that man's emmissions are causing a rapid change. But I'm not certain that the Earth isn't warming all by itself regardless of man, or that man's activities causing warming isn't preventing the next ice age. It's all so speculative.
-
paulchevin at 05:08 AM on 1 January 2016Myles Allen: Can we hold global warming to 1.5°C?
Thanks Tom. I appreciate you taking the time to post that.
It appears that David Archer's model is based on a single large addition of CO2 to the atmosphere and it therefore isn't directly comparable to the gradual increase (currently around 2ppm per year) that we're seeing in reality. Much of the CO2 we've added to the atmosphere over the past century or so will surely have already undergone the most rapid phase of ocean absorption.
Thanks again,
Paul
-
dazed and confused at 04:17 AM on 1 January 2016A Buoy-Only Sea Surface Temperature Record Supports NOAA’s Adjustments
Suggestion to improve the buoy-ship bias number.
I'm beginning to suspect that you (plural) aren't understanding my arguments, and that's why I'm getting kind of general criticisms rather than specific refutations. Perhaps I'm wrong, perhaps I'm not explaining myself very well, or perhaps it's because it's New Years.
Indulge me, let's try this:
I have a suggestion how to improve the buoy-ship bias. I think we'd agree that would be a good goal if possible. This is in no way a condemnation of what was done with the buoy-ship bias in ERSST4 (I think this was the best thing about the new version, by the way). It's very possible that my suggestion sucks. Could someone on this board explain back to me what I'm getting at, and then comment whether they think this is a good suggestion or not?
In the supplemental materials, Karl explains how he checked the ship adjustments (discussed above). He compared the trends of the buoy only data with the adjusted ship only data. The difference in trends was .002C. This means that the trends were essentially parallel. Of course, this is before the ship-buoy bias is added.
What occurs to me is that the vertical difference between these two trends is probably the best possible calculation of the ship-buoy bias ever done (I'm calling this the Karl ship-buoy bias). To the extent that the trends are parallel, the use of a constant for the ship-buoy bias is justified.
What would be the result of using the Karl ship-buoy bias? It would ensure that the resulting ship and buoy trends would be colinear! When marrying two different time series, it doesn't get sweeter than that.
What would be even better is if the Karl ship-buoy bias = .12C. That would be unlikely for several reasons, the least of which is not that the standard error on the bias is something like .03C (I think, it's not critical to this discussion).
What would be the result of not using the Karl ship-buoy bias, but using the .12C bias? The two trend lines would be separated by a small distance (Karl -.12C, obviously). The old familiar affect from the change of the mix of data would still occur (obviously much smaller than with no ship-buoy adjustment at all). Using the Karl ship-buoy bias would remove this affect entirely.
This explains a phenomenon that puzzled me up until this point, which is how I hit upon this idea. Karl states that when he gives the buoys more weight, this changes the overall trend by ~.01C. Imagine that the ship and buoy data trend lines were colinear. Changing the weight back and forth from ship to buoy should have no effect on the final trend, since both trends are the same.
However, if the trends are offset slightly, then changing the weight would make a small difference.
Up until now, I never understood the rationale behind the weight adjustment. Now I'm thinking that it's possible that it was done to counteract the effect of the slightly offset trend lines. If this is the case, using the Karl ship-buoy adjustment would remove the need for the weight adjustment altogether.
-
dazed and confused at 03:03 AM on 1 January 2016A Buoy-Only Sea Surface Temperature Record Supports NOAA’s Adjustments
@ Rob Painting
Really?
Look at the claims I made:
1) It took 8 years from the time NOAA was developing and testing the buoy bias until they implemented it. I cited the stuff. What statistics do I need to back up this claim?
2) I claimed that it would be better to compare buoy vs. ship data if you're trying to validate the NOAA adjustments, since this would remove the autocorrelation bias inherent in the method used by Hausfather and Cowtan. It seems to me that anyone familiar with statistics would understand that. Apparently Karl understands; it turns out that's what he did (see my post above). Ask Karl for statistics on this one.
3) I claimed that a better test of fit between 2 time series is a test of correlation, not comparing the trends. Again, I think this is pretty standard stuff. I'm not sure what statistical analysis I would do to convince you. If you're in doubt, I suppose I could hunt down a source.
The only thing I can think of where your point could be valid is the thing about "finer space and time corrections do not seem to be possible with the limited in situ data available." I pointed out what appears to be attempts to do what is claimed to be impossible. Do you expect me to run some analysis to decide this issue? I even mentioned that I could be wrong for several reasons, and I asked for help from the board in understanding this apparent contradiction. Haven't seen anything. Not that anyone owes me anything, but I was hoping.
I have even tried to help by suggesting ways to could defeat my arguments where possible. I don't know what more I can do.
If there is something I've claimed that needs statistical analysis, could you point it out?
Something to consider:
I started looking at this issue because a denier friend (I can call him a denier, he's ok with that) brought it up. I love science, and have since before I could read. When I started digging, I couldn't believe what I saw. I mean, this is NOAA. Surely I must be wrong. What am I missing? I've been on this site before, and thought it would be a great place to challenge my conclusions. It was not an easy decision, since I knew I'd get plenty of blow back (not complaining, it's your site, I'm the "uninvited" guest).
I wish eclectic would take one of the stones out of his pyramid and put me out of my misery. Surely there must be something in that pyramid that can easily refute what I've been saying. Restore my confidence in the pyramid! Please, show me that I'm wrong. I'll congratulate you. Honest.
Telling me I'm one nobody against the "experts in the peer-reviewed scientific literature", or about the power of the pyramid doesn't help me. Threatening me with a mod intervening seems like a strong-arm tactic. Are these the tactics you use to smash anyone who doesn't agree with your point of view?
I don't even think I've ever claimed anything about the hiatus or AGW, so I'm not even sure that I've said anything that disagrees with your point of view (I am not pretending that I know your mind, of course). My concerns are simply with methodology.
-
One Planet Only Forever at 02:54 AM on 1 January 2016Alberta's new carbon tax
One minor clarification or correction. The claim that Alberta is the 'wealthiest' province needs clarification.
Even when oil prices were higher the GDP of Alberta was lower than Ontario, and only slightly higher than Quebec's (2014) (Stats Can Reported GDP)
Per-Capita the Alberta GDP was the highest among the provinces but the North West Territories actually had the highest per-capita GDP (Wikipedia summary of per-Capita GDP).
And the dramatic drop of oil and natural gas revenue in 2015 will likely drop Alberta in the ranks.
-
StBarnabas at 02:13 AM on 1 January 2016The strong economics of wind energy
KeithPicketing @16. You state "first, solar and wind generators don't last that long." Your figures for wind are completely credible. When I researched PV whilst installling my 3kWp system in 2008 it was very difficult to get definitive figures on PV lifetimes. I would be very interested in seeing some estimates. I also have an evacuated tube solar thermal hot water system and again lifetime figures would be very interesting. Can you point me to any decent references?
-
keithpickering at 01:01 AM on 1 January 2016The strong economics of wind energy
Digby,
Cost is still important no matter how you slice it. In the first place, we will be able to build more non-fossil energy, faster, using the lowest-cost alternatives. In the second place, energy provides leverage that makes all other economic activities possible. Expensive energy therefore is a drag on the economy.
-
Rob Painting at 23:25 PM on 31 December 2015A Buoy-Only Sea Surface Temperature Record Supports NOAA’s Adjustments
dazed & confused "If I provide my name and address will you be more convinced?"
No, but if you could provide some statistical analysis to support your claims that would be a nice start. As it stands we have the published scientific literature versus some bloke on the internet unwilling to provide any sort of statistical analysis to support his bold claims. You can appreciate how underwhelming that might look to readers.
Sure you can continue to cast aspersions, until a moderator intervenes at least, but you're really going to have to back up your claims with some number-crunching if you're going to convince anyone that you have a better handle on this than the experts in the peer-reviewed scientific literature.
-
dazed and confused at 20:34 PM on 31 December 2015A Buoy-Only Sea Surface Temperature Record Supports NOAA’s Adjustments
What Karl says
I'm an idiot, and feel free to call me that, at least for a couple of posts.
While I read Karl's paper, I failed to look at the supplemental materials. I was looking for some justification of the buoy weighting, and I couldn't find much in either Karl or Huang. So I looked in the supplemental materials. While looking for that, I found this:
To evaluate the robustness of this correction, trends of the corrected and uncorrected ship data were compared to co-located buoy data [my emph] without the offset added. As the buoy data did not include the offset the buoy data are independent of the ship data[even if it did, it wouldn't matter, since it's simply a constant]. The trend of uncorrected ship minus buoy data was -0.066°C dec-1 over the period 2000-2014, while the trend in corrected ship minus buoy data was -0.002°C dec-1. This close agreement in the trend of the corrected ship data indicates that these time dependent ship adjustments did indeed correct an artifact in ship data impacting the trend over this hiatus period.
www.sciencemag.org/content/suppl/2015/06/03/science.aaa5632.DC1/Karl-SM.pdf
This is the analysis I was looking for. If you want to validate the correction, you should compare ship to buoy data. This is exactly what I wanted to do with Reynolds' buoy correction (I mentioned this before), but there was only a single number for a decade. What's more, the approach uses the co-location approach (which I believe, but can't prove, is better) rather than the grid system of this article. Good for Karl.
Unfortunately, there are still problems with Karl's work:
1) No confidence intervals.
2) Not easily reproducable. Where is the data and code that calced this? If a stat package was used, at least step by step instructions to reproduce the results would be nice.
3) As discussed before, comparing the trends is a weak test of fitness.
Karl's paper is specifically aimed at dispelling the hiatus. So perhaps he is justified in only being concerned with trends. That's too bad. A golden opportunity was missed. Here's what I mean:
Filtering and adjusting time series data is tricky. Fortunately, in an area like communications, you can put a test signal through, tune your circuit, and look at the signal coming out. You tweak the circuit until you get the best signal possible.
When dealing with historic data, there is no test signal. Usually there is no good way to know if you've "tweaked the circuit" correctly (Ok, there are certainly some statistical tests, but that's not the same). Fact of life. To deal with this effectively, you must be especially rigorous and check everything you can, but there's always doubt. It makes NOAA's job hard. You can see NOAA "tweaking the circuits" from version to version when they use different (more advanced) filters.
In the past, NMAT adjustments only went up to WWII. Now, with ERSST4, the tail end coincides with the buoy era. Validating the NMAT adjustments as Karl did above not only helps confirm the trend during the "hiatus" period, it also helps validate the NMAT adjustments made in the past. In the analogy above, consider the buoy data to be something akin to a test signal.
If NMAT adjustments proved to be valid, that would be fantastic! The adjustments are much bigger before WWII, and having greater confidence in NMAT adjustments would mean greater confidence in the data of that era.
But even more. There is major descrepancy in the ship adjustment between ERSST4 and HADSST3. Showing the NMAT adjustment to be valid would also indicate that it would be the preferred method, compared to the laborious calculations and poor quality data used by HADSST3 for this.
If, on the other hand, the adjustments aren't so good, that means there's a potential for more science to do.
So, why wouldn't you put these adjustments through the most rigorous test possible? If they really work well, you should be able to get a great correlation between buoy and ship data (same comparison as Karl did, but with the additional test). I don't know what software he used, but mathematical packages have correlation calculations built in. Why not run that and see what happens? I'll do it if someone sends me the data.
I have some additional confusion about this topic, but I'll save it for another post.
-
Tom Curtis at 19:30 PM on 31 December 2015Myles Allen: Can we hold global warming to 1.5°C?
paulchevin @13, a slightly simplifief schematic of the rate of draw down of CO2 over time, with the main processes distinguished, is provided by David Archer:

As you can see, the initial drawdown through 'Ocean Invasion' is very rapid, and occurs over a few hundred years. As it happens, the vast majority of the rise in temperature to the Equilibrium Climate Response occurs on approximately the same time scale. Consequently, if there are no new net emissions, the effects approximately balance.
Despite that rapid initial drawdown, a significant fraction of CO2 remains in the atmosphere for 100s of thousands of years due to the very slow rate of chemical weathering ('Reaction with ignious rocks'). The amount that remains over that period will be somewhere between 10 and 30% depending on which model is most accurate, and (more importantly) the quantity of total emissions. If we restrict total emissions to a trillion tonnes of Carbon, the range is about 8-20% retained, while for
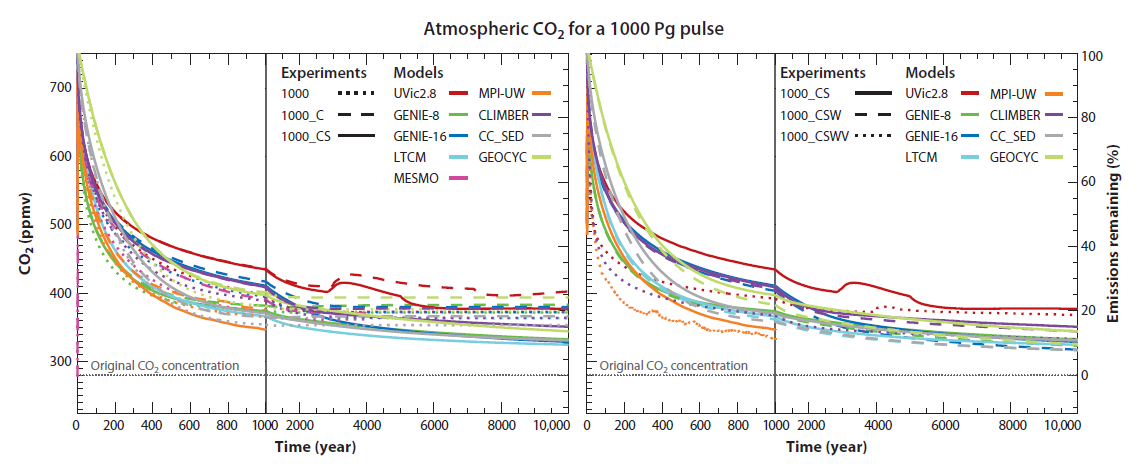

(Figures from Archer et al 2009)
1 trillion tonnes of Carbon is the effective limit to keep global temperatures below 2 C, while 5 trillion tonnes represents a more or less BaU scenario. That is the more important distinction because we cannot control which model will turn out to be most accurate, but we can control our total emissions.
Finally, and as an aside, the 'Reaction with CaCO3' also almost completly restores pH levels so that ocean acidification is a geologically temporary problem - but biologically a very long term problem indeed.
-
paulchevin at 18:19 PM on 31 December 2015Myles Allen: Can we hold global warming to 1.5°C?
Tom Curtis @6. For some days now I've been puzzling over your comments about natural drawdown of CO2.
I was under the impression (quite possibly incorrectly!) that natural drawdown is a slow process that takes place over thousands of years. If that is true, we would surely expect temperatures to carry on rising for some time after we stop emitting greenhouse gases due to thermal inertia and long term feedbacks. Also, if there is appreciable release of CO2 and methane from the permafrost and clathrate, this would be expected to take greenhouse gas concentrations and hence temperatures higher still.
Are you saying there are mechanisms for natural drawdown which operate on a short enough timescale to counteract this warming "in the pipeline"? If so, what are they and please can you point me to some further reading on the subject?
Thanks.
-
Eclectic at 18:13 PM on 31 December 2015A Buoy-Only Sea Surface Temperature Record Supports NOAA’s Adjustments
Dazed & con. @ #37 ,
My apologies for not explaining myself to you in a way that is more "water-tight". I was (and still am) rather reluctant to undertake the very lengthy amplification that would be necessary to eliminate all possible misunderstandings / misinterpretations of my comments. A lengthy discourse would derail the thread from its proper topic . . . and yet, I will post a few comments now, because they may indirectly assist the thread to proceed more efficiently. (And I hope they will be of general interest, anyway.)
Because of my (intended!) brevity, I must ask you yourself to meet me halfway ~ and not look for minute exceptions and "legal loopholes" ( where we could spend endless time wrangling about over-fine points . . . wrangling in a manner dear to the heart of Lord Monckton! ) .
~ First: your quote, "What I was trying to say was that I agreed that a contrarian argument would require more proof, but that whether or not (either way), the requirements for presenting the case should be the same, including citations." [unquote]. My reply ~ fair enough, where the opposing cases are roughly equal ( or at least, within a few miles of equality! ). But in the present case, of climate science versus contrarian ideas, the comparison is very much more like Round Earth Hypothesis versus Flat Earth Hypothesis. Here, it is very reasonable for the established/proven science to pass over the requirement for continually repeated citations (etc) . . . while holding the "challengers" to an asymmetrically higher standard. Unequal, but fair. The very-thoroughly-established science should not be expected "to drop a cannon ball off the Tower of Pisa" day after day and every day!
~ On Lord Monckton, and his "intellectual" activity : If you were previously unaware of that gentleman, then my kindly-meant advice is that you avoid the time-waste of reading his expositions (unless you find some entertainment value in observing some of the follies mankind is capable of). I am sure that no lawyer would assess Monckton as failing to meet the legal standard of sanity . . . yet I am less sure that psychologists would be unanimous on whether he meets the intellectual standard of it.
~ (lastly) : re my quote, ". . . a true skeptic cannot be a contrarian. Nowadays, to be a contrarian is to be a denier of evidence . . . "
(and your own quote), "Isn't that what they told Einstein? Or was it Schrodinger, I can't remember. Oh, wait, maybe it was Hubble. If you conclude that you (or what you believe in) are so right that anyone who opposes you can't be . . . [etc] ".
Hmm, Mr Dazed, you were being a bit naughty there (though I appreciate your restraint in not throwing Galileo into the pot, as well! )
No, the cases you mention, from the early or adolescent days of fundamental physics/astronomy . . . are not at all a reasonable comparison to the huge "pyramid" of modern climate science. The appropriate comparison is something like the Round Earth Hypothesis ~ where the overall picture is something proven beyond reasonable doubt : and where the "contrarian" must be a denier of evidence.
Yes, I paint with a broad brush : but the exceptions (if any) are terribly few . . . and probably also afflicted with a form of the Monckton mindset.
(Again: my apologies for my insufficiency of brevity.)
-
uncletimrob at 15:25 PM on 31 December 2015Climatology versus Pseudoscience book tests whose predictions have been right
I'm a bit late to this thread but have purchased are read your book Dana. In summary an informative read with lots of background that I was not aware of. My only "criticism" is the US-centric nature of some parts, but I completely understand why that is so.
A couple of times you mentioned the difference between AGW debate and that of the "tobacco wars". I wonder whether the main difference is that now anyone with internet access can start a blog/website/forum on whatever their pet belief/theory/gripe is, get lots of links to other likeminded people and hence get read and quoted.
Back in that day of big tobacco denying the science, this kind of fast communication with no filter was virtually impossible. A lack of filter is something that educators like me battle with constantly when students givs us "stuff" that is frankly wrong, but served up to them in a believable manner.
Just a thought. Thanks again for a very readable and informative book. Tim
-
David Lewis at 15:23 PM on 31 December 2015Why we need the next-to-impossible 1.5°C temperature target
Elizabeth Kolbert has a piece in the New Yorker "The Siege of Miami". An exerpt:
"Scientists who study climate change (and the reporters who cover them) often speculate about when the partisan debate on the issue will end. If Florida is a guide, the answer seems to be never. During September’s series of king tides, former Vice-President Al Gore spent a morning sloshing through the flooded streets of Miami Beach with Mayor Levine, a Democrat. I met up with Gore the following day, and he told me that the boots he’d worn had turned out to be too low; the water had poured in over the top.
“When the governor of the state is a full-out climate denier, the irony is just excruciatingly painful,” Gore observed. He said that he thought Florida ought to “join with the Maldives and some of the small island states that are urging the world to adopt stronger restrictions on global-warming pollution.”
Instead, the state is doing the opposite. In October, Florida filed suit against the Environmental Protection Agency, seeking to block new rules aimed at limiting warming by reducing power-plant emissions. (Two dozen states are participating in the lawsuit.)
“The level of disconnect from reality is pretty profound,” Jeff Goodell, a journalist who’s working on a book on the impacts of sea-level rise, told me. “We’re sort of used to that in the climate world. But in Florida there are real consequences. The water is rising right now."
-
Sunspot at 12:44 PM on 31 December 2015Why we need the next-to-impossible 1.5°C temperature target
There is so much confusion over what weather phenomenon to "blame" on global warming. So, these types of weather happened before global warming: rain, snow, wind, hurricanes, tornados, droughts, floods, sleet, freezing rain, el ninos, cold winters, warm winters, cold summers, hot summers... All bau on planet Earth! What AGW does is to cause shifts in weather patterns. It makes the probability of more extreme weather higher. With a bias towards higher temperature extremes. So when people say, for instance, "el nino is a natural phenomenon", that is, of course, completely correct! However, we are currently experiencing the strongest el nino in recorded history. Very likely the result of AGW. As is most of the extreme weather that is happening with increasing frequency all over the planet. That's the whole point of the concern over AGW.
-
Rolf Jander at 12:39 PM on 31 December 2015Why we need the next-to-impossible 1.5°C temperature target
It is terrible what is happening in England. Ancient bridges washed away. Villagtes flooded. I wonder what is happening to the wildlife. Here in Vancouver, we are are luckily having great weather. But I agree that there is no sense of urgency from the public on global warming. There seems to be more concern about what mitigation will cost them right now than what climate change will cost ( in more ways than money) in the long run.
-
Digby Scorgie at 12:37 PM on 31 December 2015The strong economics of wind energy
There's another way to look at this: To avert a climate catastrophe we just have to eliminate the burning of fossil fuels — whether we like it or not, and regardless of the cost. Arguing about the cost is therefore irrelevant.
Sooner or later, assuming we want to avert the catastrophe, we have to end up with a mix of renewable sources of electricity, some nuclear power, some electric vehicles, and synthetic fuels for other transport. Is that or is that not our ultimate goal?
-
dazed and confused at 12:33 PM on 31 December 2015A Buoy-Only Sea Surface Temperature Record Supports NOAA’s Adjustments
@Eclectic
You have asked some profound questions that touch on the philosophy of science that has spurred a lot of thinking on my part on how best to answer you. I owe you an answer on this, but I don't have time right now.
Let me address a couple of other minor points meanwhile:
The pyramid is nowadays so huge . . . that a true skeptic cannot be a contrarian. Nowadays, to be a contrarian is to be a denier of evidence ~ and so, impervious to science-based persuasion.
Isn't that what they told Einstein? Or was it Schrodinger, I can't remember. Oh, wait, maybe it was Hubble. If you conclude that you (or what you believe in) are so right that anyone who opposes you can't be, aren't you guilty of exactly what you are accusing contrarians of?
Practically speaking, I know a contrarian that I am pretty sure is open to persuasion. He's as far off the edge as it gets; he emails me articles that take things out of context and claim things like "Kerry admits that any US efforts to reduce carbon are futile." Recently, I discussed with him what I've read so far. He hasn't renounced yet, but he didn't reject the case for AGW out of hand either. He certainly was willing to listen to reason. I believe if confronted with enough evidence (which I don't yet have a handle on), he could be persuaded. I don't think it's a good idea to paint contrarians (or anyone else, for that matter) with too broad a brush.
Moncktonian methodology
Believe it or not, I had to look that up. I guess Monckton is some arch enemy of global warming, so I suppose it wouldn't be good to Gish Gallop too much.
Seriously, I appreciate you friendly criticism. I aim to stay relevant. #27 was a response to Kevin C, and I pretty much responded paragraph by paragraph. Maybe I should have quoted him more to make that obvious?
I would actually appreciate more specific criticism on this point, but I'm not sure this comment section is the best place, as it would be way off topic, and probably boring for most besides. Perhaps as a compromise, if you find me erring too far in this direction in the future, let me know.
Thus triggering my question: "As either way as what?"
What I was trying to say was that I agreed that a contrarian argument would require more proof, but that whether contrarian or not (either way), the requirements for presenting the case should be the same, including citations.
-
keithpickering at 11:38 AM on 31 December 2015The strong economics of wind energy
In addition to the caveats mentioned by stevecarsonr, there are also these factors to consider:
1. The source of LCOE presented here, Bloomberg New Energy Finance, is in the business of selling stock in renewable energy companies. In other words, they have an agenda. There are many, many sources for LCOE calculations, so one must wonder why this particular one was chosen. For example, EIA, a branch of the US DOE, does their own annual computations and gets quite different results. But even better is to not use any single analysis at all, but use a combined result of many different analyses, such as the OpenEI Transparent Cost Database, which includes Bloomberg, EIA, and many other sources as well.
2. LCOE in general can be a deceptive metric because it is designed for investors, not for policy makers. In particular, LCOE assumes a single lifetime for loans which is generally the same (and generally 30 years) across all technologies. This is problematic in two ways: first, solar and wind generators don't last that long. The National Renewable Energy Laboratory assumes 20 years for each, and actual data from Denmark confirms a mean lifetime of wind turbines of 22 years. Therefore it is unlikely banks would give 30 year loans to these projects. Second, and more importantly, using a single lifetime for all generators unfairly handicaps long-lived generating technologies (primarily hydro and nuclear) and unfairly benefits short-lived technologies (wind and solar). A hydroelectric dam can last a century or more, and most of that power is produced long after the loan is retired. That's a huge benefit to society (and to the climate) that is not reflected in LCOE.
3. "Systems costs" for renewables, such as extra grid connection costs, and extra load-balancing costs, are generally excluded from LCOE. However, the OECD has computed these costs for various technologies and their results can be found here.
4. One other factor not mentioned is that for intermittant renewables, costs will rise significantly as market penetration increases beyond the "curtailment point", which is the point at which renewables are capable of generating the entire system load. (The curtailment point is roughly equal to the capacity factor of the technology). Once renewables are built beyond that point, their capacity factor must decrease, which increases price. Since capacity factors for wind and solar are low, expect that point to be reached fairly early in the process.
Even before getting to that point, however, economic factors may severely limit deployment of wind and solar. That's because they are weather-dependent, meaning that when weather is favorable the market will be saturated with oversupply, driving wholesale electricity prices down. Consumers paying retail will not feel that, but producers certainly will: it's hard to make money if you're always selling your product at rock-bottom prices, and these conditions may make investors leery of investing in solar and wind as market penetration increases.
-
Tom Curtis at 11:10 AM on 31 December 20152015 SkS Weekly Digest #52
GeoffThomas @1, without wasting my time on a full hour of 'solar denier' pseudoscience, I draw your attention to 5:52 of the video where Robitaille says, as his first knock down argument that the Sun is not a gas, that "gas cannot give us a continuous spectrum". Of course, he is wrong. Ionized gas, aka, 'plasma' can give a continuous spectrum, as in this example from a sulphur plasma lamp:

Except for small quantities near the surface areas, all the gas in the Sun is, of course a plasma.
Not only is it the case that plasmas glow with a continuous spectrum, but because their component parts are charged, the acceleration of charged particles cause light to be emitted, and the particles in a plasma accelerate and de-accelerate based on collisions in a thermal gas, they must glow in a continuous spectrum. It is only when in a bound state that quantum energy levels restrict emissions to discrete spectra.
Evidently Robitaille builds his evidence based on his limited knowledge within his specialty without bothering to check his strong claims in areas he is unfamiliar with. Apparently that cavalier attitude to facts has also helped him in propogating his theory that the Cosmic Background Radiation "...are actually observations of a glow from Earth's oceans".
It occurs to me you may not be happy with this abrupt dismissal of Robitaille. Fine. Do your homework. Summarize the key points of his argument for yourself instead of rellying on others. Link to easilly accessed presentations of his theories (by which I mean papers - videos are massively time wasting and Robitaille's presentation style makes his more time wasting than most). And then raise your points. But don't just post a link with a question, which in addition to being time wasting for others, is forbidden in the SkS comments policy.
-
GeoffThomas at 10:17 AM on 31 December 20152015 SkS Weekly Digest #52
Appropos of the sun going the other way, - the which I am not disputing for a micro-second, I came across this you-tube talk, you will need a while to listen to it explaining why the Sun is not a ball of burning gases, I would appreciate any comment from anyone on it.
"The Sun is not a hot ball of gas - it is condensed matter. Professor Pierre-Marie Robitaille on the Liquid Metallic Hydrogen Sun: https://www.youtube.com/watch?v=0Lg5eR7T61A&feature=share
-
dazed and confused at 09:06 AM on 31 December 2015A Buoy-Only Sea Surface Temperature Record Supports NOAA’s Adjustments
@KR
I forgot to address your issue about what are my concerns with the NOAA adjustments.
I haven't gone into them for a few reasons:
1) My concerns center primarily around the NMAT ship bias adjustments. This is a considerably more involved topic than the things I've already brought up. I haven't been on this board before, so I wanted to test the waters. If I was only going to get propaganda, I wouldn't want to waste your time or mine.
2) Since they are more complex issues, I wanted to wait until I gained a little experience in arguing my points. The feedback and counter arguments here have helped a lot.
3) I was worried about being on topic. My criticism of this article is clearly on topic. My criticism of NOAA's delay to incorporate ship-buoy bias probably isn't, but maybe close, and isn't too involved. My criticism of the NMAT ship bias adjustments almost certainly is off topic. Unfortunately, I don't know anywhere else on this site to discuss it, so I'm kind of at a loss.
It will take me a bit of time to write up those concerns. If you want to prepare (ha! :) ), you could read Karl concerning the effect these adjustments have made, and the ERSST4 paper, and especially take a look at figures 5 and 6 and the accompanying text. Perhaps you'll be able to anticipate my concerns.
-
michael sweet at 08:40 AM on 31 December 2015The strong economics of wind energy
The OP mentions small wind set ups. I lived on a sailboat with both solar and a wind generator and I found that the solar was much easier to use. When the wind turbine generated power it often generated a lot of power, but sometimes we had no wind for long periods.The solar output was limited by the number of panels, but it was consistent every day. It was easy to adjust the power used to the number of panels. If we needed more power we bought another panel. The smallest solar is also much cheaper than small wind generators so it works well in undeveloped areas where people have little capitol.
The most important issue with the wind turbine was that when there is enough wind to generate a significant amount of power there is a lot of wind. At sea we almost always had a large excess of wind energy. Sailboats at anchor seek out locations that are protected from the wind. Therefore at anchor there is usually not much wind (we spent most of our time anchored). How many houses do you see built on the windy sides of ridges? More houses are built in sheltered areas. The areas where wind is best for generation are usually not very good for building houses because they are too windy. Utility setups also cover each other by setting up over large areas, as described in the OP. Small setups cannot cover each other that way, since they are small.
-
dazed and confused at 08:09 AM on 31 December 2015A Buoy-Only Sea Surface Temperature Record Supports NOAA’s Adjustments
@KR
1) "A Buoy-Only Sea Surface Temperature Record Supports NOAA’s Adjustments". Simply showing that it's better than ERSST3B is not a sufficient condition for demonstrating this, unless by "supports" you mean something weak like "might show". If I make small random adjustments to ERSST3B, I'd have something like a fifty-fifty chance of improving it, if the measure of success is whether the trend got closer to the buoy trend.
Showing that two time series trends more or less correlate is not the same as showing that the two time series correlate. I can draw an infinite number of point sets that all have the same trend as the buoy data. I think you'd agree that some of these would be better fits to the buoy data than others. The way to find the best fit is looking at correlation of the series, not correlation of the trends. Perhaps a statistician would care to comment on this?
I have explained what I think would be necessary to improve this paper.
2) Impossible standard. From the time the buoy adjustment was known (Reynolds, 2010) to the time of it's incorporation, it took 5 years, and that is considering that it was a known issue in ERSST3 (2007), which said, "At present, methods for removing the ship–buoy bias are being developed and tested."
So handling this adjustment was already underway to the point of testing in 2007.
I can understand the adjustment taking a while to calculate, as it involves somewhat complicated programming to extract and analyse the data. Doesn't 3 more years seem like a long time? Maybe the testing went badly. Note that the result of .12C wasn't far from what was initially projected in 2007 (.12C vs .1C). Even using .1C would have made the data better.
Once the adjustment was known, it was a simple matter of adding a constant to a subset of temperature readings. If it took a month, I might be persuaded. A year for this? OK. Why didn't it make it into ERSST3b? Five years? I don't think I'm asking for an impossible standard. Can you explain why it took 8+ years overall? If so, I will reconsider.
Note that from 2005 (ERSST2) to ERSST3 (2007) the entire satellite bias adjustment was added, which is considerably more complicated than the ship-buoy bias.
Best possible data: I have argued that ERSST3 did not contain the best possible data. I haven't seen a counter argument. Go look. Until you can show this, I don't think your claim is justified.
The caveat. Have you actually read any of ERSST3 (Smith et al)? From the abstract, p. 2283 : "These improvements allow better analysis of temperatures throughout the record, with the greatest improvements in the late nineteenth century and since 1985[emphasis added - the time of the ship-buoy bias adjustment]."
There is no mention at all of the ship-buoy bias issue until page 2289, where it is given two paragraphs starting on the bottom of the second page of a section titled "d. Bias-adjusted satellite SSTs", sandwiched between a discussion of remote and locally based satellite bias adjustments and biases in the XBT.
If I were a researcher interested in SSTs at the time, why wouldn't I use NOAA data (unless maybe I was from England)? My peers use it. Based on the abstract, I would feel pretty confident that I was using good data. Since my research would be on the changes of migration patterns of sperm whales due to ocean warming, I probably wouldn't read through the paper looking for possible caveats; I would trust the NOAA data implicitly. Even if I did somehow make it to this paragraph 7 pages in, there's a good chance I wouldn't understand it, since my area of expertise was marine biology.
-
dazed and confused at 06:30 AM on 31 December 2015A Buoy-Only Sea Surface Temperature Record Supports NOAA’s Adjustments
@Zeke Hausfather
Let me repeat what I said to Kevin C. It's a honor to have you reply to my comments.
Thanks for the good questions; science should always be skeptical
Very good.
the NMAT-based ship corrections don't introduce any detectable trend bias relative to the buoy-only record
Excellent goal, and what I am especially interested in. Maybe I can use this as an example:
Consider 2015. Your calculated value for ERSST4 will be very close to the buoy data, since 90%+weight of ERSST4 is composed of buoy data for that year. If the NMAT-based ship corrections introduced any change at all, it would be very hard to detect above the noise.
Go back a year, and you'll find almost the same thing. If you go back far enough (~2000) the ship data will start to become a significant factor, and hence the NMAT corrections will become more of a factor, and somewhat easier to identify over the noise.
Perhaps you can see some of this from your time series graph. The correlation is excellent for ERSST4 and buoy in recent years, but not as good in prior years. This is what I would expect if the NMAT and other adjustments didn't correlate so well with buoy data, but it's only a graph.
So, for the purposes of this goal, wouldn't it be better to use ship vs. buoy? Then, even in 2015, 100% of the difference would come from NMAT and other adjustments, making their affect much more pronounced.
I agree that in a perfect world we would have created a separate ship-only record to compare to our buoy-only record to better assess the magnitude of buoy bias. However, thats not really what we were focusing on for this project.
What I'm arguing above is that it would also be better for illuminating the NMAT corrections, which apparently is of interest for you (and certainly for me).
In fact, as soon as I had read the NMAT adjustment stuff in Huang, I thought "that should be easy to check". Why not compare recent ship data with the buoy data. If the bias was the same year to year, this would imply that NMAT adjustments shouldn't be made for that period since the ship-buoy bias would suffice.
Then I remembered that I had just read about that in the buoy bias adjustment in Kennedy. I turned to the appendix, and was dissapointed to find that there was only a single number covering the period in question. I then thought, maybe others have done something similar year by year. Then I read: "finer space and time corrections do not seem to be possible with the limited in situ data available", so I didn't look for anything else. (Is there such a thing?)
That was what attracted me to this article.
This brings up a question, again, that I have already asked, but hopefully you can address: How is it that you are able to make a time series comparison of buoy to ERSST4, when Kennedy can't do the same for buoy to ship?
This initial blog post was more of a rapid response to the politically-inspired criticism of NOAA
Then why show it at AGU? Were there a lot of contrarians there?
This site, rightfully, does not allow commenting on other's motives, so I have been careful to stay away from that. You stated what I guessed, and it explains a lot.
You may be familiar with Harvard science historian Naomi Oreskes assessment regarding the “seepage” of climate skeptic argumentation to affect the formal scientific literature. It seems that you are letting the contrarian argument affect your science.
The focus of your article is on the trends. I am not a statistician, but in analysing time series data, I haven't usually seen such a focus on the slope as much as on the correlation (and error thereof) of the two series. Your time series graph shows this, I guess, but I can't form any statistically significant conclusions from eyeballing this graph.
If you are interested in arguing against the contrarians, your focus makes sense: validate that the trend of ERSST4 shows no hiatus (aka matches the buoy data). No wonder you didn't use ship vs. buoy, or any other type of analysis comparing the two time series rather than just the trend.
IMHO, that's too bad. What I would hope for is an article that isn't so much concerned about the trend, and more concerned with making sure the NOAA adjustments were the best damn adjustments possible. I would have found that much more helpful. Isn't the ultimate goal to coax out the best data possible?
-
A Buoy-Only Sea Surface Temperature Record Supports NOAA’s Adjustments
dazed - Regarding your (most recent) questions:
1) The post title is "A Buoy-Only Sea Surface Temperature Record Supports NOAA’s Adjustments", and it does just that - demonstrating that ERSSTv4 is a better match to the buoy data than ERSSTv3b, that the corrections in ERSSTv4 are indeed supported by that buoy data. I really don't see what you're complaining about there. See Zeke's post here.
2) Best practices were followed by releasing the best data available with caveats (ERSSTv3b), and by releasing an updated version of ERSST (again, with appropriate caveats) when the updated version became available. Those updates required considerable work and validation of technique, as per Karl et al. You seem to feel that the proper corrections were somehow instantly obvious and should have been published long ago, which I consider an unrealistic if not impossible standard.
Going back to your earlier posts, if you have actual issues with adjustments and corrections made to the SST records, it would be helpful if you actually stated what those objections were, rather than repeating these impossible demands for instant perfection in the published records.
-
CSFenwick at 04:51 AM on 31 December 2015Why we need the next-to-impossible 1.5°C temperature target
I'm all for being positive about Paris despite the warts, but there is no sense of urgency and no appreciation by the public of the scale of the task at hand. Here in the UK we're currently experiencing record breaking weather with widespread flooding yet there's little mention in the press about the connection with climate change. it's all down to the El Nino apparently. Lots of people are finding out first hand that the 1C or so of warming we've had to date isn't safe - you don't need to live on a low lying island to be flooded. Meanwhile the government talks about flood defences and passes laws to frack under national parks. We desperately need credential carrying climate scientists on the news explaining the reality. All the congratulations post Paris lead the public to believe the job's done.
-
dazed and confused at 04:35 AM on 31 December 2015A Buoy-Only Sea Surface Temperature Record Supports NOAA’s Adjustments
@Rob Painting
Thanks for clarifying about the graph.
an anonymous person on the internet
If I provide my name and address will you be more convinced?
By my count, I've made 2 claims about science.
1) This article does not do a good job of doing what the title says. Two ways I would improve it would be to compare ship to buoy directly, and to do a correlation analysis rather than simply looking at the trend. I would be very interersted in the results of that analysis. I don't think either has been disputed. The first has been apologized for (too hard, in a perfect world, see H&C's comments above regarding this), and the second hasn't been addressed, I don't think.
2) NOAA did not follow best practices by releasing data with known, unaccounted for bias, and by not releasing the correction as soon as possible. I don't think this point has been refuted, although it has been addressed. I even offered a reasonable way to show that I was wrong.
Could you give me some idea of what kind of analysis you have in mind?
-
Rob Painting at 04:10 AM on 31 December 2015A Buoy-Only Sea Surface Temperature Record Supports NOAA’s Adjustments
dazed & confused - "@Rob Painting. That's an interesting graph. I'll have to take a look at the context. I assume that this a rebuttal to my argument based on the quote...."
No, the image and link to the Kennedy paper is primarily for other readers. Kennedy et al (2011) goes into excrutiating detail of the many issues in constructing a sea surface temperature record. The image demonstrates that the engine room intakes (ERI) run warmer than other measurement methods - which was mentioned in the original post.
As it stands we have the scientific literature versus an anonymous person on the internet. No data set is perfect, nor any time series reconstruction but until such time as you provide some analysis to support your claims the credibility of your arguments won't carry any weight. -
BaerbelW at 02:16 AM on 31 December 20152015 in Review: another productive year for the Skeptical Science team
Thanks Jonas (@3) for your feedback and donation! Also thanks for tirelessly plugging Skeptical Science in that German MOOC you mentioned - I noticed the many threads and comments you posted there to counter those who continuously tried to spread FUD (fear, uncertainty and doubt).
Happy new year to you too!
-
Zeke Hausfather at 01:41 AM on 31 December 2015A Buoy-Only Sea Surface Temperature Record Supports NOAA’s Adjustments
Hi dazed and confused,
Thanks for the good questions; science should always be skeptical (hence the name of this site!), so there is no harm in pushing for clarification.
I agree that in a perfect world we would have created a separate ship-only record to compare to our buoy-only record to better assess the magnitude of buoy bias. However, thats not really what we were focusing on for this project.
We wanted to look at whether or not ERSST v3 or v4 was more accurate in recent decades. The main differences between the two are the buoy adjustments and the NMAT-based ship corrections. Both of these issues arise from the fact that the network is composed of inhomogenous sensors; ships themselves are not easily intercomparable as they don't all have the same instrument and engine room configurations, and buoys and ship engine intake valves are clearly different instruments.
However, there are relatively homogenous instruments available: buoys themselves. They have nearly identical sensor setups across all the buoys, and should provide a relatively unbiased estimate of SSTs in areas where buoys are present. Thus buoys provide a good test for ERSST v3 vs. v4: whichever one is more similar in trend to the unbiased buoy-only record should be the more accurate one, at least for the period of overlap with buoys.
As you can see in our results, ERSST v4 is effectively identical to the buoy-only record, telling us both that the buoy corrections employed in v4 are accurate (and remove the ship-buoy transition bias present in v3), and that the NMAT-based ship corrections don't introduce any detectable trend bias relative to the buoy-only record, at least in grid cells containing both ships and buoys.
Our intent wasn't to evaluate Kennedy's work on buoy-ship differences; rather, it was to evaluate the effectiveness of the corrections in the new version of ERSST. For that the buoy-only record provides a useful test, even if its not independent of the ERSST records.
There is interesting future work to use this and other datasets to compare ERSST and HadSST in more detail, but that will likely take the form of an academic paper rather than a blog post. This initial blog post was more of a rapid response to the politically-inspired criticism of NOAA, essentially pointing out that their results in recent years (and the resulting increase in trend) tend to make ERSST as a whole more similar to relatively homogenous series like buoys or ARGO floats.
-
Acouphène at 01:38 AM on 31 December 2015Just how ‘Sapiens’ in the world of high CO2 concentrations?
How fast dioxygen decrease with respiration in a room of 10m² with 1 person ?
-
Jonas at 01:09 AM on 31 December 20152015 in Review: another productive year for the Skeptical Science team
Fits better here than the news roundup, so reposting this snippet here:
I just donated (twice the amount of last year). You folks deliver an incredible source on climate change and I at least want to help cover costs of the site. I recently took a german online course on climate science to evaluate links and material and of course there were deniers. What would I have done without this site? I painfully remember the days before I came to know it. Deep bowing and a happy new year!
-
Jonas at 00:54 AM on 31 December 20152015 SkS Weekly News Roundup #52
Since I cannot/do not comment on Facebook: we may need 500,000 km2 for Solar PV. The sahara has 9,400,000 km2 (https://en.wikipedia.org/wiki/Sahara ) . No problem there.
However: do we have the minerals to do so? What are the ecological consequences of that? More generally: interesting article (in German) regarding this: Prof. Hans-Peter Dürr said, we might need to stabilize energy use at 8TW for entropy reasons, the limit being determined through exceeding the natural biodiversity loss rate.
--
Translation (by me):
The Ziegler eco number (translated citation from a book of Ziegler):
"In a study by Wolfram Ziegler in which the antropogene loss of biological species is valued as an important indicator for technical civilisation over burdening of natural systems, the interesting claim was made that the antropogene and in last recourse thermal average energy flow per time and surface can effectively be used to measure ecological burden. For central Europe he deduces a maximum limit burden of ± 20 kW/km2 or 0,16 ± 0,02 W/m2.
It is interesting to compare this limit burden with the average solar surface radiation in Germany of 116 W/m2. The burden limit is 0,1%.
More telling however seems a comparison with the (previously) estimated average of solar induced biomass of 0,65 W/m2 (which amounts to 0,5 % of the solar surface radiation). This means, that the maximum ecoloogical burden of commercial energy use is 20% of the sun induced biomass. For the globe, an overall burden limit through antropogene technically provided energy of 8 TW can be extrapolated"
From: Hans Peter Dürr 1993, Zukunft, Page 161
---
(My own comment from a german post, translated):In his article “The 1,5kW society” (“Die 1,5 kW-Gesellschaft”) Prof. Dürr puts in relation the above Ziegler eco number of 20% “admissible" (solar) energy resp. 8 TW with the (former) 5,5 billion world population: sustainability would thus be achieved with the living standard of an average swiss citizen as of 1969. Today, we are already 7 billion people and many do not live like swiss citizens in the 50s or 60s ..
Prof. Dürrs “The 1,5kW society” (german)
http://gcn.de/download/D15KW.pdf--
Original german text:
Die Zieglersche Ökozahl:"Wolfram Ziegler hat in einer Studie, in welcher der anthropogene Ausfall biologischer Arten als wichtiger Hinweis für die technisch-zivilisatorische Überbelastung der natürlichen Systeme gewertet wird, die interessante These vertreten, daß der anthropogene und letztlich thermische durchschnittliche Energiefluß pro Zeit- und Flächeneinheit effektiv als Kausal- und Kenngröße für die Umweltbelastung geeignet sei. Für Mitteleuropa kommt er hierbei auf eine maximale Grenzbelastung von 160 ± 20 kW/km2 oder 0,16 ± 0,02 W/m2.
Es ist interessant, diese ermittelte Grenzbelastung mit der in Deutschland im Mittel am Boden einfallenden Sonnenstrahlung von 116 W/m2 zu vergleichen. Die Grenzbelastung liegt hierzu bei etwa einem Promille.
Aufschlußreicher erscheint vielleicht ein Vergleich mit dem früher abgeschätzten Mittelwert für die sonnen-induzierte Biomasse von etwa 0,65 W/m2 (also etwa 0,5 % im Vergleich zur am Boden ankommenden Sonnenstrahlung). Dies bedeutet, dass der ökologisch maximal verträgliche kommerzielle Energieumsatz bei etwa einem Fünftel der im Mittel durch Sonnenenergie gebildeten Biomasse liegt. Für den Globus ließe sich daraus eine Grenzbelastung durch anthropogene, technisch aufbereitete Energieumsätze in Höhe von insgesamt 8 TW extrapolieren.
aus: Hans Peter Dürr 1993 Zukunft S. 161"---
In seinem Artikel "Die 1,5 kW-Gesellschaft" setzt Prof. Dürr obige zieglersche 20% "zulässige" (Sonnen-) Energie bzw. 8 TW bei (damals) 5,5 Mrd Weltbevölkerung in Relation zu damaligen Konsumzahlen: nachhaltig wäre demnach der Lebensstandard eines Schweizers im Jahre 1969. Heute sind wir schon 7 Milliarden Menschen und viele leben längst nicht mehr wie die Schweizer in den 50ern und 60ern ...Prof. Dürrs "Die 1,5kW Gesellschaft"
http://gcn.de/download/D15KW.pdf--
Off topic: I just donated (twice the amount of last year). You folks deliver an incredible source on climate change and I at least want to help cover costs of the site. I recently took a german online course on climate science to evaluate links and material and of course there were deniers. What would I have done without this site? I painfully remember the days before I came to know it. Deep bowing and a happy new year!
-
Eclectic at 23:20 PM on 30 December 2015A Buoy-Only Sea Surface Temperature Record Supports NOAA’s Adjustments
Kevin C @ #25, Thank you for a fine reply.
Dazed & con. @ #26, Please be as long-winded or brief, as you wish. Please though, be careful not to succumb to the Moncktonian Malady of endless buzzing around points of trivial importance ( combined with his usual Gish Gallop that approaches "word salad" status ). Indeed, if I may provide a friendly caution ~ your reply #27 shows a leaning towards the Moncktonian methodology. I would like to think that, having noted the danger, you will be able to pull back from the brink!
On your final point [of #26] : of science being "just as [rigorous] either way" . . . you have used a rather ambiguous or confused phrase. Thus triggering my question: "As either way as what?"
To explain more clearly where I am coming from about that ~ please let me propose the far-from-novel point that the mainstream climate science is a sort of large pyramid composed of a "consilient myriad" of blocks. Blocks of somewhat varied rigour [ but not, I hope, including rigor mortis ;-) ] which are mostly gradually improving in rigour individually . . . and which altogether have formed a large and unmistakable pyramid.
Is the pyramid now (in your words) decently "rigorous"? Yes, it is. The whole is greater than the sum of its parts. In other words, the consilience is very great. Furthermore, there are no other pyramids in sight. Not even micro-pyramids. Nor dream'd of. (Please excuse the non-rigorous Shakespearean quote! )
But to return to your point ~ the mainstream-science pyramid is a proven pyramid . . . and it is up to the claimants (for any new pyramids) to demonstrate their pyramidal existence, moderately rigorously. Demonstrating by any reasonable means, with or without citations. It is the context, the bigger picture, which is important. ( Hence my interest in why you yourself would wish to focus on a single block of stone. )
(b) Does this SkS website exist to convince "contrarions" or even contrarians? No, I don't think it does have that purpose. It exists to convince skeptics i.e. those open to reasonable evidence and reasoned argument.
The pyramid is nowadays so huge . . . that a true skeptic cannot be a contrarian. Nowadays, to be a contrarian is to be a denier of evidence ~ and so, impervious to science-based persuasion. Rather like with the Flat-Earther situation.
-
Kevin C at 23:01 PM on 30 December 2015A Buoy-Only Sea Surface Temperature Record Supports NOAA’s Adjustments
You would simply be comparing buoy data to buoy data, which would tell us nothing about ship adjustments. There have to be some affects of NOAA adjustments in the period of your study for your study to have anything to say about them.
What we've done is shown that the ERSSTv3b data are inconsistent with the most reliable subset of the ERSSTv3b data, where 'most reliable' is in turn verified by intercomparison of proximate observations
By contrast, ERSSTv4 is not inconsistent with the most reliable subset. The changes, including the changes to the weights and the adjusments, have prevented the combination of the ship and buoy data from corrupting the recent record. We don't in this work distinguish whether the improvement is due to the weights or the ship adjustments.
Oh, I see, you're concerned about the word 'adjustments' in the title. If you prefer we could substitute 'new record'?
-
dazed and confused at 21:46 PM on 30 December 2015A Buoy-Only Sea Surface Temperature Record Supports NOAA’s Adjustments
@ Kevin C
I suppose this may seem odd considering some of my posts, but I feel honored that you responded to my questions.
I came to this site hoping to discuss issues with people who would be able to refute or confirm my ideas based on reason and argument. I could not have hoped for better.
OK, that said, I'd like to respond:
The reason for not comparing to the ship-only record is that the ERSST ship only record is not distributed as gridded data
A justifiable reason for not doing the best science possible is not because it is hard. How did Reynolds do his ship-buoy analysis? Surely there must exist some way to extract/recreate/etc this data.
Further a ship only record does not include the ship-buoy transition bias
What's the issue, you can't add in .13C? Or subtract, which ever way you do it.
I'm not really qualified to give much of an opinion about science-media issues, but that hasn't stopped me before. A couple of problems I see with your approach:
If any self claimed scientist can respond in the media, won't that just produce noise? Wouldn't you have to filter? How would you do that?
Shouldn't more weight be given to a peer reviewed paper than one that was not, even from a prominent scientist? How would you communicate that subtlety via the media?
Incidentally, my problem is not with you writing this paper, but more with this website essentially claiming it is fact. And less of that, if someone like you is willing to explain/defend it.
Good that data and code are available. It might be illuminating for me to take a look.
I'm glad for you that Karl showed your work at AGU. Congratulations, I'm sure that's quite an achievement (I'm not trying to be sarcastic, I mean what I said). Please don't be dissapointed that I'm not impressed from a credentials point of view that Karl decided to show something that verified his work. A hypothetical: if your work did not support NOAA's adjustments, would Karl still have shown it? (Don't feel obliged to speculate).
It is interesting that you mention HadSST3. I have some further problems with the NOAA adjustments concerning the "bucket" bias. It had the biggest impact on the recent data of any of the ERRST4 adjustments. As you probably are aware, the big difference between HadSST3 and ERSST4 is that very adjustment. I'd like to discuss these issues, but I'm not sure this is the corret place on the site for that.
In which case you are arguing that ERSSTv4 is already, to a close approximation, a buoy only record for the recent period.
Somewhat. What I am saying is that to the extent that ERSST4 does approximate the buoy only record, it will tend to correlate well with that record, regardless of what adjustments were made to the ship data. So the fact that you show correlation is not much of a confirmation of the adjustments, which was only done to a small portion of the data.
In which case the NOAA adjustments to the SST record play no significant role in the post-1995 trend, because the buoy records are unadjusted.
This is as wrong as it can be. If it were true, then your work would have nothing to say about confirming NOAA's adjustments. You would simply be comparing buoy data to buoy data, which would tell us nothing about ship adjustments. There have to be some affects of NOAA adjustments in the period of your study for your study to have anything to say about them.
It would be true if the ratio of ship to buoy data points stayed the same for the entire period. However, since this ratio changes significantly from 1995 to the present (~50% to ~90%), the NOAA adjustments will have almost no affect in the present, but a larger affect back in 1995. This is the reason that the buoy adjustment changes the trend during this period. I think I've seen pages on this site that explain it better, but that's the gist. Also explained as far back as ERSST3, as someone on this page has already pointed out.
In fact, according to Karl, the change in trend due to the NOAA adjustement from 1998 is .056 C/decade.
-
dazed and confused at 20:07 PM on 30 December 2015A Buoy-Only Sea Surface Temperature Record Supports NOAA’s Adjustments
@Eclectic
You ask some good questions. My wife tells me I'm longwinded, so I'm afraid if I answered you in full, I'd fill up this blog. I'll try to be brief. If I don't answer your questions to your satisfaction, let me know, and I'll be happy to go into more detail.
You make two general points. The first has to do with why I am so concerned about a seemingly trivial subject. The second is more or less a rebuttal of my use of the comments policy. I will address each in a different comment.
Comments policy stuff
Going in, I understood that many (all?) on this site will not agree with many of the things I post. To make things worse, I can imagine that many on this site are frustrated from having to dismiss the same old tired arguments from people who don't have the decency to look throught the items in the thermometer before posting.
When I began posting, I got a lot of replies that seemed like knee-jerk responses, which is very understandable: here comes yet another hiatus bozo to deal with. Unfortunately, this didn't help me to address what I believe to be scientific issues. I used the "stay on topic" policy to try to put a stop to those. In hindsight, perhaps I could have thought of a better way to accomplish that. Happily, recent comments have been addressing issues I've raised.
Perhaps I went to far in my criticism of this article being on this site. I was frustrated to find that I had spent a lot of time on what is essentially a blog post.
First, I certainly would expect articles on a site like this that haven't been peer reviewed. Summaries, explaining things in laymens terms, suggesting new ideas, discussing old ones. Sure.
But this article doesn't fall into that category. It is an attempt to prove a point scientifically. That's another matter.
A question for you: What is the purpose of this article? If this website is about preaching to the choir, then post whatever you like. However, I don't think that's the case, or I wouldn't be here. You said, "with primary emphasis on AGW and the debunking of illogical dogma/myths." Good. It seems like this article is an attempt at debunking the hiatus by supporting NOAA's adjustments.
If you want your debunking to convince skeptics like me, or even worse, contrarions, it seems like you'd need more than a blog article, no matter how good the science appears to be. Would you be convinced by a well crafted blog post on a contrarion's site? Perhaps that's unfair, I don't know, but if you care about persuasion, I think you might want to consider what I'm saying.
A claim that runs contrary to the mainstream requires a higher level of proof than otherwise (extra-ordinary claims require extra-ordinary evidence). I don't see why the same should be true of citations. Shouldn't the science be just as rigourous either way?
-
Kevin C at 19:59 PM on 30 December 2015A Buoy-Only Sea Surface Temperature Record Supports NOAA’s Adjustments
D&C:
The reason for not comparing to the ship-only record is that the ERSST ship only record is not distributed as gridded data, which would be required. You can't draw conclusions from time series graphs alone due to the coverage issue - you need the gridded data. Further a ship only record does not include the ship-buoy transition bias, and so only contains some of the bias.
The work has not been peer-reviewed at this point. However, neither have any of the critiques of ERSSTv4. If you are suggesting that climate science can be critiqued in political events and the media, but that scientists may only respond in the peer-reviewed literature, then the public will be systematically exposed to non-evidence based positions. This is exacerbated by the fact that the media favour political material over scientific material, and tend not to be interested in later followups.
On the other hand, the Argo data are independent of our buoy-only record and are from peer-reviewed work. We also have published all of our code and data for you to review. Finally, Tom Karl of NOAA, who has appropriate expertise in the area, had sufficient confidence in our analysis to show it at AGU:
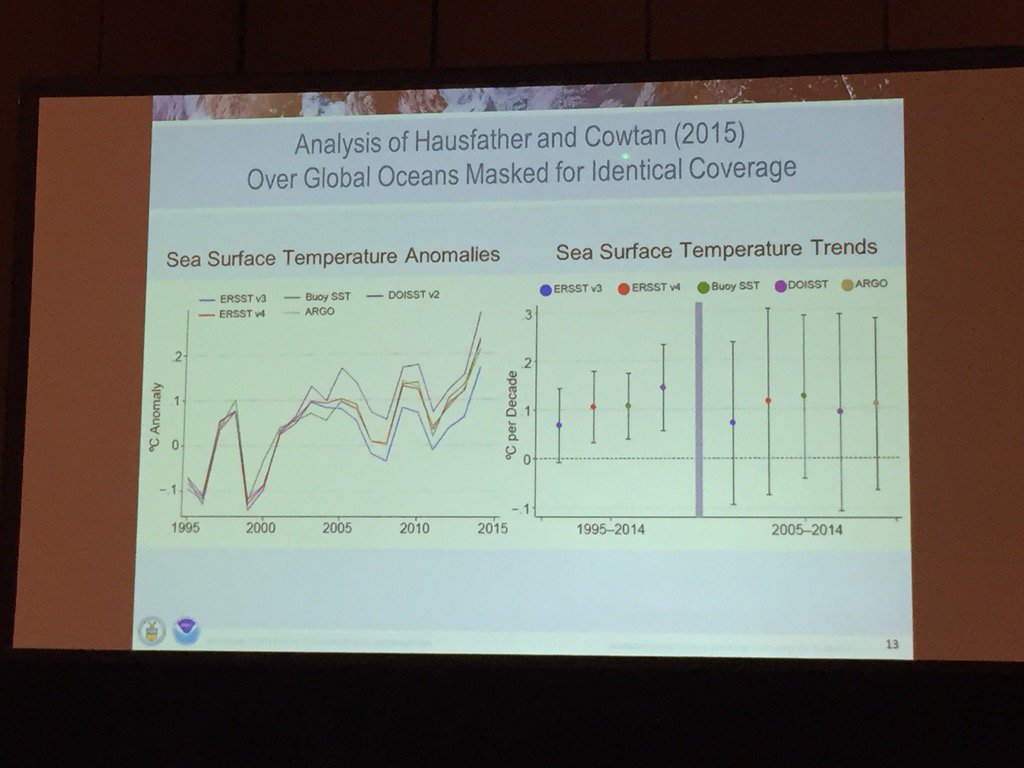
The differences between ERSSTv4 and HadSST3 are an open question. Before Zeke added the Argo analysis I had no view on which was more realistic for the post-1995 period. With the Argo analysis, I'm leaning towards ERSSTv4 being the better record for this period.
There is one part of your argument which is confusing to me: I think that you are arguing that because the buoys are upweighted in ERSSTv4, it is unsurprising that it shows good agreement to the buoy only record?
In which case you are arguing that ERSSTv4 is already, to a close approximation, a buoy only record for the recent period. I'm fine with that. In which case the NOAA adjustments to the SST record play no significant role in the post-1995 trend, because the buoy records are unadjusted. So there can be no objection to the ERSSTv4 trends being a result of NOAA adjustments.
That's a valid position. Our work is mearly an independent reproduction of the recent record using a rather different methodology which explicitly rather than implicitly excludes any adjustments, and using a minimial implementation (100 lines of code) to allow easier review.
-
dazed and confused at 18:58 PM on 30 December 2015A Buoy-Only Sea Surface Temperature Record Supports NOAA’s Adjustments
@Rob Painting
That's an interesting graph. I'll have to take a look at the context.
I assume that this a rebuttal to my argument based on the quote "These results strongly suggest that a spatial and temporal constant bias correction is needed for ship SSTs. Furthermore, finer space and time corrections do not seem to be possible with the limited in situ data available."
I am arguing that a comparison of ship to buoy data (or more correctly (ship + buoy to buoy) of the detail in the article is not reliable. In their analysis of this question, Kennedy did not use the graph you show. I could speculate as to why, but I see no point.
For some reason, he believed that a different set of calculations was in order. You can see these in the appendix.
I will concede that my argument is not strong. For one, I'm relying on the authority of one paper, albeit from a highly regarded source. Secondly, it could be that there is some reason that Kennedy's reasoning doesn't apply to the article's analysis.
-
dazed and confused at 18:37 PM on 30 December 2015A Buoy-Only Sea Surface Temperature Record Supports NOAA’s Adjustments
@KR
I appreciate your feedback. You make good points, and you certainly have the right to your opinion. Please allow me the opportunity to persuade you otherwise:
I completely agree when you say, "There is absolutely no reason not to publish the best data available..."
Did ERSST3 and 3b represent the best data available? I argue that they do not. It would have been better to use ship only data.
For the period before buoys became a significant part of the data, it would have made no difference.
For the period afterwards, using buoy data will introduce a known, but unaccounted for, bias. If the difference was negligible, then I'd agree that it didn't matter. But that obviously isn't the case. I base this on 2 observations: first, it was important enough to account for in ERSST4; second, based on Karl's paper, using buoy data without accounting for this bias resulted in an error of 0.014°C / decade in the warming trend from 1998 (his year, not mine). How can that be helpful to anyone?
If you can explain how including the buoy data without accounting for bias is somehow better than using the ship data only, I'll concede this point.
"There is absolutely no reason not to ... publish the best corrections for known issues when they are developed and incorporated."
Also agree. My issue is that this should have been done right away. There was no new theory that needed to be developed. As noted above, within a year after ERSST3 was published, a ship-buoy bias was calculated and published. Incorporating this adjustment involves adding a constant to a set of numbers. Couldn't ERSST3 have waited? At the very least, shouldn't this have been included in ERSST3b? What scientific reason was there for NOAA to wait another five years to make this simple correction?
Even worse, why wasn't this done from the beginning of ERSST? Certainly it doesn't take much to realize that ship and buoy data might be biased with respect to each other. Shouldn't this have been investigated from the start?
I would have to disagree, if the data with known flaws is published with appropriate caveats.
This is a good point.
However, what purpose did it serve to publish this data with "appropriate caveats"? How could anyone justify the use of the data in research, especially if the research involved recent years where the bias resulted in a predictable significant error?
It seems to me that this caveat was ignored by both the scientific community and others on both sides, with bad consequences. Contrarions used it to support there "pause" idea. How much time was wasted on the other side trying to deny or explain it? How many papers were written to explain the pause (apologies to Rob Painting, but I only mention it to show the harm caused by publishing data with known bias errors), and how many said, "this is a preliminary analysis based on data with known bias errors?" I haven't read a great deal of the literature, so I could be wrong.
How many other papers included ERSST3/b or its derivites in other research, and how many mentioned this caveat? Although Karl says that these papers are still valid, I don't see how this would be possible, since presumably they depend on the data in question. This means more wasted time. And as the mod pointed out, scientists don't have time to waste on foolishness.
How many graphs of ERSST3/b data have you seen, and how many have this caveat listed? To the uninformed (anyone who hasn't read ERSST3), it would be easy to overestimate the validity of the data. It seems that would be misleading.
"noting known issues leads other researchers to the very topics requiring more work"
I am familiar with this idea. For example, if you had a model that worked in some cases, but had deficiencies in others, you might publish this in the hopes that either someone might be able to take advantage of some part of the work you did, or that someone might figure out the part you were stuck on. I get it.
However, when you see NOAA in the byline, and you are dealing with one of, if not the, premier historic ocean temperature data sets, in most (all?) cases you are going to use the data without question (see above).
Incidentally, the calcuations for the buoy-ship adjustment were done by NOAA employees closely associated with ERSST. Presumably, they would have done the same work whether ERSST3 was published or not.
-
longjohn119 at 16:22 PM on 30 December 20152015 in Review: another productive year for the Skeptical Science team
Here in the Midwest of the USA we are less than 48 hrs away from knocking off 2014 as the warmest year on record globally. In 135 years of records we have never broken the global temperture record two years in a row. A question for those who deal in probabilities
What are the odds/probabability of the global temperature record being broken 2 years in a row? (I'm sure it is greater than 1 in 135)
Also since the 'downside' year of an el Nino is usually warmer than the 'upside' year what is the probability of the record being broken 3 years in a row?
-
Rob Painting at 16:08 PM on 30 December 2015A Buoy-Only Sea Surface Temperature Record Supports NOAA’s Adjustments
Here's an image from the Kennedy et al (2011) paper cited in the original post which compares, in the top panel, ERI (orange line), bucket measurements (blue), buoys (red) and all (blackline) from 1945-2006.

-
Eclectic at 15:20 PM on 30 December 2015A Buoy-Only Sea Surface Temperature Record Supports NOAA’s Adjustments
Dazed & con. ( @19, and earlier ) ,
Perhaps you could be kind enough to expand (and expound) on your concerns about the buoy data issue.
In general, data is what it is [ "are what they are"?! ] , and, as is often the case . . . can benefit from refinement, and from reinterpretation with the added advantage of hindsight. But what is somewhat unclear from your own posts, is your reason for being highly concerned about this particular buoy data issue. Not being privy to your special reason (if you have any special reason, I mean) for intense interest in the case : it seems to me, prima facie that you are addressing a rather small tree in a very large forest of "consilient evidence".
Forgive me if I am mis-interpreting the thrust of your posts : yet you appear to be giving the impression that you are wishing to be oblivious to the overall context of the buoy data.
Rightly of course, the SkS website policy "guides" posters to post exactly on the topic of the particular thread . . . but it would be impossible to have an intelligent discussion of a particular topic, without allowing some latitude in comments. That's not a failing of the website, nor of its "policy". Common sense must guide us in these matters. The website exists [ as I see it ] as a sort of interface between the science and the discussion of science-related issues (with primary emphasis on AGW and the debunking of illogical dogma/myths). Clearly it would be impractical for every sentence or paragraph to be linked to peer-reviewed literature, since such linkage would largely just be re-stating the already-known state of the science. However, it is reasonable to expect that anyone's suggestions (or assertions) contradicting mainstream science, should contain a higher level of "citation". Nothing untoward or unfair about that ~ and it is certainly not an unwarranted "double standard".
-
A Buoy-Only Sea Surface Temperature Record Supports NOAA’s Adjustments
dazed - "I maintain that publishing data with known major flaws is worse than publishing nothing."
I would have to disagree, if the data with known flaws is published with appropriate caveats. And as David Sanger noted above, it was. Publishing the best data to date, even those with known (and stated) issues that will have to be accounted for, is not only appropriate but in fact the best practice in science - noting known issues leads other researchers to the very topics requiring more work, meanwhile giving everyone the best data currently available.
"Am I being overly critical of NOAA on this?"
IMO - yes. Your concerns appear (in my view) to be quibbling and dismissal, not substantive complaints. There is absolutely no reason not to publish the best data available, nor to publish the best corrections for known issues when they are developed and incorporated.
-
dazed and confused at 13:57 PM on 30 December 2015A Buoy-Only Sea Surface Temperature Record Supports NOAA’s Adjustments
@moderator
First, I appreciate your patience with me.
I would also like to make it clear that I have no issue with the ship-buoy adjustment itself, it seems perfectly reasonable to me. My concern is that data without this adjustment should not have been published, especially considering that there were alternatives.
You said, "perhaps because in real world, you have to make the best of what data and methods you have at the time because the products have other uses besides examination of temperature trends"
What other use does ERSST have than to examine temperature trends? I'm sorry to profess ignorance in this.
What was the rush to publish this data? Wasn't there already ERSST2? I don't know the history of that version; were there major flaws in it that needed to be corrected?
I maintain that publishing data with known major flaws is worse than publishing nothing. This is a major data source for other research, and should be as accurate as possible. If they weren't ready to handle the bias, wouldn't it have been better to omitt the buoy data until they were?
You also said, "Meeting the impossible standards of pseudo-skeptics who have nothing better offer is not a realistic science goal."
Normalizing two time series data streams does not seem to me like an "impossible standard", but best pratice. The final adjustment done by Huang et al was to simply add .12C to the buoy readings. How hard was that?
The .12C adjustment was already known in 2009. See Reynolds* (referenced by Huang in the ERSST4 paper). This would have been in plenty of time for ERSST3b, at least. Why did they wait until 2015 to make this adjustment, when it could have been included in ERSST3b?
* R.W. Reynolds, C. L. Gentemann, and G. K. Corlett, 2010: Evaluation of
AATSR and TMI satellite SST data. J. Climate, 23, 152–165,
doi:10.1175/2009JCLI3252.1. -
dazed and confused at 13:18 PM on 30 December 2015A Buoy-Only Sea Surface Temperature Record Supports NOAA’s Adjustments
@Rob Painting
I only mention the hiatus to say I didn't want to consider it. If I have somehow sinned in this, then mia culpa.
I was not trying to bring the pause, or AGW, or anything else, into the discussion. If I inadvertantly did, then I apologize. Please believe that this wasn't my intent.
Rather, I was hoping to illicit responses like the ones from davidsanger and the mod in 16 that addressed my specific questions.
Prev 508 509 510 511 512 513 514 515 516 517 518 519 520 521 522 523 Next


