


 Arguments


Recent Comments
Prev 511 512 513 514 515 516 517 518 519 520 521 522 523 524 525 526 Next
Comments 25901 to 25950:
-
A Buoy-Only Sea Surface Temperature Record Supports NOAA’s Adjustments
dazed - Regarding your (most recent) questions:
1) The post title is "A Buoy-Only Sea Surface Temperature Record Supports NOAA’s Adjustments", and it does just that - demonstrating that ERSSTv4 is a better match to the buoy data than ERSSTv3b, that the corrections in ERSSTv4 are indeed supported by that buoy data. I really don't see what you're complaining about there. See Zeke's post here.
2) Best practices were followed by releasing the best data available with caveats (ERSSTv3b), and by releasing an updated version of ERSST (again, with appropriate caveats) when the updated version became available. Those updates required considerable work and validation of technique, as per Karl et al. You seem to feel that the proper corrections were somehow instantly obvious and should have been published long ago, which I consider an unrealistic if not impossible standard.
Going back to your earlier posts, if you have actual issues with adjustments and corrections made to the SST records, it would be helpful if you actually stated what those objections were, rather than repeating these impossible demands for instant perfection in the published records.
-
CSFenwick at 04:51 AM on 31 December 2015Why we need the next-to-impossible 1.5°C temperature target
I'm all for being positive about Paris despite the warts, but there is no sense of urgency and no appreciation by the public of the scale of the task at hand. Here in the UK we're currently experiencing record breaking weather with widespread flooding yet there's little mention in the press about the connection with climate change. it's all down to the El Nino apparently. Lots of people are finding out first hand that the 1C or so of warming we've had to date isn't safe - you don't need to live on a low lying island to be flooded. Meanwhile the government talks about flood defences and passes laws to frack under national parks. We desperately need credential carrying climate scientists on the news explaining the reality. All the congratulations post Paris lead the public to believe the job's done.
-
dazed and confused at 04:35 AM on 31 December 2015A Buoy-Only Sea Surface Temperature Record Supports NOAA’s Adjustments
@Rob Painting
Thanks for clarifying about the graph.
an anonymous person on the internet
If I provide my name and address will you be more convinced?
By my count, I've made 2 claims about science.
1) This article does not do a good job of doing what the title says. Two ways I would improve it would be to compare ship to buoy directly, and to do a correlation analysis rather than simply looking at the trend. I would be very interersted in the results of that analysis. I don't think either has been disputed. The first has been apologized for (too hard, in a perfect world, see H&C's comments above regarding this), and the second hasn't been addressed, I don't think.
2) NOAA did not follow best practices by releasing data with known, unaccounted for bias, and by not releasing the correction as soon as possible. I don't think this point has been refuted, although it has been addressed. I even offered a reasonable way to show that I was wrong.
Could you give me some idea of what kind of analysis you have in mind?
-
Rob Painting at 04:10 AM on 31 December 2015A Buoy-Only Sea Surface Temperature Record Supports NOAA’s Adjustments
dazed & confused - "@Rob Painting. That's an interesting graph. I'll have to take a look at the context. I assume that this a rebuttal to my argument based on the quote...."
No, the image and link to the Kennedy paper is primarily for other readers. Kennedy et al (2011) goes into excrutiating detail of the many issues in constructing a sea surface temperature record. The image demonstrates that the engine room intakes (ERI) run warmer than other measurement methods - which was mentioned in the original post.
As it stands we have the scientific literature versus an anonymous person on the internet. No data set is perfect, nor any time series reconstruction but until such time as you provide some analysis to support your claims the credibility of your arguments won't carry any weight. -
BaerbelW at 02:16 AM on 31 December 20152015 in Review: another productive year for the Skeptical Science team
Thanks Jonas (@3) for your feedback and donation! Also thanks for tirelessly plugging Skeptical Science in that German MOOC you mentioned - I noticed the many threads and comments you posted there to counter those who continuously tried to spread FUD (fear, uncertainty and doubt).
Happy new year to you too!
-
Zeke Hausfather at 01:41 AM on 31 December 2015A Buoy-Only Sea Surface Temperature Record Supports NOAA’s Adjustments
Hi dazed and confused,
Thanks for the good questions; science should always be skeptical (hence the name of this site!), so there is no harm in pushing for clarification.
I agree that in a perfect world we would have created a separate ship-only record to compare to our buoy-only record to better assess the magnitude of buoy bias. However, thats not really what we were focusing on for this project.
We wanted to look at whether or not ERSST v3 or v4 was more accurate in recent decades. The main differences between the two are the buoy adjustments and the NMAT-based ship corrections. Both of these issues arise from the fact that the network is composed of inhomogenous sensors; ships themselves are not easily intercomparable as they don't all have the same instrument and engine room configurations, and buoys and ship engine intake valves are clearly different instruments.
However, there are relatively homogenous instruments available: buoys themselves. They have nearly identical sensor setups across all the buoys, and should provide a relatively unbiased estimate of SSTs in areas where buoys are present. Thus buoys provide a good test for ERSST v3 vs. v4: whichever one is more similar in trend to the unbiased buoy-only record should be the more accurate one, at least for the period of overlap with buoys.
As you can see in our results, ERSST v4 is effectively identical to the buoy-only record, telling us both that the buoy corrections employed in v4 are accurate (and remove the ship-buoy transition bias present in v3), and that the NMAT-based ship corrections don't introduce any detectable trend bias relative to the buoy-only record, at least in grid cells containing both ships and buoys.
Our intent wasn't to evaluate Kennedy's work on buoy-ship differences; rather, it was to evaluate the effectiveness of the corrections in the new version of ERSST. For that the buoy-only record provides a useful test, even if its not independent of the ERSST records.
There is interesting future work to use this and other datasets to compare ERSST and HadSST in more detail, but that will likely take the form of an academic paper rather than a blog post. This initial blog post was more of a rapid response to the politically-inspired criticism of NOAA, essentially pointing out that their results in recent years (and the resulting increase in trend) tend to make ERSST as a whole more similar to relatively homogenous series like buoys or ARGO floats.
-
Acouphène at 01:38 AM on 31 December 2015Just how ‘Sapiens’ in the world of high CO2 concentrations?
How fast dioxygen decrease with respiration in a room of 10m² with 1 person ?
-
Jonas at 01:09 AM on 31 December 20152015 in Review: another productive year for the Skeptical Science team
Fits better here than the news roundup, so reposting this snippet here:
I just donated (twice the amount of last year). You folks deliver an incredible source on climate change and I at least want to help cover costs of the site. I recently took a german online course on climate science to evaluate links and material and of course there were deniers. What would I have done without this site? I painfully remember the days before I came to know it. Deep bowing and a happy new year!
-
Jonas at 00:54 AM on 31 December 20152015 SkS Weekly News Roundup #52
Since I cannot/do not comment on Facebook: we may need 500,000 km2 for Solar PV. The sahara has 9,400,000 km2 (https://en.wikipedia.org/wiki/Sahara ) . No problem there.
However: do we have the minerals to do so? What are the ecological consequences of that? More generally: interesting article (in German) regarding this: Prof. Hans-Peter Dürr said, we might need to stabilize energy use at 8TW for entropy reasons, the limit being determined through exceeding the natural biodiversity loss rate.
--
Translation (by me):
The Ziegler eco number (translated citation from a book of Ziegler):
"In a study by Wolfram Ziegler in which the antropogene loss of biological species is valued as an important indicator for technical civilisation over burdening of natural systems, the interesting claim was made that the antropogene and in last recourse thermal average energy flow per time and surface can effectively be used to measure ecological burden. For central Europe he deduces a maximum limit burden of ± 20 kW/km2 or 0,16 ± 0,02 W/m2.
It is interesting to compare this limit burden with the average solar surface radiation in Germany of 116 W/m2. The burden limit is 0,1%.
More telling however seems a comparison with the (previously) estimated average of solar induced biomass of 0,65 W/m2 (which amounts to 0,5 % of the solar surface radiation). This means, that the maximum ecoloogical burden of commercial energy use is 20% of the sun induced biomass. For the globe, an overall burden limit through antropogene technically provided energy of 8 TW can be extrapolated"
From: Hans Peter Dürr 1993, Zukunft, Page 161
---
(My own comment from a german post, translated):In his article “The 1,5kW society” (“Die 1,5 kW-Gesellschaft”) Prof. Dürr puts in relation the above Ziegler eco number of 20% “admissible" (solar) energy resp. 8 TW with the (former) 5,5 billion world population: sustainability would thus be achieved with the living standard of an average swiss citizen as of 1969. Today, we are already 7 billion people and many do not live like swiss citizens in the 50s or 60s ..
Prof. Dürrs “The 1,5kW society” (german)
http://gcn.de/download/D15KW.pdf--
Original german text:
Die Zieglersche Ökozahl:"Wolfram Ziegler hat in einer Studie, in welcher der anthropogene Ausfall biologischer Arten als wichtiger Hinweis für die technisch-zivilisatorische Überbelastung der natürlichen Systeme gewertet wird, die interessante These vertreten, daß der anthropogene und letztlich thermische durchschnittliche Energiefluß pro Zeit- und Flächeneinheit effektiv als Kausal- und Kenngröße für die Umweltbelastung geeignet sei. Für Mitteleuropa kommt er hierbei auf eine maximale Grenzbelastung von 160 ± 20 kW/km2 oder 0,16 ± 0,02 W/m2.
Es ist interessant, diese ermittelte Grenzbelastung mit der in Deutschland im Mittel am Boden einfallenden Sonnenstrahlung von 116 W/m2 zu vergleichen. Die Grenzbelastung liegt hierzu bei etwa einem Promille.
Aufschlußreicher erscheint vielleicht ein Vergleich mit dem früher abgeschätzten Mittelwert für die sonnen-induzierte Biomasse von etwa 0,65 W/m2 (also etwa 0,5 % im Vergleich zur am Boden ankommenden Sonnenstrahlung). Dies bedeutet, dass der ökologisch maximal verträgliche kommerzielle Energieumsatz bei etwa einem Fünftel der im Mittel durch Sonnenenergie gebildeten Biomasse liegt. Für den Globus ließe sich daraus eine Grenzbelastung durch anthropogene, technisch aufbereitete Energieumsätze in Höhe von insgesamt 8 TW extrapolieren.
aus: Hans Peter Dürr 1993 Zukunft S. 161"---
In seinem Artikel "Die 1,5 kW-Gesellschaft" setzt Prof. Dürr obige zieglersche 20% "zulässige" (Sonnen-) Energie bzw. 8 TW bei (damals) 5,5 Mrd Weltbevölkerung in Relation zu damaligen Konsumzahlen: nachhaltig wäre demnach der Lebensstandard eines Schweizers im Jahre 1969. Heute sind wir schon 7 Milliarden Menschen und viele leben längst nicht mehr wie die Schweizer in den 50ern und 60ern ...Prof. Dürrs "Die 1,5kW Gesellschaft"
http://gcn.de/download/D15KW.pdf--
Off topic: I just donated (twice the amount of last year). You folks deliver an incredible source on climate change and I at least want to help cover costs of the site. I recently took a german online course on climate science to evaluate links and material and of course there were deniers. What would I have done without this site? I painfully remember the days before I came to know it. Deep bowing and a happy new year!
-
Eclectic at 23:20 PM on 30 December 2015A Buoy-Only Sea Surface Temperature Record Supports NOAA’s Adjustments
Kevin C @ #25, Thank you for a fine reply.
Dazed & con. @ #26, Please be as long-winded or brief, as you wish. Please though, be careful not to succumb to the Moncktonian Malady of endless buzzing around points of trivial importance ( combined with his usual Gish Gallop that approaches "word salad" status ). Indeed, if I may provide a friendly caution ~ your reply #27 shows a leaning towards the Moncktonian methodology. I would like to think that, having noted the danger, you will be able to pull back from the brink!
On your final point [of #26] : of science being "just as [rigorous] either way" . . . you have used a rather ambiguous or confused phrase. Thus triggering my question: "As either way as what?"
To explain more clearly where I am coming from about that ~ please let me propose the far-from-novel point that the mainstream climate science is a sort of large pyramid composed of a "consilient myriad" of blocks. Blocks of somewhat varied rigour [ but not, I hope, including rigor mortis ;-) ] which are mostly gradually improving in rigour individually . . . and which altogether have formed a large and unmistakable pyramid.
Is the pyramid now (in your words) decently "rigorous"? Yes, it is. The whole is greater than the sum of its parts. In other words, the consilience is very great. Furthermore, there are no other pyramids in sight. Not even micro-pyramids. Nor dream'd of. (Please excuse the non-rigorous Shakespearean quote! )
But to return to your point ~ the mainstream-science pyramid is a proven pyramid . . . and it is up to the claimants (for any new pyramids) to demonstrate their pyramidal existence, moderately rigorously. Demonstrating by any reasonable means, with or without citations. It is the context, the bigger picture, which is important. ( Hence my interest in why you yourself would wish to focus on a single block of stone. )
(b) Does this SkS website exist to convince "contrarions" or even contrarians? No, I don't think it does have that purpose. It exists to convince skeptics i.e. those open to reasonable evidence and reasoned argument.
The pyramid is nowadays so huge . . . that a true skeptic cannot be a contrarian. Nowadays, to be a contrarian is to be a denier of evidence ~ and so, impervious to science-based persuasion. Rather like with the Flat-Earther situation.
-
Kevin C at 23:01 PM on 30 December 2015A Buoy-Only Sea Surface Temperature Record Supports NOAA’s Adjustments
You would simply be comparing buoy data to buoy data, which would tell us nothing about ship adjustments. There have to be some affects of NOAA adjustments in the period of your study for your study to have anything to say about them.
What we've done is shown that the ERSSTv3b data are inconsistent with the most reliable subset of the ERSSTv3b data, where 'most reliable' is in turn verified by intercomparison of proximate observations
By contrast, ERSSTv4 is not inconsistent with the most reliable subset. The changes, including the changes to the weights and the adjusments, have prevented the combination of the ship and buoy data from corrupting the recent record. We don't in this work distinguish whether the improvement is due to the weights or the ship adjustments.
Oh, I see, you're concerned about the word 'adjustments' in the title. If you prefer we could substitute 'new record'?
-
dazed and confused at 21:46 PM on 30 December 2015A Buoy-Only Sea Surface Temperature Record Supports NOAA’s Adjustments
@ Kevin C
I suppose this may seem odd considering some of my posts, but I feel honored that you responded to my questions.
I came to this site hoping to discuss issues with people who would be able to refute or confirm my ideas based on reason and argument. I could not have hoped for better.
OK, that said, I'd like to respond:
The reason for not comparing to the ship-only record is that the ERSST ship only record is not distributed as gridded data
A justifiable reason for not doing the best science possible is not because it is hard. How did Reynolds do his ship-buoy analysis? Surely there must exist some way to extract/recreate/etc this data.
Further a ship only record does not include the ship-buoy transition bias
What's the issue, you can't add in .13C? Or subtract, which ever way you do it.
I'm not really qualified to give much of an opinion about science-media issues, but that hasn't stopped me before. A couple of problems I see with your approach:
If any self claimed scientist can respond in the media, won't that just produce noise? Wouldn't you have to filter? How would you do that?
Shouldn't more weight be given to a peer reviewed paper than one that was not, even from a prominent scientist? How would you communicate that subtlety via the media?
Incidentally, my problem is not with you writing this paper, but more with this website essentially claiming it is fact. And less of that, if someone like you is willing to explain/defend it.
Good that data and code are available. It might be illuminating for me to take a look.
I'm glad for you that Karl showed your work at AGU. Congratulations, I'm sure that's quite an achievement (I'm not trying to be sarcastic, I mean what I said). Please don't be dissapointed that I'm not impressed from a credentials point of view that Karl decided to show something that verified his work. A hypothetical: if your work did not support NOAA's adjustments, would Karl still have shown it? (Don't feel obliged to speculate).
It is interesting that you mention HadSST3. I have some further problems with the NOAA adjustments concerning the "bucket" bias. It had the biggest impact on the recent data of any of the ERRST4 adjustments. As you probably are aware, the big difference between HadSST3 and ERSST4 is that very adjustment. I'd like to discuss these issues, but I'm not sure this is the corret place on the site for that.
In which case you are arguing that ERSSTv4 is already, to a close approximation, a buoy only record for the recent period.
Somewhat. What I am saying is that to the extent that ERSST4 does approximate the buoy only record, it will tend to correlate well with that record, regardless of what adjustments were made to the ship data. So the fact that you show correlation is not much of a confirmation of the adjustments, which was only done to a small portion of the data.
In which case the NOAA adjustments to the SST record play no significant role in the post-1995 trend, because the buoy records are unadjusted.
This is as wrong as it can be. If it were true, then your work would have nothing to say about confirming NOAA's adjustments. You would simply be comparing buoy data to buoy data, which would tell us nothing about ship adjustments. There have to be some affects of NOAA adjustments in the period of your study for your study to have anything to say about them.
It would be true if the ratio of ship to buoy data points stayed the same for the entire period. However, since this ratio changes significantly from 1995 to the present (~50% to ~90%), the NOAA adjustments will have almost no affect in the present, but a larger affect back in 1995. This is the reason that the buoy adjustment changes the trend during this period. I think I've seen pages on this site that explain it better, but that's the gist. Also explained as far back as ERSST3, as someone on this page has already pointed out.
In fact, according to Karl, the change in trend due to the NOAA adjustement from 1998 is .056 C/decade.
-
dazed and confused at 20:07 PM on 30 December 2015A Buoy-Only Sea Surface Temperature Record Supports NOAA’s Adjustments
@Eclectic
You ask some good questions. My wife tells me I'm longwinded, so I'm afraid if I answered you in full, I'd fill up this blog. I'll try to be brief. If I don't answer your questions to your satisfaction, let me know, and I'll be happy to go into more detail.
You make two general points. The first has to do with why I am so concerned about a seemingly trivial subject. The second is more or less a rebuttal of my use of the comments policy. I will address each in a different comment.
Comments policy stuff
Going in, I understood that many (all?) on this site will not agree with many of the things I post. To make things worse, I can imagine that many on this site are frustrated from having to dismiss the same old tired arguments from people who don't have the decency to look throught the items in the thermometer before posting.
When I began posting, I got a lot of replies that seemed like knee-jerk responses, which is very understandable: here comes yet another hiatus bozo to deal with. Unfortunately, this didn't help me to address what I believe to be scientific issues. I used the "stay on topic" policy to try to put a stop to those. In hindsight, perhaps I could have thought of a better way to accomplish that. Happily, recent comments have been addressing issues I've raised.
Perhaps I went to far in my criticism of this article being on this site. I was frustrated to find that I had spent a lot of time on what is essentially a blog post.
First, I certainly would expect articles on a site like this that haven't been peer reviewed. Summaries, explaining things in laymens terms, suggesting new ideas, discussing old ones. Sure.
But this article doesn't fall into that category. It is an attempt to prove a point scientifically. That's another matter.
A question for you: What is the purpose of this article? If this website is about preaching to the choir, then post whatever you like. However, I don't think that's the case, or I wouldn't be here. You said, "with primary emphasis on AGW and the debunking of illogical dogma/myths." Good. It seems like this article is an attempt at debunking the hiatus by supporting NOAA's adjustments.
If you want your debunking to convince skeptics like me, or even worse, contrarions, it seems like you'd need more than a blog article, no matter how good the science appears to be. Would you be convinced by a well crafted blog post on a contrarion's site? Perhaps that's unfair, I don't know, but if you care about persuasion, I think you might want to consider what I'm saying.
A claim that runs contrary to the mainstream requires a higher level of proof than otherwise (extra-ordinary claims require extra-ordinary evidence). I don't see why the same should be true of citations. Shouldn't the science be just as rigourous either way?
-
Kevin C at 19:59 PM on 30 December 2015A Buoy-Only Sea Surface Temperature Record Supports NOAA’s Adjustments
D&C:
The reason for not comparing to the ship-only record is that the ERSST ship only record is not distributed as gridded data, which would be required. You can't draw conclusions from time series graphs alone due to the coverage issue - you need the gridded data. Further a ship only record does not include the ship-buoy transition bias, and so only contains some of the bias.
The work has not been peer-reviewed at this point. However, neither have any of the critiques of ERSSTv4. If you are suggesting that climate science can be critiqued in political events and the media, but that scientists may only respond in the peer-reviewed literature, then the public will be systematically exposed to non-evidence based positions. This is exacerbated by the fact that the media favour political material over scientific material, and tend not to be interested in later followups.
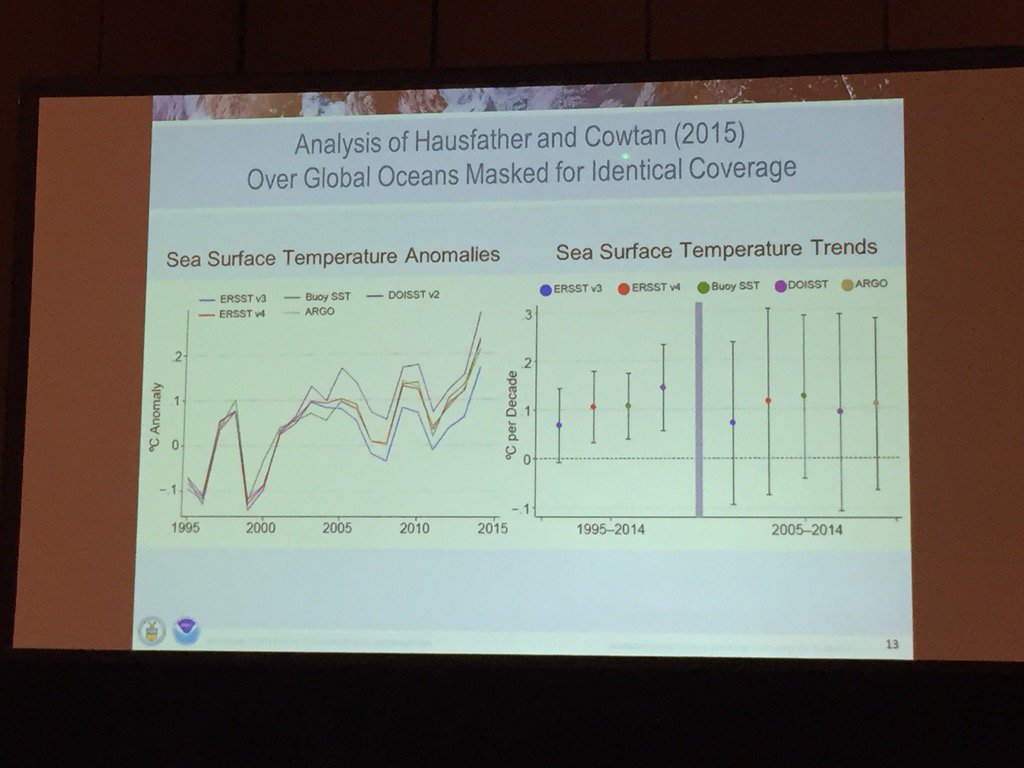
On the other hand, the Argo data are independent of our buoy-only record and are from peer-reviewed work. We also have published all of our code and data for you to review. Finally, Tom Karl of NOAA, who has appropriate expertise in the area, had sufficient confidence in our analysis to show it at AGU:
The differences between ERSSTv4 and HadSST3 are an open question. Before Zeke added the Argo analysis I had no view on which was more realistic for the post-1995 period. With the Argo analysis, I'm leaning towards ERSSTv4 being the better record for this period.
There is one part of your argument which is confusing to me: I think that you are arguing that because the buoys are upweighted in ERSSTv4, it is unsurprising that it shows good agreement to the buoy only record?
In which case you are arguing that ERSSTv4 is already, to a close approximation, a buoy only record for the recent period. I'm fine with that. In which case the NOAA adjustments to the SST record play no significant role in the post-1995 trend, because the buoy records are unadjusted. So there can be no objection to the ERSSTv4 trends being a result of NOAA adjustments.
That's a valid position. Our work is mearly an independent reproduction of the recent record using a rather different methodology which explicitly rather than implicitly excludes any adjustments, and using a minimial implementation (100 lines of code) to allow easier review.
-
dazed and confused at 18:58 PM on 30 December 2015A Buoy-Only Sea Surface Temperature Record Supports NOAA’s Adjustments
@Rob Painting
That's an interesting graph. I'll have to take a look at the context.
I assume that this a rebuttal to my argument based on the quote "These results strongly suggest that a spatial and temporal constant bias correction is needed for ship SSTs. Furthermore, finer space and time corrections do not seem to be possible with the limited in situ data available."
I am arguing that a comparison of ship to buoy data (or more correctly (ship + buoy to buoy) of the detail in the article is not reliable. In their analysis of this question, Kennedy did not use the graph you show. I could speculate as to why, but I see no point.
For some reason, he believed that a different set of calculations was in order. You can see these in the appendix.
I will concede that my argument is not strong. For one, I'm relying on the authority of one paper, albeit from a highly regarded source. Secondly, it could be that there is some reason that Kennedy's reasoning doesn't apply to the article's analysis.
-
dazed and confused at 18:37 PM on 30 December 2015A Buoy-Only Sea Surface Temperature Record Supports NOAA’s Adjustments
@KR
I appreciate your feedback. You make good points, and you certainly have the right to your opinion. Please allow me the opportunity to persuade you otherwise:
I completely agree when you say, "There is absolutely no reason not to publish the best data available..."
Did ERSST3 and 3b represent the best data available? I argue that they do not. It would have been better to use ship only data.
For the period before buoys became a significant part of the data, it would have made no difference.
For the period afterwards, using buoy data will introduce a known, but unaccounted for, bias. If the difference was negligible, then I'd agree that it didn't matter. But that obviously isn't the case. I base this on 2 observations: first, it was important enough to account for in ERSST4; second, based on Karl's paper, using buoy data without accounting for this bias resulted in an error of 0.014°C / decade in the warming trend from 1998 (his year, not mine). How can that be helpful to anyone?
If you can explain how including the buoy data without accounting for bias is somehow better than using the ship data only, I'll concede this point.
"There is absolutely no reason not to ... publish the best corrections for known issues when they are developed and incorporated."
Also agree. My issue is that this should have been done right away. There was no new theory that needed to be developed. As noted above, within a year after ERSST3 was published, a ship-buoy bias was calculated and published. Incorporating this adjustment involves adding a constant to a set of numbers. Couldn't ERSST3 have waited? At the very least, shouldn't this have been included in ERSST3b? What scientific reason was there for NOAA to wait another five years to make this simple correction?
Even worse, why wasn't this done from the beginning of ERSST? Certainly it doesn't take much to realize that ship and buoy data might be biased with respect to each other. Shouldn't this have been investigated from the start?
I would have to disagree, if the data with known flaws is published with appropriate caveats.
This is a good point.
However, what purpose did it serve to publish this data with "appropriate caveats"? How could anyone justify the use of the data in research, especially if the research involved recent years where the bias resulted in a predictable significant error?
It seems to me that this caveat was ignored by both the scientific community and others on both sides, with bad consequences. Contrarions used it to support there "pause" idea. How much time was wasted on the other side trying to deny or explain it? How many papers were written to explain the pause (apologies to Rob Painting, but I only mention it to show the harm caused by publishing data with known bias errors), and how many said, "this is a preliminary analysis based on data with known bias errors?" I haven't read a great deal of the literature, so I could be wrong.
How many other papers included ERSST3/b or its derivites in other research, and how many mentioned this caveat? Although Karl says that these papers are still valid, I don't see how this would be possible, since presumably they depend on the data in question. This means more wasted time. And as the mod pointed out, scientists don't have time to waste on foolishness.
How many graphs of ERSST3/b data have you seen, and how many have this caveat listed? To the uninformed (anyone who hasn't read ERSST3), it would be easy to overestimate the validity of the data. It seems that would be misleading.
"noting known issues leads other researchers to the very topics requiring more work"
I am familiar with this idea. For example, if you had a model that worked in some cases, but had deficiencies in others, you might publish this in the hopes that either someone might be able to take advantage of some part of the work you did, or that someone might figure out the part you were stuck on. I get it.
However, when you see NOAA in the byline, and you are dealing with one of, if not the, premier historic ocean temperature data sets, in most (all?) cases you are going to use the data without question (see above).
Incidentally, the calcuations for the buoy-ship adjustment were done by NOAA employees closely associated with ERSST. Presumably, they would have done the same work whether ERSST3 was published or not.
-
longjohn119 at 16:22 PM on 30 December 20152015 in Review: another productive year for the Skeptical Science team
Here in the Midwest of the USA we are less than 48 hrs away from knocking off 2014 as the warmest year on record globally. In 135 years of records we have never broken the global temperture record two years in a row. A question for those who deal in probabilities
What are the odds/probabability of the global temperature record being broken 2 years in a row? (I'm sure it is greater than 1 in 135)
Also since the 'downside' year of an el Nino is usually warmer than the 'upside' year what is the probability of the record being broken 3 years in a row?
-
Rob Painting at 16:08 PM on 30 December 2015A Buoy-Only Sea Surface Temperature Record Supports NOAA’s Adjustments
Here's an image from the Kennedy et al (2011) paper cited in the original post which compares, in the top panel, ERI (orange line), bucket measurements (blue), buoys (red) and all (blackline) from 1945-2006.

-
Eclectic at 15:20 PM on 30 December 2015A Buoy-Only Sea Surface Temperature Record Supports NOAA’s Adjustments
Dazed & con. ( @19, and earlier ) ,
Perhaps you could be kind enough to expand (and expound) on your concerns about the buoy data issue.
In general, data is what it is [ "are what they are"?! ] , and, as is often the case . . . can benefit from refinement, and from reinterpretation with the added advantage of hindsight. But what is somewhat unclear from your own posts, is your reason for being highly concerned about this particular buoy data issue. Not being privy to your special reason (if you have any special reason, I mean) for intense interest in the case : it seems to me, prima facie that you are addressing a rather small tree in a very large forest of "consilient evidence".
Forgive me if I am mis-interpreting the thrust of your posts : yet you appear to be giving the impression that you are wishing to be oblivious to the overall context of the buoy data.
Rightly of course, the SkS website policy "guides" posters to post exactly on the topic of the particular thread . . . but it would be impossible to have an intelligent discussion of a particular topic, without allowing some latitude in comments. That's not a failing of the website, nor of its "policy". Common sense must guide us in these matters. The website exists [ as I see it ] as a sort of interface between the science and the discussion of science-related issues (with primary emphasis on AGW and the debunking of illogical dogma/myths). Clearly it would be impractical for every sentence or paragraph to be linked to peer-reviewed literature, since such linkage would largely just be re-stating the already-known state of the science. However, it is reasonable to expect that anyone's suggestions (or assertions) contradicting mainstream science, should contain a higher level of "citation". Nothing untoward or unfair about that ~ and it is certainly not an unwarranted "double standard".
-
A Buoy-Only Sea Surface Temperature Record Supports NOAA’s Adjustments
dazed - "I maintain that publishing data with known major flaws is worse than publishing nothing."
I would have to disagree, if the data with known flaws is published with appropriate caveats. And as David Sanger noted above, it was. Publishing the best data to date, even those with known (and stated) issues that will have to be accounted for, is not only appropriate but in fact the best practice in science - noting known issues leads other researchers to the very topics requiring more work, meanwhile giving everyone the best data currently available.
"Am I being overly critical of NOAA on this?"
IMO - yes. Your concerns appear (in my view) to be quibbling and dismissal, not substantive complaints. There is absolutely no reason not to publish the best data available, nor to publish the best corrections for known issues when they are developed and incorporated.
-
dazed and confused at 13:57 PM on 30 December 2015A Buoy-Only Sea Surface Temperature Record Supports NOAA’s Adjustments
@moderator
First, I appreciate your patience with me.
I would also like to make it clear that I have no issue with the ship-buoy adjustment itself, it seems perfectly reasonable to me. My concern is that data without this adjustment should not have been published, especially considering that there were alternatives.
You said, "perhaps because in real world, you have to make the best of what data and methods you have at the time because the products have other uses besides examination of temperature trends"
What other use does ERSST have than to examine temperature trends? I'm sorry to profess ignorance in this.
What was the rush to publish this data? Wasn't there already ERSST2? I don't know the history of that version; were there major flaws in it that needed to be corrected?
I maintain that publishing data with known major flaws is worse than publishing nothing. This is a major data source for other research, and should be as accurate as possible. If they weren't ready to handle the bias, wouldn't it have been better to omitt the buoy data until they were?
You also said, "Meeting the impossible standards of pseudo-skeptics who have nothing better offer is not a realistic science goal."
Normalizing two time series data streams does not seem to me like an "impossible standard", but best pratice. The final adjustment done by Huang et al was to simply add .12C to the buoy readings. How hard was that?
The .12C adjustment was already known in 2009. See Reynolds* (referenced by Huang in the ERSST4 paper). This would have been in plenty of time for ERSST3b, at least. Why did they wait until 2015 to make this adjustment, when it could have been included in ERSST3b?
* R.W. Reynolds, C. L. Gentemann, and G. K. Corlett, 2010: Evaluation of
AATSR and TMI satellite SST data. J. Climate, 23, 152–165,
doi:10.1175/2009JCLI3252.1. -
dazed and confused at 13:18 PM on 30 December 2015A Buoy-Only Sea Surface Temperature Record Supports NOAA’s Adjustments
@Rob Painting
I only mention the hiatus to say I didn't want to consider it. If I have somehow sinned in this, then mia culpa.
I was not trying to bring the pause, or AGW, or anything else, into the discussion. If I inadvertantly did, then I apologize. Please believe that this wasn't my intent.
Rather, I was hoping to illicit responses like the ones from davidsanger and the mod in 16 that addressed my specific questions.
-
Rob Honeycutt at 12:58 PM on 30 December 2015The strong economics of wind energy
Thanks Steve... I'll poke around and see if I can find any information on that. Since posting that comment, I was also thinking the same might apply to the blades as well. Aircraft airframe hours are tracked, and in recent decades a lot of composites have been used in aircraft airframes. I remember in the early days of composites no one was sure what the reasonable lifetime was on the materials, but I believe that's changed with experience.
-
Rob Painting at 12:50 PM on 30 December 2015A Buoy-Only Sea Surface Temperature Record Supports NOAA’s Adjustments
dazed & confused "I don't think I brought up the pause."
And yet, as you pointed out subsequently, you did. It was likely an attempt to introduce a contrarian talking point into the conversation, but has back-fired spectacularly. It's not you again is it James? -
villabolo at 12:19 PM on 30 December 2015The strong economics of wind energy
Charlie A:
Please explain what sort of balancing out is paid for by the wind-power producer during low wind days.
As regards to onshore wind, the most economic on the chart, isn't usually consistently windy on the beach? 39% of the US population live directly on the shoreline right by the grid.
-
stevecarsonr at 11:17 AM on 30 December 2015The strong economics of wind energy
Rob,
Interesting point. If your suggestion is correct, then capacity factor is nicely balanced out by lifetime of equipment. If you find some good information in the future I will be very interested, so please post it in a comment on one of the blog articles I linked.
I don't have any special knowledge about wind turbines in the field so I don't know if there are lifetime metrics available on current wind turbines that will be useful for this. It's quite a new field. Based on knowledge of other rotating equipment I would guess that many factors as well as run time might be important - number of starts, gustiness of wind..
The comparison of Oklahoma vs Germany is not 20% vs 40% just because of hours run, although that is part of it - it's also wind speed while running.
I'm sure that big wind farm operators are building up some metrics but they probably treat it as commercially sensitive information (i.e., competitive advantage). My experience with maintenance of equipment is that there are a lot of unknowns and typically the easiest metric to measure that clearly has an impact (e.g., run time) is the one that gets used as a proxy for asset life.
So.. maybe you are right. Maybe Germany will get 2x the lifetime for their equipment compared with Oklahoma. Maybe it's 1.1x the lifetime. Maybe on average they get 4x because of tornados and more violent storms in Oklahoma..
-
Rob Honeycutt at 09:56 AM on 30 December 2015The strong economics of wind energy
stevecarsonr... I'm curious about your Oklahoma/Germany comparison.
I know with aircraft (which includes turbine style engines), all maintenence and useful life are measured based on time used. Does the same not apply to wind turbines so that a wind turbine that gets half the use would last twice as many years?
-
dazed and confused at 09:24 AM on 30 December 2015A Buoy-Only Sea Surface Temperature Record Supports NOAA’s Adjustments
@davidsanger
Thanks for the info. I appreciate the link to ERSST3, as I haven't looked into that yet. I will be especially interested to see how they attempted to handle satellite data, which I understand was removed from 3b.
Given that there were known issues with the ship-buoy bias, does it make sense that they included the buoy data anyway in ERSST3 and 3b? Why not wait until they have developed the methodology to remove the bias? Isn't that just going to cause "data artifacts" that will become unnecessary points of contention? Also, why did it take until ERSST3 to notice this?
Does anyone else have a problem with this, or am I just way off base?
Moderator Response:[PS} perhaps because in real world, you have to make the best of what data and methods you have at the time because the products have other uses besides examination of temperature trends. Meeting the impossible standards of pseudo-skeptics who have nothing better offer is not a realistic science goal.
-
dazed and confused at 09:11 AM on 30 December 2015A Buoy-Only Sea Surface Temperature Record Supports NOAA’s Adjustments
@Moderator
Thank you for taking the time to respond.
I hope that nothing I said implied that I'm suggesting anything about a global conspiracy or the like. I also have made no claims about AGW or the "pause". I was interested in the science behind this article and the NOAA adjustments.
I assume you're busy, and you can run your site how you like, so you don't need to read this or respond, but I hope you will.
If there are no doubts about Karl et al, then what is the point of this article? Even given that Karl et al are spot on, this says nothing about the validity of the methodology or claims of this article.
I can go on contrarion sites and find non-peer reviewed articles stating all kinds of things. I am trying to find the truth. Should I be convinced based on non-peer reviewed articles and analysis, whether they are yours or theirs? If your articles aren't aimed at a guy like me, who are they for?
May I ask how you decide which articles/analyses you publish on your site? Do you ever publish opposing points of view?
A well-known skeptic, Judith Curry, published this very article on her site (If you want a link, I can give it, but I don't want to appear to be advertising). Given who likely reads her site, she even says, "Since this is a guest post, please keep your comments relevant and civil." I'm sure this wasn't her favorite article, but to her credit she posted it anyway.
I don't mean to be wasting your time. I am looking for a site that doesn't have an agenda, where questions about science can be raised, and hopefully answered. I am hoping that this is such a site.
Moderator Response:[PS] I am but one of many moderators and a junior one at that, but it would appear most are away. Sadly too Zeke and Kevin who would be the ones to respond to points.
So far there have been no doubts expressed about Karl in the science literature, and hence no need to publish the article there. Pseudo-skeptics scream about any adjustment unless it lowers temperature (hence the term pseudo-skeptic) so I believe the article was targeted at them, and deliberately published on contrarian site which to her credit she published. We are actually fine with links to source of information or misinformation but, yes, if it isnt published in peer review, then take with grain of salt, including this. Our normal response to pseudo-skeptics is to point to the peer-reviewed literature, but in this case, that would Karl et al anyway.
The particular objection to linking, to the commentators own blog, you refer to, was considered moderation based on a long term pattern of posting behaviour, and on previous warnings and not a knee-jerk reaction. It was not so much a breach of comments policy but a sustained breach of good manners.
This site does have an agenda - to debunk myths put up by pseudo-skeptics by pointing to actual science. We arent so much pro-AGW as pro-science. If there was actual science supporting contrarian views, then your point would be more valid.
I hope Zeke and Kevin will respond to your questions, but please note that discussion of moderation is always offtopic.
-
davidsanger at 08:43 AM on 30 December 2015A Buoy-Only Sea Surface Temperature Record Supports NOAA’s Adjustments
dazed and confused @ 2
To answer your question "Why weren't the buoy adjustments taken into consideration from the beginning, rather than waiting until ERSST4?"
The documentation for ERSST3 (referenced here) states:"Since the 1980s the SST in most areas has been warming. The increasing negative bias due to the increase in buoys tends to reduce this recent warming. This change in observations makes the in situ temperatures up to about 0.1°C cooler than they would be without bias. At present, methods for removing the ship–buoy bias are being developed and tested." (emphasis added)
-
davidsanger at 08:40 AM on 30 December 2015A Buoy-Only Sea Surface Temperature Record Supports NOAA’s Adjustments
dazed and confused @ 2
To answer your question "Why weren't the buoy adjustments taken into consideration from the beginning, rather than waiting until ERSST4?" The documentation for ERSST3 (referenced here)states:
"Since the 1980s the SST in most areas has been warming. The increasing negative bias due to the increase in buoys tends to reduce this recent warming. This change in observations makes the in situ temperatures up to about 0.1°C cooler than they would be without bias. At present, methods for removing the ship–buoy bias are being developed and tested." -
stevecarsonr at 07:52 AM on 30 December 2015The strong economics of wind energy
Writing blog posts from an interview with a lobby group gets a bit of a different result from writing blog posts from reviewing a number of papers.
LCOE for conventional electricity generation (i.e. dispatchable) is already a function of a few variables and you need to understand which ones were used to get your favorable / unfavorable comparison.
These variables are:
- capital cost
- interest rate, because you have to borrow money for the capital cost
- lifetime of the plant
- fuel costs
- operations and maintenance costsIt’s pretty easy to move costs around by a factor of 2-3 with the “right” choices of variables. If you want a plant with much higher capital cost to look better, choose a low interest rate or long lifetime. If you want a plant where most of the cost is fuel to look worse, choose a high fuel price. That’s easy to do as well, just find a forecast or past price you like.
If we look at the comparison between wind and gas using the conventional LCOE approach, there are 2 important factors.
First, gas is an expensive fuel, much more so than coal. The recent price difference for gas in Europe vs US is a factor of around 3.
Second, the capital cost of say a CCGT plant is quite low compared with wind so interest rates and lifetime don’t affect the CCGT LCOE very much, but the wind LCOE moves a lot.These factors by themselves make it hard to compare the relative costs with “one number”. Better to understand each of the numbers that go into the comparison (see links below).
But then we get to the problem that LCOE is not a good metric for intermittent renewables like solar and wind.
If we take wind for example, the same turbine can be installed in Germany where the average capacity factor is under 20%, or in Oklahoma, where the average capacity factor is over 40%. Exact same turbine, similar installation costs, similar grid connection costs. But less than half the output in Germany compared with Oklahoma. This means the LCOE changes by a factor of more than 2 between these locations. Install in Ireland in a good location and you get just over 30%, and so on.
Then we have the transmission costs. Most grid operators in Europe have to pay the costs of connecting to the grid. But they don’t pay the costs of building the transmission line to get to their wind farm (not usually, e.g. Spain where the cost of building or upgrading transmission is “socialized”, the term they use). Conventional gas plants can be built near the load center, but the best location for wind farms is often far from load centers.
And transmission lines are very expensive.
Then we have the costs of intermittency (backup by plants that need to ramp up and down to cater for low/high wind periods). These are low when wind penetration is low - but obviously the plan is to get to a high penetration. These costs increase with penetration. (And there are other factors like fault ride through - becoming more common on current generation of wind turbines; frequency control in a synchronous network not yet really resolved for high wind penetration..)
This means that the real cost of wind **depends** on the case in hand (capacity factor of wind turbines for that location, current penetration of wind onto the network, costs of transmission lines that need to be built).
All in all, LCOE is not a good metric for comparing wind and gas plants unless you want to promote your point of view and then it’s very handy.
Not a simple subject. I’ve written a few articles on this subject, most relevant are:
Renewables IX – Onshore Wind Costs
Renewables XI – Cost of Gas Plants vs Wind FarmsAnd also an interesting example in one location, where Budischak et al (2013) calculated the lowest cost of high penetration of renewables and needed to overbuild a lot (2-3x more wind turbines). If you read the paper in detail and look at the different scenarios you can see that changes in different costs result in huge changes in the optimized build, and big changes in the total cost. None of this is captured with LCOE because it was a metric designed for a different world.
-
ianw01 at 06:25 AM on 30 December 2015The strong economics of wind energy
This article leaves me very uneasy. I agree with jpjmarti @4 that it undermines the quality of the SkS site. The article title is "The strong economics of wind energy". However, the fundamentals of levelized cost are not even explained or adequately addressed. In the comments (where the issue is left to us readers) we seem to gloss over the extent to which we must over-build (x2?) to compensate for regional variations in wind/solar generation, then get drawn off into a debate about time-of-day-based dispatchability, rather than one tied to current wind speeds.
I'd love to be able to make a strong case for wind energy, and know its limits, but frankly this article and discussion lacks the depth to face the fact that wind is intermittent and any place that relies on it will enevitably find times when huge regions have insufficent wind to generate even a small fraction of the needed power. Not always, but it will occur.
There are so many issues to be addressed in any strong case for wind power: Do we need to advocate brown-outs or rotating blackouts in times of low wind? How do we need to size alternate generating capacity? How do we get the market machanisms to make best use of intermittently low supply? How well are various regions suited to wind generation, based on low correlation of wind speeds over a reasonable power tramsmission distances? The devil is in the details.
This site is called "Skeptical Science", and over the years has provided an amazing resource of information, facts, research and de-bunking. But let's remain skeptical and not suspend disbelief because something is low-carbon.
-
uncletimrob at 05:01 AM on 30 December 20152015 in Review: another productive year for the Skeptical Science team
Thanks, SkS features on a yammer site at my school and is starting to attract attention from (mostly highschool) students. It has also been very useful in providing links to resources from othe sites.
-
dazed and confused at 05:01 AM on 30 December 2015A Buoy-Only Sea Surface Temperature Record Supports NOAA’s Adjustments
@Rob Painting
I don't think I brought up the pause. In fact, I said, "Let's leave asside the issue of global warming and the hiatus for a moment." (See 2).
Again, this article is about whether NOAA's adjustments are supported by the buoy data. So far, no one has answered my questions regarding that. Telling me that there wasn't a pause or that AGW is a known fact doesn't address the topic.
-
anticorncob6 at 04:56 AM on 30 December 2015The Paris agreement signals that deniers have lost the climate wars
I was excited to hear that the Paris Conference was a success.
But I've heard that Ted Cruz plans on withdrawing the U.S. from the agreement. This scares and infuriates me.
Can the president him/herself withdrawl the U.S. from the plan? And what will happen if the U.S. does withdrawl?
-
dazed and confused at 04:55 AM on 30 December 2015A Buoy-Only Sea Surface Temperature Record Supports NOAA’s Adjustments
In trying to answer my own question regarding Reynolds vs. Hausfather and Cowtan above, I went to try to find the peer reviewed paper in question.
Imagine my surprise when I find that the initial article was published on a blog!
If I go too far, then forgive me. Hopefully you can show me the error in my thinking, rather than kicking me.
In the Updated comments policy, it states (correctly, IMHO), "...we believe the only genuine debate on the science of global warming is that which occurs in the scientific literature,...".
This article is clearly describing new science and making claims based on that science. What's it doing on this site?
I have seen mod warnings given to commentors who cite their own blog. I don't see how this is any different.
I understand that this isn't my site, and that the operators can post whatever they please without having to justify their decisions, either to me or anyone else.
However, if you want to claim impartiallity, and a dedication to the science, IMHO it seems hypocritical to put up an article that makes scientific claims without peer review. Apparently, the article has been updated based on comments on the site. Is this an attempt to do peer-review apart from the scientific literature?
Do you have any non-peer reviewed contrarion articles on this site? If I write one (I'm not a contrarion, so this is hypothetical), would you post it, if I had some graphs and links to programs I wrote?
I understand that you are trying to help Hausfather and Cowtan make their article better, and that isn't my gripe. However, from your link, and the title, it seems as though this is established fact, when nothing could be further from the truth.
At least, put a big warning across the top that says something like "CAUTION: Unconfirmed, non-peer reviewed material presented for your consideration". I wasted a lot of time trying to show the problems with this article, only to find the article is irrelevant.
Moderator Response:[PS] If there were genuine doubts/debate about Karl et l published in the peer-reviewed literature, then this work would definitely be sent to a journal. However, the real scientists have little time for suggestions that they are involved in a global conspiracy to create fake warming by invalid adjustments. Skeptical science has published and reprinted many articles/analyses to expose the falseness of pseudo-skeptic positions and will continue to do so. This in no way contradicts our position on where genuine debate occurs. If the contrarians have a real argument, then they should publish but mostly they are only interested in fooling the unskeptical or themselves.
Recent warnings about links to blogs, were for repeat offender, using comments to advertise their own blog rather than genuine engagement with conversation.
-
Rob Painting at 04:25 AM on 30 December 2015A Buoy-Only Sea Surface Temperature Record Supports NOAA’s Adjustments
If you consider the 'pause' to be off-topic, why did you bring it up? When we examine other data sets, especially ocean heat content and corresponding sea level rise (see below), we see that the 'pause' is simply wishful thinking by those that cannot accept the observations.

-
Tristan at 03:57 AM on 30 December 2015Climate's changed before
Tom: That PAGES reconstruction contains consecutive dots that differ by up to 0.3C. Does that mean that during that time, temps rose/fell by as much as .1C/dec? for ~30 years, or is that an issue of precision?
-
dazed and confused at 03:55 AM on 30 December 2015A Buoy-Only Sea Surface Temperature Record Supports NOAA’s Adjustments
Allow me to try again. The title of this article is "A Buoy-Only Sea Surface Temperature Record Supports NOAA’s Adjustments". The title doesn't mention the hiatus, and it doesn't mention AGW, although certainly it will have a bearing on those issues. While I appreciate the responses, it seems that they are off topic, since the hiatus and the data supporting AGW are already discussed in the main arguments of this site, and are not the main topic of this article.
I believe that my point is on topic. I am claiming that this study does not do what the title states.
I'll try again to make my case:
The adjustments that were made to the NOAA data of interest were to the ERSST. Two of the three were essentially adjustments to ship data. (The other was an extra weighting given to buoy data that affected the trend much less than the other two). In order to determine if these adjustments are valid, it would be desirable to check the adjusted ship values against some other data. The best "other" data available, I would concede, is the buoy data.
Unfortunately, this study doesn't make that comparison. Intsead, it compares ERSST4 : buoy data. Essentially, this is comparing (buoy data + ship data) : buoy data. The buoy data composes 50% (beginning) - 90% (ending) of the ERSST4 data during the period in question, and is given some additional weight that I have been unable to determine from the literature (probably I haven't looked hard enough). The fact that the slope of the trends is similar isn't suprising. The buoy data contained in ERSST4 will obviously correspond very nicely with the buoy data, and will tend to mitigate any affect the adjustments to ship data cause.
In fact, what I'd expect is that in the near present, the ERSST4 data would coincide almost completely with the buoy data, since ERSST4 is made up of 90% + weight of the buoy data. There would be less convergence in the past, since the earlier data is more dependant on ship data. Looking at figure 4 from the article, this seems like that might be the case.

Of course, eyeballing a graph is not determinitive. If Hausfather and Cowtan are interested in whether the ship adjustments (the only ones of significance going form ERSST3b to ERSST4) were valid, why not run buoy vs. ship data? Doing some correlation analysis would seem to also be appropriate, since the trend itself isn't the whole story. Perhaps that analysis will support the ship adjustments, but it would be nice to know.
In fact, this analysis has been done on buoy data vs. unadjusted ship data, and is the input to the famous buoy adjustment. In a paper referenced by the ERSST4 paper in the Journal of Climate (do I need to site this?), Reynolds et al* looked at this. They produced a table indicating that the adjustment for 1989-97 is -.14C, while 1998-2006 is -.12C. (I would reproduce the small table here, but for the life of me I can't get the insert table thing to work, it always puts the table at the top of the comment, but I have given the data it contains).
In our context, it is noteworthy what Reynolds et al say after they produce this table: "These results strongly suggest that a spatial and temporal constant bias correction is needed for ship SSTs. Furthermore, finer space and time corrections do not seem to be possible with the limited in situ data available.[my emphasis]"
For the period 1998-2006, at least, according to Reynolds, producing more than a single number indicating correlation between ship data and buoy data, while desirable, isn't possible. Obviously from the above graph and article, Hausfather and Cowtan claim to have coaxed out a much finer comparison. Given Reynolds credentials, is there some reason to believe Hausfather and Cowtan instead?
* R.W. Reynolds, C. L. Gentemann, and G. K. Corlett, 2010: Evaluation of
AATSR and TMI satellite SST data. J. Climate, 23, 152–165,
doi:10.1175/2009JCLI3252.1.Moderator Response:[RH] Resized image that was breaking page formatting. Please keep images down to 500px.
-
Tom Curtis at 03:29 AM on 30 December 2015The strong economics of wind energy
Charlie A @3, the demand for 'dispatchable' power is overstated. Currently, with dispatchable power, there are economic inefficiencies with over production in non-peak periods - particularly at night. Power companies deal with that by offering large discounts for off peak only power supply. By doing so they level out the power demand. Having done so, that economic distortion then becomes the basis for insisting that renewables be 'dispatchable', but that is primarilly a demand that economic patterns geared to fossil fuel (primarilly coal) power production be preserved for power generation when it is no longer economic.
More sensibly, under primarilly renewable energy production, the discount will be shifted from the middle of the night to the middle of the day, or (with a slightly more sophisticated distribution system) to periods of peak supply. For some industrial uses (desalinization near desert regions, generation of hydrogen through electrolysis) time of supply is almost an irrelevance so that great advantage can be taken of the relatively cheap energy. For others, on-site storage will become economical with the relatively cheap electricity at peak supply.
Domestically, heating of water can obviously be done at any time. Using thermal mass from stone, so also can the heating of households, and air cooling requirements tend to coincide with excess production from renewables. The use of slow cookers can shift the peak time for cooking (the largest daily peak).
The economic inefficiencies of variable supply are not as great as those from excess supply from 'dispatchible' supply - but they are not as great as is often suggested. Certainly an industrial economy could be run on purely non-dispatchible supply. In the end the argument from the fact that many renewable sources are non-dispatchible comes down to an insistence that because we have adapted our economy to FF energy sources, we must set those adaptions in stone; and not likewise adapt to renewable sources when they become dominant.
-
One Planet Only Forever at 02:35 AM on 30 December 2015The best of climate science and humanity come together at AGU
Eclectic,
A 'Flat earther's' denial is very different from a climate science denial. That is distinguised by the "brief labels" I suggested.
A Flat-earther's denial can actually be Harmless (not just Mostly Harmless but actually Completely Harmless) while a Climate Science denial is almost certain to be Harmful. Both are denial, but have very different consequences.
And those who have not given much thought to AGW are blind to the issue. That blindness can result in them acting in a harmful way. As they become more aware tehir response will be their choice to move from Blindly Harmful to "Mostly Harmless - Helpful" or "Deliberately Harmful".
So using the terms Helpful and Harmful can be more applicable than denial or denier.
-
The strong economics of wind energy
Charlie A - Several points:
- Wind/solar are dispatchable when there is excess capacity, which several studies indicate is the most economic approach.
- They are also quite predictable on the order of several days (i.e., weather predictions of wind/clouds), making dealing with generation lows reasonably managable.
- Connecting renewable generation over larger geographic areas hugely decreases potential low periods, as weather patterns are of limited extent (Archer et al 2007) - permitting baseload power even without storage.
- The LOCs above do not include externalities - a conservative estimate of the external costs of coal extraction, pollution, disposal, etc., inicates that the LOC of coal should be three times the base generation cost (Epstein et al 2011), meaning that doubling wind capacity to provide surplus power for lows is a no-brainer.
On a one-to-one generator basis, no, renewables and fossil fuels are not directly comparable. On a system-to-system basis, they are quite comparable, and renewable baseload power is indeed less expensive for economies on a whole.
-
Rob Honeycutt at 00:05 AM on 30 December 2015The strong economics of wind energy
jpjmarti @4... The EIA puts LCOE for onshore wind at $73/kWh in the US [link], so the numbers are clearly not out of line, and even are likely understated in this article.
-
Leslie Graham at 18:32 PM on 29 December 2015The strong economics of wind energy
The table is wildly underestimating the cost of nuclear if it doesn't include the costs of decommissioning and 'storage' of waste for hundreds of years.
Who pays for that?
-
jpjmarti at 17:34 PM on 29 December 2015The strong economics of wind energy
Incredible! You are doing it again. Uncritically parroting whatever lobbyists tell you. Your figure on costs rely on gray literature which in fact seems to be unavailble outside press releases and at least in the case of nuclear costs widely inconsistent with serious sources. This type of "reporting" just undermines the good work you do.
-
Rob Painting at 17:25 PM on 29 December 2015A Buoy-Only Sea Surface Temperature Record Supports NOAA’s Adjustments
dazed and confused - IMO the post by Zeke and Kevin does a great job of explaining the issues here. Engine room intakes (ERI) warm the water slightly before it is measured thus, as ERI sampling has changed from a major to minor source of SST data (figure 2), they were likely to introduce a spurious cooling bias. The buoy only reconstruction supports the new version 4 of NOAA's ERSST (figures 3 & 4).
What legitimate basis is there for suspecting that the thermometers aboard the buoys are introducing a spurious trend?
As for the so-called pause, that's dead and buried. The continued warming of sea surface temperatures is consistent with the ongoing build-up of heat in the ocean (some 93% of global warming). That's why, as others have pointed out, it's useful to look at the 'bigger picture'. The scientific evidence is consilient. The warming sea surface temperatures are consistent with the recorded warming of the land surface and warming of the atmosphere. For the subsurface ocean to continue warming as it has, in the background context of a cooling sun over the last four decades, the atmosphere has to warm and direct more downwelling longwave radiation back toward the sea surface. Doing so lowers the thermal gradient through the cool-skin layer and traps more heat in the ocean.
How can there be a pause in warming when the oceans continue to rise as fast as they have? With thermal expansion of seawater and the addition of meltwater showing no signs of slowing down, atmospheric water vapour continuing to increase, heatwaves becoming more frequent and severe, how can anybody take claims of a pause seriously?

-
Charlie A at 16:12 PM on 29 December 2015The strong economics of wind energy
In general, you cannot compare directly non-dispatchable power sources like wind and solar with dispatchable sources like coal, gas, and nuclear.
If the wind farms had sufficient backup power storage on site to supply power for several hours (or perhaps several days) of low wind, then the levelized cost of the combined wind turbine + power storage unit could indeed be compared directly to other dispatchable power sources.
--------------------------
The article says "The cost of balancing out the variable wind power is usually paid by the wind-power producer". Does this mean that the wind-power producer pays to keep a coal or gas plant on hot standby? Please explain what sort of balancing out is paid for by the wind-power producer during low wind days.
-
dazed and confused at 13:57 PM on 29 December 2015A Buoy-Only Sea Surface Temperature Record Supports NOAA’s Adjustments
@Eclectic - Greetings
I understand there is a great deal of evidence involved. Just this past week I had the pleasure of meeting a climatologist who has published several papers regarding the warming of fresh water lakes. She was even gracious enough to give me a quick tutorial on the subject.
I agree with you that one set of data isn't the deciding factor. If it turned out that the ERSST4 data was completely bogus, for example, it wouldn't mean that AGW wasn't true, for bad data has no bearing on the truth.
For someone like me, who is new to the game, there is so much hype that it's hard to know who to trust. Therefore, I decided to have a look at the science and methodology involved to the extent I can understand it.
Hopefully, someone more knowledgable than me can address my questions. It seems to me there are some questionable aspects to Karl's adjustments, but I'm perfectly willing to chalk it up to my own ignorance. I'm hoping someone on this site can set me straight.
-
Glenn Tamblyn at 13:09 PM on 29 December 2015The Ghosts of Climate Past, Present and Future: Part 3
Ohhh Tom
I like your #3.
That would put a lot of dubious corporate types between a rock and a hard place :-)
Prev 511 512 513 514 515 516 517 518 519 520 521 522 523 524 525 526 Next


