


 Arguments


Recent Comments
Prev 525 526 527 528 529 530 531 532 533 534 535 536 537 538 539 540 Next
Comments 26601 to 26650:
-
oldmanthames at 22:26 PM on 23 November 2015Water vapor is the most powerful greenhouse gas
Water vapour and CO2 at high altitude.
The concentration of water vapour, a powerful greenhouse gas, at the earth's surface is usually tens of thousands of parts per million, which completely dwarfs the CO2's 400, let alone the changes in the concentration of the order of 100 parts per million. So say the skeptics.
But this isn't the case at high altitudes. At 40,000 feet, at the top of the troposphere, the temperature is around -50C, and so the water vapour is frozen out, with a vapour pressure of about 4Pa, (1Pa at -60C). Atmospheric pressure at sea-level is about 100,000 Pa, and about 20,000Pa at 40000 feet. If I assume that the concentration of CO2 remains about the same, with a bit of turbulence stopping the heavy CO2 molecules settling out to lower altitudes, then the pressure of CO2 would be about 8Pa=20,000x(400/1,000,000)Pa, which is twice the pressure of the water vapour. So maybe an increase in the CO2 concentration does matter. We shall all get warmer, regardless of the height at which the heat flow into space is restricted.
-
Glenn Tamblyn at 12:55 PM on 23 November 2015Of Averages and Anomalies - Part 1A. A Primer on how to measure surface temperature change
PaulG
Read part 1B for more on the distances over which one can interpolate. And as scaddenp said, Hansen & Lebedeff 1987 is important to read.
Let me address why anomalies give better accuracy mathematically. This article at wikipedia on Accuracy & Precision is worth reading, particularly for the difference beteen the two terms.For any reading from an instrument, a thermomemeter for example, we know that the reading will consist of the true value of what we are interested in and some error in the measurement. In turn this eror is made up of the accuracy of the reading and the prcision of the reading. What is the difference between the two ideas.
Accuracy is the intrinsic, built in error of the instrument. For example a thermometer might be mis-calibrated and read 1 degree warmer than the real value. In many situations the accuracy of a device is constant - built into the device
Precision is how precisely we cane take the reading. So by eye we might only be able to read a mercury thermometer to 1/4 of a degree. A digital thermometer might report temperature to 1/100th of a degree.
So if we take many readings with our instrument each reading will be:
Reading = True Value + Accuracy + Precision.
This image might illustrate that:
So if we take the sum of many readings we will get:
ΣReadings = ΣTrue Values + ΣAccuracy + ΣPrecision.
And the Average of the Readings is the Average of the True values + the Average of the Accuracy + the Average of the precisions.
But the more readings we take, the more the average of the precisions will tend towards zero. The average of a random set of values centered around zero is zero. So the more readings we take, the better the precision of the average. Mathematically, the precision of an average is the precision of a single reading divided by the square root of the number of readings.
So if an instrument has a precision of +/- 0.1, an average of 100 readings has a precision of
0.1 / sqrt(100) = 0.01
10 times more precise.And the average of the accuracy (for an instrument with a fixed accuracy) is just equal to the accuracy.
So the more readings we have, the more the average tends towards being:
Average of Readings = Average of True Values + Accuracy.Now if we take an anomaly. When we take the difference between 1 reading and the average we get:
Single Anomaly = (Single True Value + Accuracy + Precision) - (Average True Value + Accuracy)
which gives us:
Single Anomaly = (Single True Value - Average True Value) + Precision.
So by taking an anomaly against its average we have cancelled out the fixed part of the error - the accuracy. We have effectively been able to removed the influence of built in errors in our instrument from our measurement.
But we still have the precision from our single reading left.
So if we now take the average of many anomalies we will get
Average of Read Anomalies = Average of True Anomalies.
Accuracy has already been removed and now the average of the precisions will tend towards zero the more anomaliess we have.
So an average of the anomalies gives us a much better measure. And the remaining error in the result is a function of the precision of the instruments, not their accuracy. Manufacturers of instruments can usually give us standardised values for their instrument's precision. So we can then calculate the precision of the final result.
But we have to abandon using absolute temperatures. They would be much less accurate. Since the topic is climate Change, not climate, anomalies let us measure the change more accurately than measuring the static value.
There is one remaining issue which is the topic of parts 2A and 2B. What if our accuracy isn't constant? What if it changes? One thermometer might read 1 degree warm. But if that themometer is later replaced by another one that reads 1 degree colder, then our calculation is thrown out, the accuracies don't cancel out.
Detecting these changes in bias (accuracy) is what the temperature adjustment process is all about. Without detecting them our temperature anomaly record contains undetected errors.
-
bozzza at 11:51 AM on 23 November 2015Of Averages and Anomalies - Part 1A. A Primer on how to measure surface temperature change
Is Paul G asking for thermometers to cover the face of the earth? What about the depths of the ocean??
-
scaddenp at 10:18 AM on 23 November 2015Of Averages and Anomalies - Part 1A. A Primer on how to measure surface temperature change
PaulG - the way you do it, it take lots of thermometers at varying distances from each other and see how exactly the correlation of anomalies vary with distance. That would be the Hansen and Lebedeff 1987 paper referenced in the main articles.
-
PaulG at 09:58 AM on 23 November 2015Of Averages and Anomalies - Part 1A. A Primer on how to measure surface temperature change
Okay, I read the explanation that averaged anomalies at nearby locations will typically show less change than will average measured temperatures. That sort of makes sense. I am not sure how less change means more correct.
And I understand the idea of teleconnection. What I don't understand is how you can generalize, or interpolate, in areas where you don't have any measurements.
It seems to me that you won't be able to determine the correlation coefficients resulting from teleconnection unless you have all of the temperature measurements in the first place.
How can you determine the error in your averaging if you don't have all of the measurements to determine that error? The average of anomalies approach may intuitively feel better, but how is it mathematically justified?
Sorry, this does not make sense to me.
-
knaugle at 08:05 AM on 23 November 2015Satellites show no warming in the troposphere
To add, bear in mind the denier mantra
"Satellites are true and NOAA lies."
is something I increasingly have trouble arguing against even considering the 10 positive indicators of a warming world show the idea we have not really warmed in 20 years makes no sense. But, satellites don't lie, right?Moderator Response:[Rob P] - It's informative to look at the satellite trend (for RSS) for the lower troposphere:

So the satellite data does in fact show a long-term warming trend. If one selects the super El Nino of 1997/1998 as a starting point it's possible to fool the uninformed, but that deceptive practice may soon come to an end with the current super El Nino likely to anomalously warm the lower troposphere in the next 4-5 months.
-
knaugle at 07:59 AM on 23 November 2015Satellites show no warming in the troposphere
GregCharles is correct about UAH 6.0. It also points out the need for several popular web sites to "get with the times". Whatever the reason UAH 6.0 was adjusted, the effect was to make it nearly identical to RSS. This improves "consistency", but begs the question why UAH thought RSS right and everyone else wrong. Regardless, all the popular sites I visit still rely on older UAH 5.6 or thereabouts, and we are now left with the satellite data showing nearly no warming for the past 20 years, and the surface data sets with more significant warming. The clear discrepancy between RSS & UAH 6.0 and the surface data (GISS, HadCrut4, Berkeley, etc) is something this site should address and I'm not seeing it.
-
0^0 at 07:10 AM on 23 November 2015The Skeptical Science temperature trend calculator
yes, but how do I find that series today and how is it different from NOAA? To my understanding both should be the same since last summer or so? So what is the difference here?
-
scaddenp at 06:33 AM on 23 November 2015The Skeptical Science temperature trend calculator
The Karl et al 2015 paper that denier are objecting to is linked to on Tom's post. Another link here.
Full citation:Karl, Thomas R., Anthony Arguez, Boyin Huang, Jay H. Lawrimore, James R. McMahon, Matthew J. Menne, Thomas C. Peterson, Russell S. Vose, and Huai-Min Zhang. "Possible artifacts of data biases in the recent global surface warming hiatus." Science 348, no. 6242 (2015): 1469-1472.
-
0^0 at 21:45 PM on 22 November 2015The Skeptical Science temperature trend calculator
I found the code that Tamino used for their 2011 paper and the way they calculated standard error. Looks like I am now able to replicate quite well the slopes and confidence intervals produced by SkS calculator - at least for those series that are clearly identifiable like Berkeley Land, UAH (5.6), RSS (TLT 3.3), GISSTEMP and HadCRUT4..
Unfortunately I still have some challenges with references like NOAA and Karl 2015 which I was not able to identify unambiguously. What I think they may mean (NCDC V3?) is not as close as I would have hoped for. Furthermore Berkeley global is a challenge for me as there my numbers deviate too much from SkS. It would be extremely helpful if the exact data sources (and last update time) were someplace visibe on the calculator page.
(To avoid issues related to possible missing data point in 2015 I have made my calculations for period January 1979 - December 2014.) -
Digby Scorgie at 19:43 PM on 22 November 2015The Road to Two Degrees, Part One: Feasible Emissions Pathways, Burying our Carbon, and Bioenergy
Michael: Yes, that is one of the articles that made me think it is possible to replace fossil fuels completely. Then I read other articles saying in response that it's not so easy! One thing glossed over is fuel for aircraft and ships. I've heard of emission-free synfuels (synthetic fuels) for aircraft — whether or not they work for ships I don't know.
The real blockage is of course political.
-
TonyW at 18:38 PM on 22 November 2015So what's really happening in Antarctica?
Just a note about the Zwally paper. Whilst it has been recently published, the research is much older and I first saw it as a conference paper listed on a NASA page, in 2012. It was also referenced in a Nature article that year. The conference paper had the same title and the same authors (apart from one).
-
hank at 15:42 PM on 22 November 2015So what's really happening in Antarctica?
Tried realclimate and got an immediate redirect to a screen saying
"Offer rdsa____.com" (I'm not posting the full URL, which is spoofed anyhow, nor the actual link that was hidden behind that text, which was long, complicated and suspicious
which changed immediately to
"Win NHL Jersey ____" (also not posting that URL which was also fake covering another long suspicious string of code)
Beware -— looks like it's hidden layers of something rather nasty, hidden under what appears to be mere adware, I think. -
michael sweet at 13:28 PM on 22 November 2015The Road to Two Degrees, Part One: Feasible Emissions Pathways, Burying our Carbon, and Bioenergy
Digby,
This article shows that it is possible to build a completely renewable energy supply by 2050. If a high carbon fee was instituted so that carbon paid for all the damage it causes, investors would build out the renewable energy we need. It would save everyone money and result in better health. The primary block is political due to the influence of fossil fuel companies who stand to lose trillions of dollars.
Fossil fuels are only cheap because they make everyone else pay for the damage they cause. Obama's clean power plan is completely justified by the health savings, the climate benefits are not considered.
-
Digby Scorgie at 11:28 AM on 22 November 2015The Road to Two Degrees, Part One: Feasible Emissions Pathways, Burying our Carbon, and Bioenergy
There are actually two aspects to my "subversive thought". Firstly, is it physically possible to find ways to cope with declining supplies of fossil fuel over a thirty-year period? I don't know. From what I read, sometimes I think it is, sometimes I think it isn't. I just don't know. That's why I asked.
Secondly, how should declining supplies of fossil fuel be allocated between countries? This is the aspect you've latched onto, but this is a different problem altogether. It is a problem the world would've had to face if we'd really passed peak-oil and supplies really were declining. My subversive thought was to suppose the decline was imposed, not natural.
Another way to look at the second aspect is this: We're aiming to induce a decline in fossil-fuel use in the face of a plentiful supply. Well, good luck with that! Whatever methods are used, I'll believe them only when I see fossil-fuel production declining in reaction to declining demand. I fear that, as you imply, the threat needs to be immediate and life-threatening before this will happen.
-
MA Rodger at 06:41 AM on 22 November 20152015 shatters the temperature record as global warming speeds back up
sauerj @10.
If you examine NOAA OHC data, you'll see a strong El Nino signal in the 0-100m Pacific record with OHC rising during El Nino. The signal reverses for 0-700m data but becomes far less obvious. So when global 0-2000m OHC data is examined there is nothing really left to see.
BC @9.
The 0-2000m OHC data does indeed record OHC reduced from 2015Q2 to 2015Q3. But the same thing happened in both 2014 and 2013 when it showed even greater reductions but without an El Nino. Indeed, in the post the "400 million atomic bomb detonations (27 zettajoules, or 27 billion trillion Joules)" figure for ΔOHC in 2015 appears to be the annual figure for 2015Q3 - 2014Q3 which is 27.6 Zj. Over the last 8 quarters the annual ΔOHC averages 22 Zj.
One comparison not made in the post but which I consider more interesting that numbers of bomb-equivalents is the global energy imbalance required to add, say, 22 Zj/year to the oceans. That would be 1.37W/m2 or according to IPCC AR5 Table AII.1.2 equal in size to the increase in all the positive human climate forcings 1978-2011 which, with these OHC figures, would thus still be up there warming away despite the level of AGW we have witnessed since that date. That's a rather scary equivalent.
-
Andy Skuce at 05:52 AM on 22 November 2015The Road to Two Degrees, Part One: Feasible Emissions Pathways, Burying our Carbon, and Bioenergy
Digby: Suppose fossil-fuel producers were "forced" to cut production at the above rate. Would the free market coupled with human ingenuity find ways to cope?!
One question that springs to mind: how would the cuts be allocated, between countries and among fuel types? Also, this would drive prices up, so who would benefit, the producers or would governments have to institute some kind of windfall profits tax? It would also be regressive, so some form of compensation to the poor would be needed.
Perhaps a less regressive policy would be to ration fossil fuel use at the consumer level. But until there is a widespread consensus that we are facing a an urgent existential crisis, I can't see that being politically feasible.
Far better would be a cap and trade policy. After all, the goal should be to lower emissions, not necessarilly to reduce fossil fuel use. Even better than that, in my opinion, anyway, would be a steadily rising carbon-tax-and-dividend policy.
-
sauerj at 03:54 AM on 22 November 20152015 shatters the temperature record as global warming speeds back up
It appears the rise in ocean heat content rate is trending up. Since 1990 (25 years), it appears to have increased ~21x10^22 J (15,668 atom bombs/hr), based on an atom bomb = 17x10^9 watt-hrs. In contrast, since 2008 (7 years), heat content appears to have increased ~8.5x10^22 J (22,650 atom bombs/hr).
Article notes the 2015's El-Nino driven spike in heat content amounting to 50,400 atom bombs/hr (14/sec).
I'm a bit preplexed: I had thought that in El-Nino years that the stored-up ocean heat content was expelled (more than avg rates) to the surface, causing spikes in land & ocean surface temps, and also causing a slight decrease in the rate-of-ocean heat content (compared to avg) due to this more aggressive expulsion of heat from the ocean. ... Opposite effect in La-Nina years, that the rate-of-rise of ocean heat content would be more than average. So, I'm surprised to see OHC rate-of-rise increase in 2015's El-Nino year. I obviously have something wrong here.Moderator Response:[Rob P] This years super El Nino has yet to really leave its mark on ocean heat content. The data for ocean heat content end in September and we're only reaching the peak of El Nino now. The next two quarters of OHC may tell a different story.
 Time-series of globally-averaged (60°South to 60°North) ocean temperature anomaly from the monthly mean, versus depth in metres (pressure in dbar).(b) Time?series of globally-averaged sea surface temperature anomaly (black, °C), ocean temperature at 160 metre depth (blue), and the Nino3.4 regression estimate for SST (red). From Roemmich & Gilson (2011)
 -
2015 shatters the temperature record as global warming speeds back up
I would have thought that higher surface temperatures would have resulted in more infra red radiation out to the atmoshpere and space and less accumulation of heat in the oceans. That is, wouldn't there be more accumulation in cooler surface temp /La Nina years and less in El Nino years? Maybe that's why there's a downward turn at the end of the graph, which only goes to June 2015. That downward turn may continue while the El Nino unfolds.
-
bozzza at 18:05 PM on 21 November 2015So what's really happening in Antarctica?
@ 5, where did you get this quote from: "If we knew the snowfall history perfectly then there wouldn’t be any controversy!" ?
-
bozzza at 17:53 PM on 21 November 20152015 shatters the temperature record as global warming speeds back up
A little birdy told me government departments expect ice free Arctic summers by 2050. Talk about conservative..
I think we will see a lot of divestment into clean energy for good reason before 2020: the same people admit multi-year sea ice in the Arctic is looking very very ill!!
-
Digby Scorgie at 13:20 PM on 21 November 2015The Road to Two Degrees, Part One: Feasible Emissions Pathways, Burying our Carbon, and Bioenergy
The scenario linked to is interesting, thanks. It seems to match the back-of-envelope estimate I've made in the meantime: If fossil-fuel use remains at 30 Gt per year until 2020 and thereafter declines at 1 Gt per year for almost 30 years one uses 585 Gt of the budget. That leaves a residue of 15 Gt to play with. Being so precise is a bit silly really, considering all the uncertainties involved. However, the overall effect does seem to match the "WWW and Ecofys" scenario, even to the small tail of fossil-fuel use from 2050 onwards.
As you point out, feasibility is a different story altogether. In this regard, let me offer a subversive thought: Suppose fossil-fuel producers were "forced" to cut production at the above rate. Would the free market coupled with human ingenuity find ways to cope?!
-
Tom Curtis at 11:28 AM on 21 November 2015So what's really happening in Antarctica?
Morgan01944 @5, the full context of your final quote reads:
"One other thing is certain: West Antarctica has been losing mass at an increasing rate since the 1990s and, irrespective of what is happening further East, that trend looks set to continue. Going to the other end of the Earth, the Greenland ice sheet has also been losing mass at an accelerating rate since around 1995. Greenland is now the single biggest source of mass to the oceans. These trends at both poles are huge signals that are unequivocal and uncontested."
West Antarctica is indeed at one pole, as Greenland is at another. Further, their trends in ice loss are indeed both huge and uncontested (including by Zwally et al). That it is not clear as to the trend in the East Antarctic Ice Sheet has no bearing on that claim. Ergo, your juxtaposing this quote with the two others, which discuss the reasons for lack of clarity in Eat Antarctica, shows at best careless reading - not a problem with the OP.
-
Morgan01944 at 09:35 AM on 21 November 2015So what's really happening in Antarctica?
Not one of your more convincing posts:
"If we knew the snowfall history perfectly then there wouldn’t be any controversy!"
"So what is really happening? One thing that Zwally’s study does highlight is how difficult it is to nail what is happening in East Antarctica because the signal is small and contaminated by unwanted effects that are as large or even large"
" trends at both poles are huge signals that are unequivocal and uncontested."
Moderator Response:[DB] Note that this article is a repost. Please refrain from arguments from your personal incredulity, like you have done here.
If you have substantive issues with the content of the article, please cite those specific issues along with a link to a published analysis or examples from the primary literature that support your contentions.
-
sidd at 08:55 AM on 21 November 2015So what's really happening in Antarctica?
Looks like realclimate DNS is down/subverted, i have informed Prof. Schmidt. The majority of nameservers that i checked claims no authoritative nameserver exists, a minority redirect to IP 208.91.197.217, which is also returned by directly querying the listed authoritative nameservers. whereat resides a spoof site claiming the domain has expired, and inviting one to buy it. A whois check is more illuminating, i have sent the results on to Prof. Schmidt also. -
chriskoz at 07:45 AM on 21 November 2015So what's really happening in Antarctica?
The "issue" with RC manifests itself primarily on weekends, as also appears to be the case here.
So it's simply a regular server mainteance or they don't run a server on weekends. No surprise, climate scientists usually don't have too much volunteer money to spare to maintain their ageing server. RC has been running for over 10y with the same graphical appearance which is quite impressive in those days of constant (and not necessarily useful) technology changes.
-
Riduna at 07:08 AM on 21 November 2015G R A P H E N E
Ed Wiebe @ 3 icorrectly points out that Superconductivity of Graphene coated with Lithium is achieved at K5.9, not room temperature.
The sentence: ‘When coated with Lithium it becomes a superconductor, having no resistance to an electric current at room temperature’ is wrong and the text has been modified to show deletion of the sentence.
-
Andy Skuce at 04:33 AM on 21 November 2015The Road to Two Degrees, Part One: Feasible Emissions Pathways, Burying our Carbon, and Bioenergy
Here's a scenario by WWW and Ecofys that does the job of getting rid of fossil fuels by 2050. You should note that the total energy consumed in 2050 is about one-third of the amount in the RCP2.6 scenario I referred to in my post. Also, the amount of renewables and non-BECCS bioenergy looks (eyeball) similar between the van Vuuren and WWF cases, somewhere around 200-250 EJ/year.
This would be a huge challenge over 35 years and relies very heavily on energy efficiencies as well as aid to developing countries to allow them to grow their economies without increasing emissions. Much of the capital stock we have like power stations would have to be scrapped before its economic lifetime was up.
To me, this scenario looks even less feasible than the one that relies on CCS and BECCS.

-
So what's really happening in Antarctica?
bwilson4web - I've noticed RealClimate has hosting issues from time to time for several years. I suspect this is just another hosting farble, and will be resolved in due course.
-
bwilson4web at 03:09 AM on 21 November 2015So what's really happening in Antarctica?
Hi,
I'm having difficulty reaching the "RealClimate" web site with symptoms suggesting the domain name may have been redirected to someplace else. Is there another source and/or an IP address of the server?
Thanks, Bob Wilson, Huntsville AL
-
Nate12674 at 01:34 AM on 21 November 20152015 shatters the temperature record as global warming speeds back up
I think Cooper13 has a good point. Next year, 2016, will be the appropriate year to add to the chart under the category of El Nino years. It should be empahasized that 2015 will be a record, even before the large influence of the strong El Nino is felt.
-
Alexandre at 22:25 PM on 20 November 20152015 shatters the temperature record as global warming speeds back up
I predict we'll have 20 years of people claiming "global warming stopped in 2015 - now it's for real!"
-
Digby Scorgie at 20:39 PM on 20 November 2015The Road to Two Degrees, Part One: Feasible Emissions Pathways, Burying our Carbon, and Bioenergy
Andy: I was using my mark-one eyeball to estimate the changes in gas and oil use from the thicknesses of the blue and orange bands. Gas use seems hardly to change at all up to 2030 or so. Oil use does decline somewhat. But even with the large decline in coal use, the overall rate of decline in fossil-fuel use for the next two decades still does not seem drastic enough to me. It would help to see some numbers!
It's a bit of a worry when you say the scenario "still overshoots the carbon budget". Also, talk of "negative emissions" raises my eyebrows — I'll believe it when I see it!
What I'd really like to see is a graph showing the way fossil-fuel use has to decline in order to satisfy the 600 Gt budget — without any CCS. I would love to see such a graph compared with RCP 2.6. Any chance of that?
-
Andy Skuce at 18:15 PM on 20 November 2015The Road to Two Degrees, Part One: Feasible Emissions Pathways, Burying our Carbon, and Bioenergy
Digby: In the second and third graphs, I think it's clear that fossil fuel use without CCS peaks in 2020, followed by a decline, with, for example, no coal without CCS after 2060. Although that's a very ambitious mitigation scenario, it still overshoots the carbon budget, requiring net negative emissions after 2060, as shown in the first figure in my original post. That's where the BECCS is needed.
The 600Gt CO2 budget number that Flannery mentions is a lot lower than the figure of 1000Gt that you would find in the IPCC AR5 reports for a 66% chance of staying below 2 degrees. However, the lower number is more appropriate as a go-forward budget for fossil fuel use from now, because you have to subtract the three years or so of emissions since AR5, as well as make allowance for cement and land-use emissions over the rest of the century.
-
Digby Scorgie at 11:13 AM on 20 November 2015The Road to Two Degrees, Part One: Feasible Emissions Pathways, Burying our Carbon, and Bioenergy
Andy Skuse: That sums it up well: to "rely on sequestration as the main response to the climate crisis" would be to face "a gigantic problem". Some sequestration would help but it cannot be used as an excuse not to cut the burning of fossil fuel.
With regard to the latter, I'm busy reading Tim Flannery's "Atmosphere of hope" and find it difficult to reconcile his comments on our "carbon budget" with the graph showing RCP 2.6 fossil-fuel use. He states that we have a budget of 600 Gt of carbon dioxide remaining and are currently emitting just over 30 Gt annually from burning fossil fuel. At current rates we'll use up the budget by 2028. Even if the rate is capped at 30 Gt, that still extends the deadline to 2035 only.
I've seen similar figures elsewhere but I've also seen comments disparaging the whole idea of trying to quantify a carbon budget — the uncertainties are large. If we accept the budget of 600 Gt, then we can carry on as usual for about two decades and then we have to stop burning fossil fuel completely. If the rate of fossil-fuel use declines considerably, then we can continue for longer.
Now, if I look at the above graph, I see the use of oil and gas declining only slightly over the next two or three decades. Coal use declines a lot and is compensated for by the use of gas plus CCS. However, the overall reduction in fossil-fuel use does not seem in any way sufficient to meet Flannery's requirement. Have I misinterpreted things? Has Flannery erred? Is the RCP 2.6 graph only part of the picture?
-
Tom Curtis at 09:22 AM on 20 November 2015SBC Energy Institute Climate Factbook
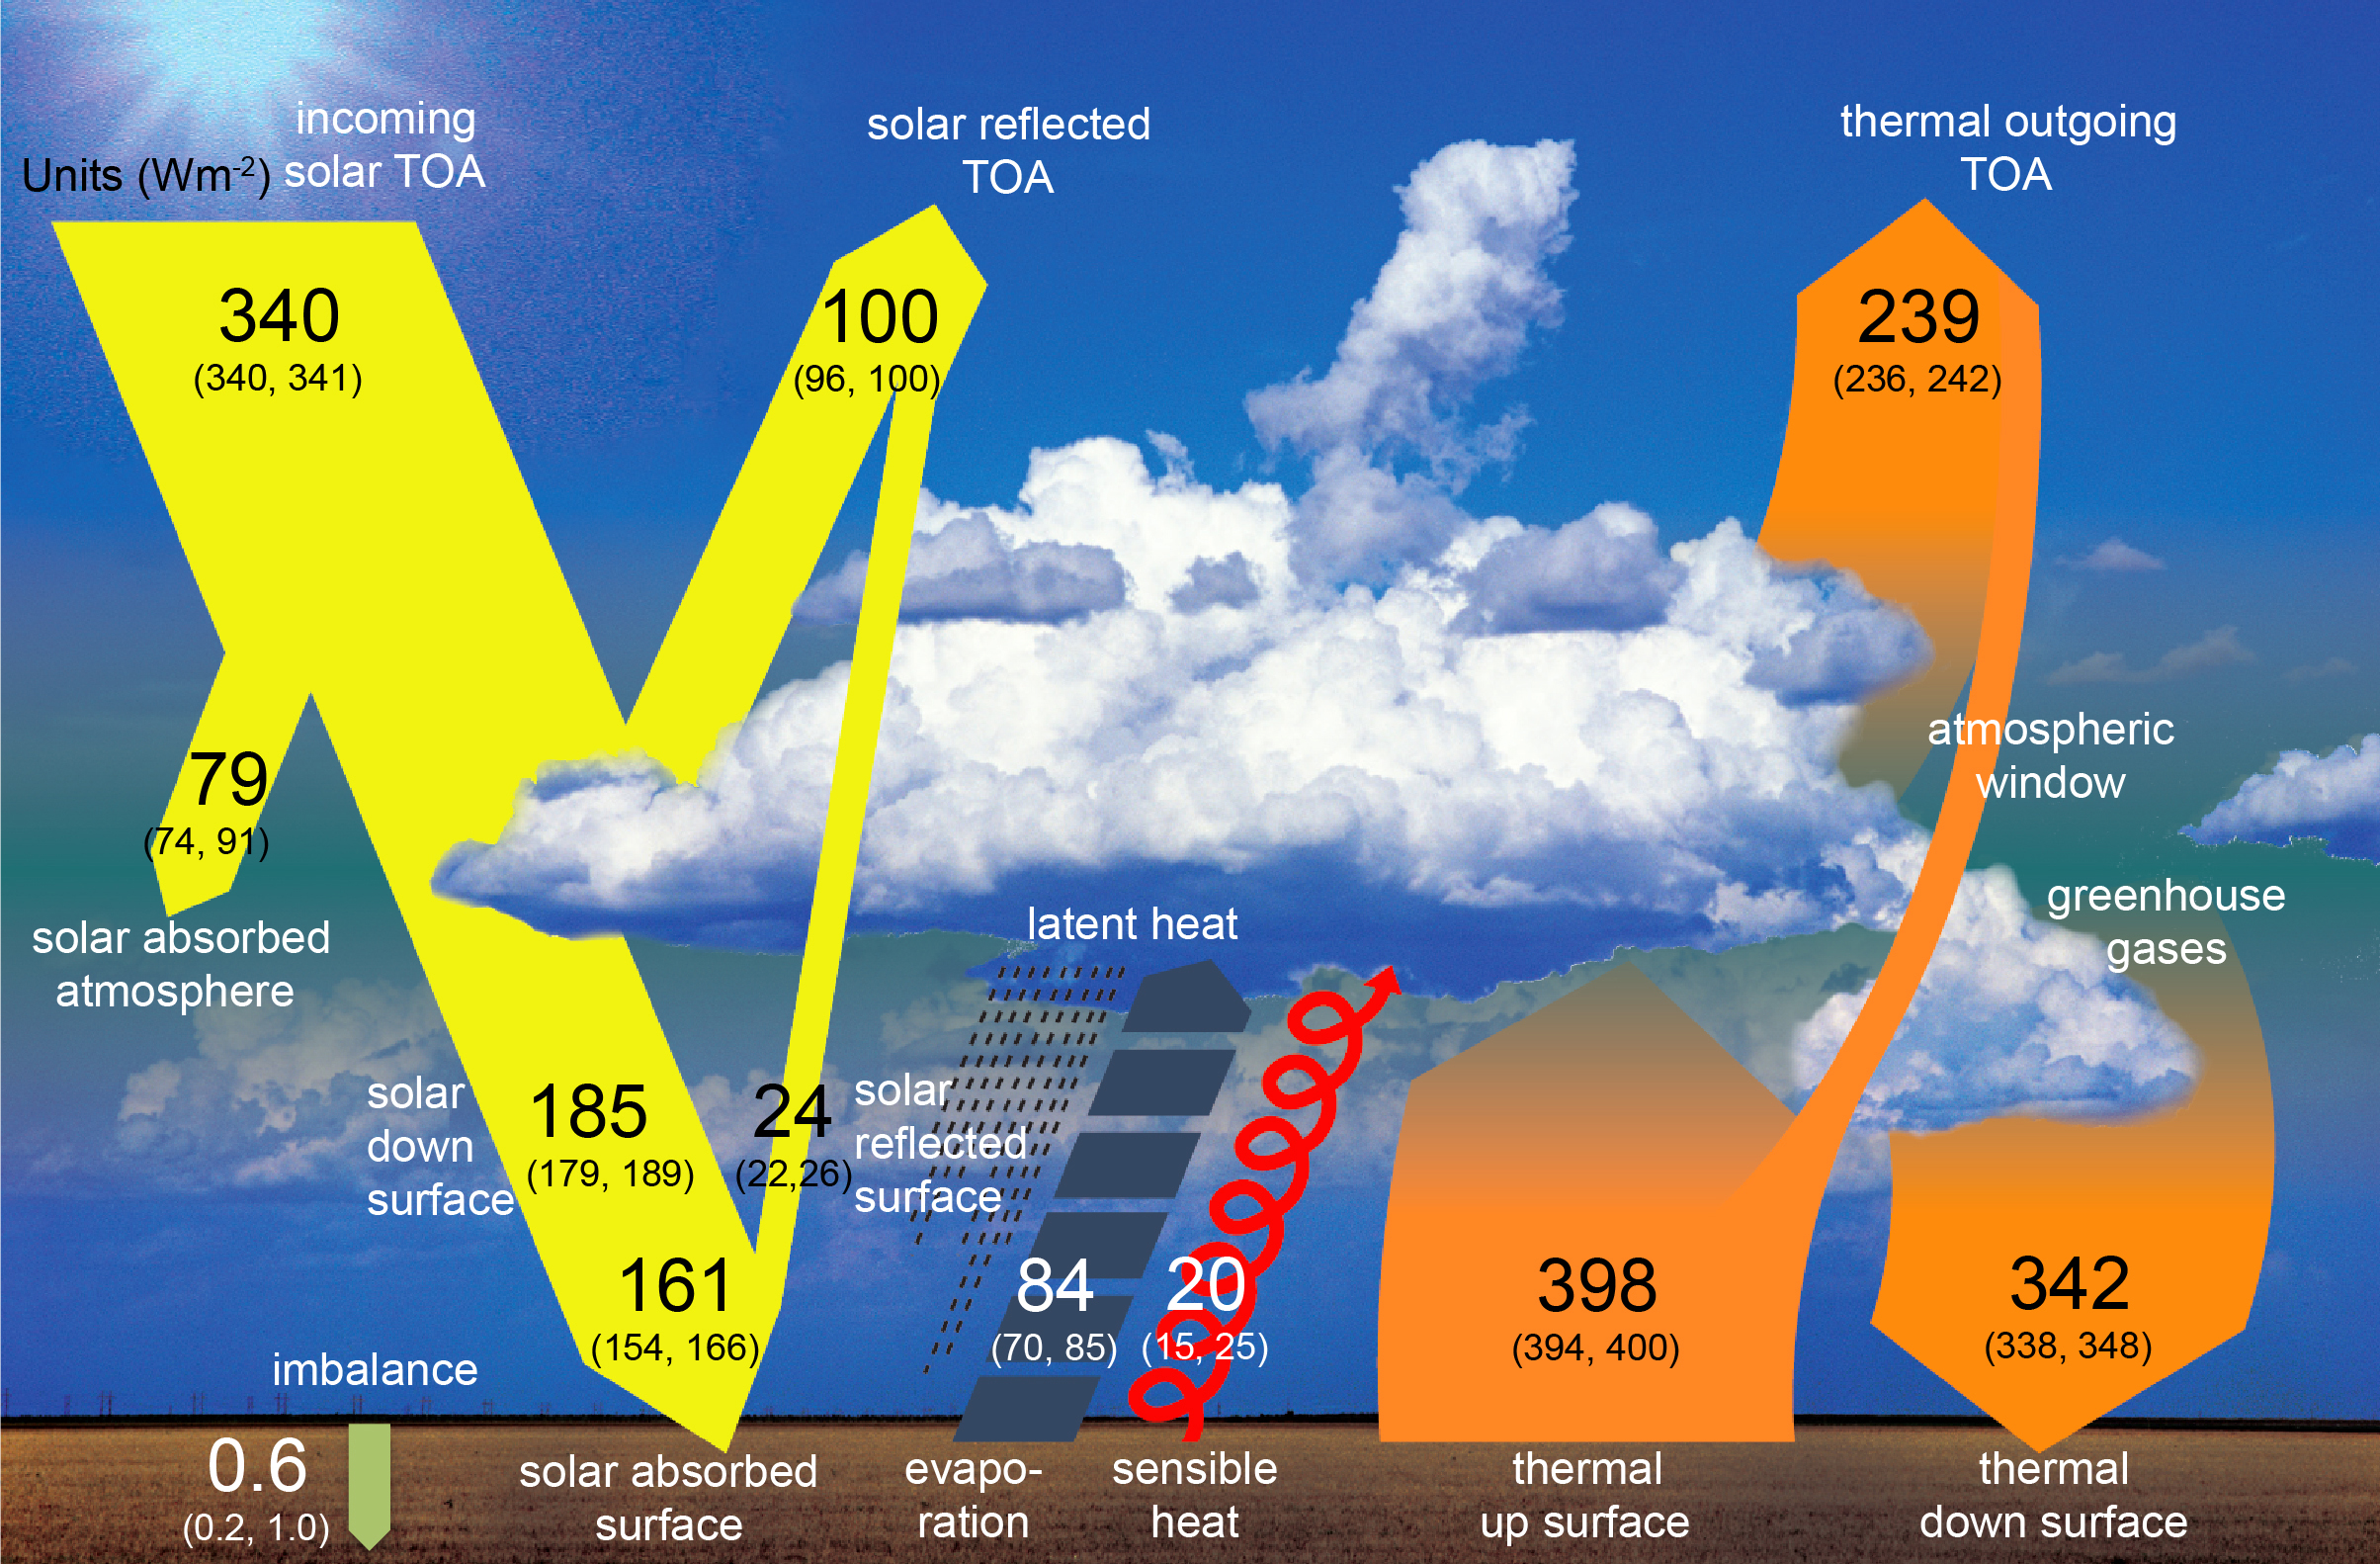
enSKog @1, the claim on page 8 is not so much wrong as oversimplified. As shown in this image from Wild et al (2012), the net effect of reradiation is that there is a 342 W/m^2 back radiation, so that back radiation is 86% of upward IR radiation at the surface:

More importantly, IMO, only 239 W/m^2 escapes to space, so that the Outgoing Longwave Radiation is only 60% of the upward IR radiation at the surface. The difference between the two (158 W/m^2) is the "Total Greenhouse Effect". The difference between the upward IR radiation at the surface and the total IR radiation from the atmosphere (ie, 239+342-397 = 184 W/m^2) is made up for by other energy inputs into the atmosphere, specifically 79 W/m^2 of absorbed solar radiation, 85 W/m^2 from evaporation (including the release of H2O associated with photosynthesis, ie, transpiration), and 20 W/m^2 associated with convection (sensible heat).
As a side note, the same diagram is uses by the IPCC AR5 as Fig 2-8 except that upward IR radiation is given as 398 W/m^2 and evapo/transporation is given as 84 W/m^2 with no other changes, except related changes to bracketed figures, ie, the uncertainty ranges.
If we take a more detailed look, we note that energy absorbed by a single molecule (from any source) and then emitted as radiation has an equal chance of being emitted in any direction. This is sometimes glossed as "LWR is absorbed but then radiated in ALL directions", but of course individual molecules emit single photons on reradiation, each of which must have a specific direction.
It might be supposed that this must result in a collection of molecules radiating equally in all directions, but again this is not true. If we consider a parcel of air defined by vertical planes perpendicular to the surface with top and bottom boundaries defined by concentric shells around the Earth's center, then the air in the top of the parcel will be thinner and (in the troposphere) cooler than that in the bottom of the parcel of air. As the parcel of air has measurable thickness, some of the IR radiation from the air at the bottom of the parcel going upward will be reabsorbed by air in the parcel above it, and vice versa. Because of the difference in temperature, the air in the upper portion of the parcel will reradiate at a slower rate than that in the lower portion, with the net effect that the upward radiation from the parcel will be less than the downward radiation from the parcel. This difference is the core reason why the greenhouse effect exists.
The point is that the booklet's claim and your gloss both represent simplifications of a more complex process. Both can be made true by appropriate qualification and or change in wording, but only by adding significant complexity. The same is also true to a lesser extent of my explanation above. In any teaching situation, you have to make these tradoffs between absolute accuracy and keeping things simple enough for people new to the subject to understand the concepts. Unfortunately, those same tradeoffs result in potential misunderstandings, which are often exploited by deniers to spread confusion and doubt. (For your gloss, the confusion is that outgoing LWR must equal the downard IR radiation at the surface - something I have seen argued by deniers.) So, while I would have preferred to see an explanation of the importance of the temperature gradient in the atmosphere to the greenhouse effect, and the use of the word "net" on the page you discuss, overall the booklet is very good and the "errors" are only those of approximation needed to keep things simple in a teaching context.
-
enSKog at 03:50 AM on 20 November 2015SBC Energy Institute Climate Factbook
Looks pretty good but on page 8 they say
"90% of the upwardly directed LWR is
absorbed by GHGs and radiated back
downwards, ...."90% of up LWR is absorbed but then radiated in ALL directions!
Is it too late to get this corrected? Don't want to give the denialists anything to pick at.
-
chrizzie78 at 01:43 AM on 20 November 2015Climate's changed before
It might help to quote some reliable sources from an earlier period before climate change became a political issue. For example: was rapid temperature change thought to be a or the cause of mass extinctions in the 80's or 90's?
-
Philip64 at 00:29 AM on 20 November 20152015 shatters the temperature record as global warming speeds back up
If 2015's high average temperature is in part influenced by a strong El Nino, then it is likely that several of the succeeding years will be cooler (even as the underlying trend remains unequivocally upward). This will surely lead to new claims that global warming has stalled, a cooling trend is upon us, there is no link between warming and CO2 concentrations etc etc And yes, these claims will be repeated in major newspapers, albeit mainly in the 'comment' sections, where scientifically illiterate 'skeptics' are given free rein to spout whatever nonsense they like without any need to reference the facts.
-
funglestrumpet at 00:29 AM on 20 November 20152015 shatters the temperature record as global warming speeds back up
With all these precise temperature measurements of known El Niño, La Niña events, plus volcanic influences, how far are we away from determining the climate sensitivity for a doubling of CO2?
Moderator Response:[AS] Spelling of La Niña corrected
-
scaddenp at 13:44 PM on 19 November 20152015 shatters the temperature record as global warming speeds back up
Foster Brown - I think that depends on what you mean by "deep". The Peruvian cold upwelling should be say "very deep". I think the article would be more correct if it said "deeper" (<500m) rather than deep.
-
Foster Brown at 13:08 PM on 19 November 20152015 shatters the temperature record as global warming speeds back up
Please correct me if I am wrong, but the phrase "During El Niño events, hot water is transported from the deep ocean layers to the surface" doesn´t seem accurate. The typical situation in the Pacific Ocean off the Peruvian coast is upwelling of cold, nutrient-rich water that maintains a highly productive ecosystem. El Niño tends to reduce this upwelling and its corresponding cold subsurface water.
Moderator Response:[Rob P] The post by Dana Nuccitelli is correct although, as Phil Scadden points out, "deeper ocean layers" would be a better description. The thermocline (the depth where there is a sharp contrast between the warmer well-mixed surface layers and the cooler layers beneath) across the tropical Pacific is 'tilted'; shallower in the eastern Pacific where a lot of upwelling occurs, and deeper in the western tropical Pacific.
The westward tropical trade winds pile up warm water in the west - which is why sea level is higher in the west than in the east. This also drives an accumulation of warm water which extends well below the surface and thus displaces the thermocline to greater depth. This is known as the western Pacific warm pool.When the trade winds relax, buoyancy and the pressure gradient force (a response to gravity) take over and the warm water travels not only eastward (in pulses known as Kelvin waves), but also surfaces. This greater-than-normal exchange of ocean heat with the overlying atmosphere is why the global surface temperature spikes with El Nino. The other part of the equation, as you point out, is a shutdown of the cold water upwelling as the subtropical gyres spin down temporarily.
-
gregcharles at 09:47 AM on 19 November 2015Satellites show no warming in the troposphere
Something I'm having trouble reconciling is the comparison of UAH and RSS datasets. The article states, "Throughout the history of Tropospheric temperature measurement, the UAH analysis has always been lower than RSS for all temperature products." However, as Knaugle pointed at #51, it's RSS that's been the outlier, or at least it was until UAH 6.0 brought UAH into line with it. Spencer (of UAH) talks about the discrepancy in a blog post from a few years back, promising he's not been "bought off by Greenpeace", and even going so far as to say that in his boss's (John Christy) opinion, "RSS data is undergoing spurious cooling."
-
Cooper13 at 02:12 AM on 19 November 20152015 shatters the temperature record as global warming speeds back up
I think it is well worth pointing out that the 'spike' in global temperatures for 1998 and that El Nino event occurred AFTER the El Nino (which started in the winter of 1997).
The current 2015 El Nino is at the same stage the '97-98 event was in 1997, NOT 1998 (where we see the huge temperature spike in the annual temperature record); that anomalous spike is consistently misused to claim 'no warming in the past 15+ years. Thus, comparing temperatures for the global/annual record for 2015 vs 1998 is not apples-to-apples.
As I understand it, El Nino typically has a 3-6 month delayed impact on global temperatures. 2015 can be directly compared to 1997, and once the El Nino effect fully manifests itself, we can then evaluate 2016 to 1998 as a true apples-to-apples comparison.
-
Joel_Huberman at 23:48 PM on 18 November 2015Book review: Climate Change, What Everyone Needs to Know
The link to "Click here to read the rest" isn't working. Here's the correct URL: http://www.theguardian.com/environment/climate-consensus-97-per-cent/2015/nov/17/book-review-climate-change-what-everyone-needs-to-know
-
michael sweet at 20:50 PM on 18 November 2015Exxon climate revelations are just part of a long history of science misinformation
I found a line in Ryland's article at 9 interesting:
"Many owners found that under this policy, their properties became almost unsaleable"
If acknowledging projected sea level rise makes properties unsalable, how long will it be before most sea front land becomes worthless? After Katrina many inland states complained about insuring the coastline property damage After Sandy they raised insurancce rates so that in my area (Florida) some houses had larger insurance payments than mortgage payments. Those increases were withdrawn. After the next hurricane will the properties become insurable?
Investors will notice when properties start to fall in value due to sea level rise. It might be sooner rather than later if acknowledging sea level rise caused properties in Australia to become unsalable. Perhaps then the conservatives will want to take action.
-
Eclectic at 19:34 PM on 18 November 2015Exxon climate revelations are just part of a long history of science misinformation
Ryland, permit me to take you to task on your comment: "Perception is reality", in Ryland @ 9 [or thereabouts ~ as the commentary enumeration has been re-jigged a little bit, in this thread].
Perception is certainly not identical to reality . . . but, where sanity prevails, perception closely approximates reality.
Fantasy (as exhibited by frequent propaganda pieces in The Australian) is where the perception [ of Global Warming / Climate Change ] has little overlap with reality.
"Fantasy" [ no double entendre intended :-) ] there includes the determined effort to deny reality . . . and is clearly a way of thinking divorced from sanity.
I would like to be able to say candidly that it is "un-Australian" to be fantastically divorced from reality . . . but if I were to do so, then my perception would indeed be faulty. Still, we can hope ~ that in 10 years or so, The Australian will eventually embrace scientific reality in place of the [current] fantasy. Then, it will be worth subscribing to that paper.
-
Tom Curtis at 19:23 PM on 18 November 2015Exxon climate revelations are just part of a long history of science misinformation
ryland originally (now inline @1):
"There are many outside the community of climate scientists, who, while perfectly sure climate change is happening, are not convinced humans are as much to blame as is suggested by politicians and climate scientists. See examples here and here. These people may well be and from their comments indeed are, of the opinion that they are subject to "public misinformation campaigns" and that the truth has yet to be discovered"
ryland @9
"As for your other comment, yes I'm sure there are those that consider the belief in man made climate change is akin to a religion and also there are those who believe there is a conspiracy. Remember perception is reality so those that have these perceptions may well also consider the prophecies of doom regularly emanating from the IPCC, climate scientists and politicians to be misinformation campaigns. Personally, I don't subscribe to those perceptions but accept that others do."
ryland @9 is a bit of an evasion, in that my other comment was not that he also shared those views, but that he considered them rational. However, supose he intends it as an adequete response to my claim, ie, that he acknowledges the existence of those views without considering them rational. In that case it completely destroys the logic of his point in his initial post. I acknowledge the existence of people who think the Earth is flat, or that the Sun orbits the Earth. I wouldn't dream of bringing them up as a relevant issue in a discussion such as in the OP in that their views are clearly irrational. So what if people can only irrationally (or being deluded by others due to limited sources of information) claim the IPCC or other climate scientists indulge in "public misinformation campaigns". That has zero bearing on the fact that documentary evidence proves that Exxon was advised by their own scientists that global warming was real, and that they then funded organizations claiming the opposite. Indeed, the mere falseness of "those perceptions" mean that the documented behaviour by Exxon does not have equivalents from the climate science side of the debate.
So, granted that those deluded about climate can also make a "tu quoque" which is not only a fallacy of reason, but grounded on false premises as well. So what!
-
Tom Curtis at 18:56 PM on 18 November 2015Exxon climate revelations are just part of a long history of science misinformation
ryland @9, I did read the piece in The Australian. I have previously noted that The Australian's coverage of climate science bears more resemblance to propoganda than to reportage (See here and here). The article to which you linked is a case in point. The passages you so heavilly bold consist almost entirely of editorial content by The Australian. The only direct quote of Bob Stokes, to the effect that the prior policy "...sterilised land from development because it was a very cautious approach" says nothing about whether or not projections of rising sea levels will be used in the new standards. Your bolding of it, therefore, amounts to a rhetorical bluff. The quote does not support your opinion, and the opinions of The Australian's journalist as to the reasons for and effect of the policy do not constitute reporting on the policy, but editorializing on it.
Better is the reporting by the Sydney Morning Herald (linked above, but which you ignored) where we learn that:
""Changes to climate are likely to intensify our existing hazards," Mr Stokes told Fairfax Media, adding that while many of the problem areas are known, other new ones may emerge."
Note the difference between The Australian's heavily editorialized reporting and the direct quote and attribution from the SMH. However, 'climate change' is used as a weasel word by some deniers, so I looked further, including to the report by the Chief Scientist under the L/NP coallition which resoundingly endorses use of IPCC projections of sea level - giving a clear indication of the position of the government. You ignored that as well. No doubt you will also ignore the NSW governments page on the impacts of sea level rise, which so resoundingly rejects the IPCC position that it states it as the likely impact, and links to the relevant IPCC chapter.
Finally, I watched Bob Stokes talk introducing NARClim (the NSW government funded regional climate modelling project to aid future development decision making), in which he briefly mentions the reforms on coastal planing, saying (at 15:17):
"Finally I just wanted to refer to coastal reforms. Obviously one of the key impacts in relation to climate security is the impacts of rising sea levels and greater storm activity on coastline. That's something we are dealing with through coastal reforms - effectively working with local councils to find out what the impacts are embayment by embayment of rises in sea level, and how that needs to be factored into decisions about development."
Of course, all that must be irrelevant. After all you have The Australian's editorializing masquerading as reporting so can turn a blind eye to everything else, including the actual opinions of the minister involved.
-
ryland at 16:15 PM on 18 November 2015Exxon climate revelations are just part of a long history of science misinformation
I think you probably didn't see the piece from the Australian that stated
"The initiatives mark the second phase of the Coalition government’s demolition of the previous Labor government’s policy, which among other things directed local councils on the coast to enforce the climate change and sea level rise predictions of the UN Intergovernmental Panel on Climate Change.
Under that regime, councils in some cases included sea-level rise warnings on the planning certificates of some seaside properties based not on what was happening on the beaches concerned — including one that is acquiring sand naturally and pushing back the sea — but on IPCC predictions.
Many owners found that under this policy, their properties became almost unsaleable.
“It sterilised land from development because it was a very cautious approach,” Mr Stokes said.
The new strategy will employ scientists and engineers to look at what is happening in each of 47 coastal sediment compartments, and make that information available to councils through a new NSW coastal council.
I think that, especially the last paragraph, makes it fairly plain the NSW government is changing the policy and will not be basing decisions on IPCC predictions but on empirical assessment of the local beaches.
As for your other comment, yes I'm sure there are those that consider the belief in man made climate change is akin to a religion and also there are those who believe there is a conspiracy. Remember perception is reality so those that have these perceptions may well also consider the prophecies of doom regularly emanating from the IPCC, climate scientists and politicians to be misinformation campaigns. Personally, I don't subscribe to those perceptions but accept that others do.
Moderator Response:[JH] For future reference, please specifiy who you are responding to. Thank you.
Prev 525 526 527 528 529 530 531 532 533 534 535 536 537 538 539 540 Next


