


 Arguments


Recent Comments
Prev 526 527 528 529 530 531 532 533 534 535 536 537 538 539 540 541 Next
Comments 26651 to 26700:
-
sailingfree at 09:15 AM on 24 February 2016Satellites show no warming in the troposphere
64 Glenn, Thanks. My point is, good data or bad data, a denier would not care, as long as he could show data for the "goldilocks layer".
-
sailingfree at 09:06 AM on 24 February 2016Global warming stopped in
1998,1995,2002,2007,2010, ????
The Earth's surface is in a warming trend.
The stratosphere is in a cooling trend.
So would not there be a "Goldilocks Layer" in between, somewhere in the mid-troposphere?
That Goldilocks Layer is close to the middle troposphere, which is a recent favorite of Christy.
So in the Goldilocks Layer, we have no warming, over the whole globe since the beginning of the satellite data.Who could deny that?
-
BaerbelW at 06:53 AM on 24 February 2016The Uncertainty Handbook: Download and Translations
ajadedmug - I'll check with folks at Climate Outreach who created the handbook and let them know about your issue - unless you'd like to let them know yourself via a comment on their own page for the downloads?
-
ajadedmug at 06:35 AM on 24 February 2016The Uncertainty Handbook: Download and Translations
I downloaded the English and German versions to a MacBook and viewed them in Preview. The text looked like it was full of gaps and missing letters. At first I thought this was just going to be a witty first-page pun on 'uncertainty', but both versions were like this from start to finish. I had no similar problems using Preview to read The Debunking Handbook. Has anyone had similar issues reading The Uncertainty Handbook in Adobe's PDF viewer (Mac or PC)? Or has my MacBook flipped :)?
-
Fairoakien at 05:52 AM on 24 February 2016Fossil fuel funded report denies the expert global warming consensus
My concern is that NOaa is trying so hard to maintain the human caused global warming thesis that they have turned to changing facts.
NOAA has funded two studies to deny that there was ever a MWParound 1100 AD that lasted for about 100 years.
NOAA funded a study to falsely lalim that the danes did not settle Greenland because of warming of the Atlantic and did not leave because the climate cooled.
Most recently NOAA submitted a report denying the flattening of the warming curve betwee 1998 & 2015 by using the most subverted statistics. NOAA internal staff disapproved the report.
NOAA has recently changed the source of temperature readings, which coincidentally supports their prior report that there was no paise in the warming curve and indicates a big jump in the 2015 temperatures.
Sorry to say but NOAA is losing credibility and is more susceptible to climate deniers by providing non-science backed support for their position.
Oh, many of those climate scientists that support the human caused global warming have degress in climate fields, e.g, biologists, physicists, engineers etc.
Moderator Response:[PS]
Please note that posting comments here at SkS is a privilege, not a right. This privilege can and will be rescinded if the posting individual continues to treat adherence to the Comments Policy as optional, rather than the mandatory condition of participating in this online forum.
Moderating this site is a tiresome chore, particularly when commentators repeatedly submit offensive or off-topic posts. We really appreciate people's cooperation in abiding by the Comments Policy, which is largely responsible for the quality of this site.
Finally, please understand that moderation policies are not open for discussion. If you find yourself incapable of abiding by these common set of rules that everyone else observes, then a change of venues is in the offing.Please take the time to review the policy and ensure future comments are in full compliance with it. Thanks for your understanding and compliance in this matter.
Take note in particular of accusations of fraud etc. in policy. If you wish to take issue with the published science then present papers and data to support your viewpoint rather than resorting to conspiracy theories. If you are uninterested in facts that do not support your wishes, then science is not for you and certainly this site is not for you. There are many other blogs that will appreciate your comments.
-
John Hartz at 02:46 AM on 24 February 2016Models are unreliable
From the handy-dandy SkS Glossary...
Climate model
spectrum or hierarchy
A numerical representation of the climate system based on the physical, chemical and biological properties of its components, their interactions and feedback processes, and accounting for all or some of its known properties. The climate system can be represented by models of varying complexity, that is, for any one component or combination of components a spectrum or hierarchy of models can be identified, differing in such aspects as the number of spatial dimensions, the extent to which physical, chemical or biological processes are explicitly represented, or the level at which empirical parametrizations are involved. Coupled Atmosphere-Ocean General Circulation Models (AOGCMs) provide a representation of the climate system that is near the most comprehensive end of the spectrum currently available. There is an evolution towards more complex models with interactive chemistry and biology (see Chapter 8). Climate models are applied as a research tool to study and simulate the climate, and for operational purposes, including monthly, seasonal and interannual climate predictions.
Definition courtesy of IPCC AR4.
All IPCC definitions taken from Climate Change 2007: The Physical Science Basis. Working Group I Contribution to the Fourth Assessment Report of the Intergovernmental Panel on Climate Change, Annex I, Glossary, pp. 941-954. Cambridge University Pres
-
PhilippeChantreau at 02:37 AM on 24 February 2016Models are unreliable
Splitting hair about semantics while the planet is accumulating heat at a rate that was only seen before during cataclysmic mass extinctions. Perhaps that's what is truly wrong about this species of ours...
-
Models are unreliable
FrankShann - I agree that the question you pose (regarding "evidence to support the assertion that CMIP5 predicts temperature") will lead people to answer 'no', but that is because as stated it's an incomplete question.
The proper question is "Is there evidence to support the assertion that CMIP5 models predict temperatures from forcings?" The answer to that is certainly 'yes', as validated by their ability to reproduce past temperature evolutions on both the global and regional levels. And that indicates that their projections, conditional predictions, about the future are useful.
If you pose a poorly worded or incomplete question, you shouldn't be surprised by a nonsensical answer.
-
FrankShann at 00:31 AM on 24 February 2016Models are unreliable
Tom Curtis @966.
*If Skeptical Science aspires to explain climate science to the general public, it needs to use words in a way that is understood by the general public (or flag the specialist meaning).*
You seem very confident of your expertise on many subjects outside climate science. What precisely is your expertise on survey techniques? The survey questions suggested by you were of very low quality indeed. I didn't pretend that my survey was definitive, but your statement that the information is "worthless" is incorrect (it is often risky to assert absolutes in science). In fact, you have very little information about how I did the survey. I asked university staff because it was convenient (as I said), and because an educated sample was more likely to know that "predict" has alternative meanings (so was more likely to refute my hypothesis). You say, "I have no doubt [another absolute] that forecast is the archetypal definition of 'predict'" - which is consistent with the meagre evidence from my survey (where respondents took "predict" to mean "forecast").
You asserted (without presenting any evidence) that "your suggestion, 'description' will [another absolute] cause confusion as to whether or not GMST is a dependent or independent variable in the models". Who says? My point (which you overlook) is that "predict" is just as likely as "describe" to cause confusion as to whether GMST is a dependent or independent variable - both terms can be used to describe independent variables and your ignorance of the term "descriptor variables" is merely evidence of ignorance (and suggests that "describe" may be less likely than "predict" to be mistaken for an independent variable).
I did not intend to make such a big deal of it, but I still think that saying "Climate models have done an excellent job describing how much temperatures at the Earth’s surface have warmed" when combined with the 1880-2015 CMIP5 graph is less likely to cause confusion than Dana's wording. It still refutes Christy's misleading graph, which is far more important than my minor quibble about semantics.
As we seem to agree that climate change is an important problem that needs to be addressed urgently, is it time to call a truce over "predict" versus "describe" so we can spend more time fighting the deniers rather than squabbling with each other?
-
Jeff T at 22:25 PM on 23 February 2016Fossil fuel funded report denies the expert global warming consensus
Although "Who wrote it and what is their expertise in the field?" is often relevant, is it really the first question one should ask about a manuscript? Asking that question first leads to evaluation by source rather than evaluation by content.
-
bozzza at 21:10 PM on 23 February 2016Fossil fuel funded report denies the expert global warming consensus
Seeing how important naming systems are to science I think it fair to say that consensus is ver important in science.
-
shoyemore at 19:53 PM on 23 February 2016Fossil fuel funded report denies the expert global warming consensus
This paper finds "robust and replicated evidence that
communicating the scientific consensus on human-caused climate change leads to significant and substantial changes in perceived scientific agreement among conservatives, moderates, and liberals alike"Deniers often argue that "consensus is not important", but clearly it is, and the Heartland Institute know it. The report is just another attempt to muddy the waters.
-
barry1487 at 17:47 PM on 23 February 2016Fossil fuel funded report denies the expert global warming consensus
It could be added that Richard Tol criticised the Cooke et al paper, and said that he had no doubt there was a strong consensus (high 90s).
http://www.theguardian.com/environment/climate-consensus-97-per-cent/2014/jun/02/republican-witness-global-warming-consensus-real
Unwilling to read the Heartland document. I wonder if they mentioned this Tol's efforts in their 'literature review.'
-
barry1487 at 17:24 PM on 23 February 2016Tracking the 2°C Limit - January 2016
Thanks for the reply, Rob. 6 mo does look better. Did you analyse the fits statistically?
-
Tom Curtis at 16:23 PM on 23 February 2016Models are unreliable
FrankShann @965,
First, you do not test for reading comprehension by asking questions that can be answered by simply parroting the text. Ergo, questions that do so do not test for confusion or lack of confusion introduced by the terms used. And, yes, the precise wording of my questions woud be confusing to the general public, but a I presumed I was conversing with an intelligent person, I did not undertake an appropriate rephrasing required if I were to conduct an actual survey.
Second, you now appear to be indicating that in your convenience survey you showed members of the general public Dana's article, and asked them whether, from the use of the word predict, they would conclude that CMIP5 models were developed prior to 1880? That is certainly not how you described it before. Rather, you took a survey of people with a highly specialist knowledge on a few academic topics, and tested for the archetypal meaning of 'predict' in their usage. The survey population was not representative of the general public - particularly so with their usage of statistical terms. The survey was not double blind. And the survey did not test for whether or not Dana's wording would in anyway cause confusion. As supporting evidence for your position, it was worthless. That you cannot recognize this shows your knowledge of linguistics to be as abysmal as my knowledge of medicine.
I have not ever said that temperature was a predictor variable in the models. Indeed, I have said the exact opposite. Nor would I describe anything as a 'descriptor variable' which is a term that has no meaning that I am aware of.
What I would say is that both CO2 emissions and GMST are equally desribed by climate models. One, however, is an independant variable. The other a dependant variable. Saying that CMIP5 models 'describe GMST' leaves us completely in the dark as to whether GMST is dependant or independant.
-
FrankShann at 15:23 PM on 23 February 2016Models are unreliable
KR @962. I am not suggesting that we wait decades. I agree that urgent action is needed now, and should have been taken years ago. I am quibbling about a very minor matter - what the average person thinks about a graph of temperature from 1880-2015 as evidence to support the assertion that CMIP5 predicts temperature. That is, I suggest that it is not a good idea to use "predict" with a specialist meaning on a site aimed at people who are not climate scientists (and without pointing out that predict is being used with a non-standard meaning).
I was suggesting only that Dana consider altering one word, and substitute describe for predict, so that the text would read, "Climate models have done an excellent job describing how much temperatures at the Earth’s surface would warm". This does not alter the thrust of Dana's post in any way.
John Christy's misleading graph purports to show that CMIP5 does not model past temperatures well, and so cannot be trusted to predict future temperatures. Dana's graph provides strong evidence that CMIP5 is an excellent model of past GMST, which suggests it is very likely to be good at predicting future GMST (especially as previous CMIP models have predicted future GMST well even though they were not as good as CMIP5 at describing past temperatures).
@964 Tom, we differ about the question - your questions are not what Dana wrote, and they would be completely unintelligible to the general public. Despite your theoretical speculations, people who are not climate scientists did not think that the graph provides evidence that CMIP5 has done an excellent job in predicting temperature; they took predict to mean forecast.
We also disagree about describe. Saying that the model predicts temperature does not imply that temperature is a predictor variable in the model, and saying that the model describes temperature does not imply that temperature is a descriptive variable in the model. You can't have it both ways, although I suspect you may well try.
*Again* If Skeptical Science aspires to explain climate science to the general public, it needs to use words in the way they are understood by the general public (or flag the specialist meaning). If those who run the site will not accept this, then we are all worse off because the site will be less effective and it is important that it succeed.
-
Tom Curtis at 13:52 PM on 23 February 2016Models are unreliable
FrankShann @963, I can agree with you that 'predict' is not an ideal word in the context. The problem is that 'described temperatures' would be even worse. 'Retrodict' would be better except that for part of the data todate, it is in fact predicted (whether we take that from 2005, ie, the date of the last historical input, or from 2012, ie, the date experiments for inclusion in the IPCC AR5 needed to be completed, and which therefore are the results actually presented).
Having said that, your convenience sample was asked the wrong question. To truly test whether Dana used the wrong word, you should have given them an example of his sentences of equivalent, and asked:
Based on this sentence and graph
1) Was GMST an independant or dependant variable in CMIP5 models;
2) Were CMIP5 models constructed around 1880 or around 2010; and
3) Did CMIP5 models successfully or unsuccessfully model GMST.
Based on Dana's sentences, if they lead to significant confusion about any of these three points, there was a problem with his use of the word. If not, then not.
I have no doubt that forecast is the archetypal definition of 'predict' just as "unmarried, marriagable male" is the archetypal meaning of 'bachelor' (or was in the 1950s, I suspect the gender specification has now been dropped, or is in the process of being dropped). The later, however, does not cause confusion when we talk of bachelor degrees, or knights bachelor, and did not cause confusion when we first started hearing about 'bachelor girls'. We humans are smart enough to modify the meaning of words from the archetypal value based on context and without confusion. (Computers, not so much.) As a result we use that capacity for flexibility of communication when no word has the exact semantic value we require. We do it all the time, and typically seamlessly.
And that is all that Dana has done.
His problem was that there is no ideal word in the context. But a non-archetypal, but quite common usage of 'predict' worked well. I am sure he would welcome a better word, but none has been suggested. In particular, your suggestion, 'description' will cause confusion as to whether or not GMST is a dependant or independant variable in the models.
-
Rolf Jander at 13:51 PM on 23 February 2016Fossil fuel funded report denies the expert global warming consensus
The frustrating thing is that scientists need to waste their time saying that they all agree on the problem. refuting the attack on the consensus must be taking some time away from actually doing vital research and communicating the finding. That must be part of the objective of these attacks.
-
FrankShann at 13:11 PM on 23 February 2016Models are unreliable
Tom, I am intending to be descriptive - of what people who are not climate scientists think about using a graph of temperatures between 1880 and 2015 as evidence that CMIP5 has "done an excellent job predicting how much temperatures at the Earth’s surface would warm". I told a convenience sample of my university colleagues that "CMIP5 is a climate model developed from 2008 onwards" and asked, "Does this graph provide evidence that CMIP5 has done an excellent job predicting temperature?" None thought that it did.
I repeat, if Skeptical Science aspires to explain climate science to the general public, it needs to use words in the way they are understood by the general public (or flag the specialist meaning).
-
Models are unreliable
FrankShann - As Tom Curtis points out, conditional predictions are indeed part of the definition (a basic part of physics, as it happens), and that's exactly what climate models provide. Trying to focus on only a single one of the multiple definitions in common usage is pedantry.
As to validation, the fact is that GCMs can reproduce not just a single thread of historic GMSTs, but in fact regional temperatures, precipitation, and even to some extent clouds (although with less accuracy at finer and finer details, and clouds are quite challenging). Those details are not inputs, but rather predictions of outcomes conditional on the forcings. _That_ validates their physics - and justifies taking the projections seriously.
We certainly do not need to wait decades before acting on what these models tell us.
-
Tom Curtis at 10:28 AM on 23 February 2016Republicans' favorite climate chart has some serious problems
FrankShann @21, dictionary definitons are descriptive lexicography (see comment here), not presciptive lexicography. It follows that they can only guide usage, not prescribe it. In using the Oxford defintion, you are prescribing that Dana drop a less confusing term ('predict') for a more confusing term ('describe'). Specifically, many people would interpret 'CMIP5 models desribe GMST' as indicating that GMST was prescribed for CMIP5 models in much the same way as forcings are. It would certainly leave them confused as to whether it was a dependant or independant variable. Nor would it be particularly useful to describe the CMIP5 GMST output as a dependant variable, for that certainly is jargon. In fact, short of expanding the article by a carefull discussion of prediction, retrodiction and projection, and how it applies to CMIP5, I cannot think of a better word (in terms of avoiding misunderstanding) than the term used by Dana in this context.
I don't particularly care about your statistical experience, given that you are making a linguistic point. Nor, so far as I can see do you have any justification for complaint about the response to your suggestion. I have made suggestions for improvements in the past on SkS articles. Some have been ignored. Some have been hotly debated, and a few have been accepted. That is what I would expect from a group of independently minded people who make up their own minds about the validity of arguments.
-
Tom Curtis at 10:03 AM on 23 February 2016Models are unreliable
FrankShann @960, you quote as your source the Oxford English Dictionary but my print version of the Shorter Oxford gives an additional meaning of predict as "to mention previously" ie, to have said it all before. That is equally justified as a meaning of 'predict' by its Latin roots which are never determinative of the meaning of words (although they may be explanatory of how they were coined). The actual meaning of words is given by how they are in fact used. On that basis, the mere fact that there is a "jargon" use of the word, means that 'predict' has a meaning distinct from 'forecast' in modern usage. Your point three refutes your first point.
For what it is worth, the online Oxford defines predict as to "Say or estimate that (a specified thing) will happen in the future or will be a consequence of something". That second clause allows that there can be predictions which do not temporally precede the outcomes. An example of the later use is that it could be said that "being in an open network instead of a closed one is the best predictor of career success". In similar manner, it could be said that forcings plus basic physics is the best predictor of climate trends. This is not a 'jargon usage'. The phrase 'best predictor of' turns up over 20 million hits on google, including in popular articles (as above). And by standard rules of English, if x is a good predictor of y, then x predicts y.
As it happens, CMIP5 models with accurate forcing data are a good predictor of GMST. Given that fact, and that the CMIP5 experiments involved running the models on historical forcings up to 2005, it is perfectly acceptable English to say that CMIP5 models predict GMST up to 2005 (and shortly after with less accuracy based on thermal inertia). On this usage, however, we must say they project future temperatures, however, as they do not predict that a particular forcing history will occur.
As a side note, if any term is a jargon term in this discussion, it is 'retrodict', which only has 15,000 hits on google.
As a further sidenote, you would do well to learn the difference between prescriptive and descriptive grammar. Parallel to that distinction is a difference between prescriptive and descriptive lexicographers. The curious thing is that only descriptive lexicographers are actually invited to compose dictionaries - while those dictionaries are then used by amateur prescriptive lexicographers to berate people about language of which they know little.
The only real issue with Dana's using 'prediction' is if it would cause readers to be confused as to whether the CMIP5 output on GMST was composed prior to the first date in the series or not. No such confusion is likely so the criticism of the term amounts to empty pedantry.
-
Republicans' favorite climate chart has some serious problems
Well said, OPOF!
Like you, I’m fundamentally critical to the capitalist system too. I’m a little hesitant to call myself a socialist as they also have said and done a lot of stupid things, but an economic system that depends on non-stop growth on a limited planet can’t be sustainable in the long run. It seems that most politicians believe that the Earth is bigger now than it was 100 years age, while everyone with some scientific knowledge know that its surface area of 510 million km² hasn’t changed much for 4.5 billion years.
But let’s get back to the Christy chart:
In my opinion the chart isn’t directly lying about anything, it’s just misleading and therefore lying in an indirect way. And the most misleading part of it is what I’ve already highlighted, namely comparing estimates by a climate model for the surface with observations of the "bulk atmosphere" reaching up to 50,000 feet.
The blue curve in my graph is the average of all the RATPAC-A data sets from the surface to the 100 millibar level (close to 50,000 feet) and indicates a warming of roughly 0.3 °C since the late 1970’s. That’s pretty similar to the balloon data presented in the Christy chart. No direct lies there!
The red curve in my graph is the average of the data sets from the surface to the 400 millibar level and indicates a warming of roughly 0.6 °C since the late 1970’s (the trends given in the graph cover the whole period from 1960). If we insert that curve into the Christy chart, we will see a far better agreement with the climate model, especially if we consider the uncertainty!
So, no direct lies, but the Christy chart is more or less like comparing a climate model estimate from Norway (there I live) with observations from Africa! -
FrankShann at 07:56 AM on 23 February 2016Models are unreliable
KR @959. Thank you for taking the trouble to respond to my posts in www.skepticalscience.com/republicans-favorite-climate-chart-has-serious-problems.html and for explaining how GCMs are developed. However...
1. The word "predict" means to state what will happen in the *future* (Latin prae- "beforehand" + dicare "say"), or to state the existence of something that is *undiscovered* (such as Einstein's prediction of gravitational waves). My source is the Oxford English Dictionary. Any other meaning of predict is jargon and will be misinterpreted by most readers (especially if, as in Dana's post, it is not flagged as being used in an unconventional sense). For Skeptical Science to "explain what peer reviewed science has to say about global warming" to the general public, it has to use words in the sense understood by the general public (or clearly flag the use of jargon).
2. Dana presented a graph of CMIP5 modelling of global mean surface temperature (GMST) from 1880 to 2015. By definition, the CMIP5 estimates from 1880 to 2000 are not pre-diciton (before-stated), they are "hindcasting" (see point 4, below). Yet Dana implies that this graph is evidence that CMIP5 has "done an excellent job predicting how much temperatures at the Earth’s surface would warm" without any hint that he is using "predicting" to mean something other than "stating that a specified event will happen in the future" (OED).
Additional (peripheral) comments...
3. Even with a jargon definition of predict, experience in experimental science has shown that even randomised trials are subject to bias if they are not double blind. Development of the CMIP5 model was not blinded to GMST, so it is subject to bias. Consequently, the only rigorous validation of CMIP5 is how well it predicts future climate.
4. Look at the first sentence in the Intermediate section of this thread. "There are two major questions in climate modelling - can they accurately reproduce the past (hindcasting) and can they successfully predict the future?" In Skeptical Science's own words in this very thread, hindcasting is distinct from prediction.
-
One Planet Only Forever at 01:12 AM on 23 February 2016Republicans' favorite climate chart has some serious problems
HK@14,
I would say you are justifiably skeptical of the motives of informed and knowledgable people like Dr. Christy and those who choose work like his as their preferred presentation of what is going on.
I am almost certain that Dr. Christy is well aware of the difference between the trend of the lower and higher atmosphere and 'abuses' that understanding to misrepresent what he actually better understands. Others like him also try to focus only on satellite data that they understand to be potentially unreliable (highly uncertain compared to other measures of what is going on), and which would require many more years of gathered data to undeniably show how wrong their preferred presentations are.
I am also quite certain that there are some people among us who only care about enjoying and winning as much as they can get away with in their lifetime. And they understand that they can obtain a competetive advantage by deliberately trying to get away with activity they actually understand is contrary to the advancement of humanity to a lasting better future for all. They have almost no interest in the consequences of their actions, and are particularly callous about the consequences in 'a future they will not be alive in'. And some are even worse, having a short-term focus on getting away with winning just 'one more year (or one more fiscal quarter) of getting away with what they understand they should not be allowed to get away with'.
And I am equally certain that the politicians and media pundits who choose to use the deliberately deceptive abuses developed by the likes of Christy understand the unacceptability of their preferences, including fully understanding how unacceptable it is for a more fortunate member of current day humanity to contiune to obtain more personsal pleasure and profit from the known to be damaging and actually ultimately unsustainable burning of fossil fuels.
Hopefully one of the better understandings that grows from this climate change challenge is that popularity and profitability (in business or politics) cannot be relied upon or trusted to develop a lasting better future for humanity, because of the power of the science of deliberately deceptive marketing.
History is full of examples of understood to be damaging activity developing and being prolonged by unjustified drumming up of popular support for known to be unacceptable things. This climate change challenge is an obvious example of how some people are encouraged to behave as unacceptably as they can get away with by the competetive capitalism system and the fatally flawed rules of the game made-up by those among humanity who only care about themselves in their region of the planet in their lifetime (or worse yet just caring about getting away with stuff for one more, 4 year election cycle, or even worse focused only on a 3 month period of time).
-
Republicans' favorite climate chart has some serious problems
FrankShann - I have responded to your model discussion in the appropriate thread.
-
Models are unreliable
FrankShann - Yes, to 'predict' involves a result that wasn't input to the model, but given that GCMs don't have temperature observations as inputs, rather the forcings and the physics, even a retrodiction is still producing results that weren't inputs. Now as to 'tuning' models, what occurs in real life (as opposed to rhetoric) is that when models differ from observations at any scale, including regional variations, relative humidity, ocean currents, etc., the physics for that portion of the model are investigated for errors in the physics. Then the models with (hopefully more accurate) physics are run to see how well they reproduce observations. They are not tuned by temperatures, as erroneous physics re-tuned to a specific output will become even more erroneous, but rather to physical observations at all scales.
Purely statistical models do get tuned, but GCMs are physical models. And the many apparent attempts to dismiss models based upon efforts to faithfully reproduce physical observations, casting them instead as attempts to get a specific output temperature, are therefore incorrect.
The primary results of GCMs are projections, which is to say conditional predictions - if forcing change X occurs, the climate will evolve as Y over time. The CMIP5 model runs projected certain temperatures given specific forcing estimates, and those do diverge from observations - but then so do the observed forcings diverge from the forcing estimates. When we check those conditional predictions using actual forcings, to see what the models show in that case, we find that they are actually quite accurate, that the observations fall well within the bounds of model variability. And thus the results of the models are indeed "predictions". Conditional predictions of the relationships between forcings and climate evolutions.
-
Republicans' favorite climate chart has some serious problems
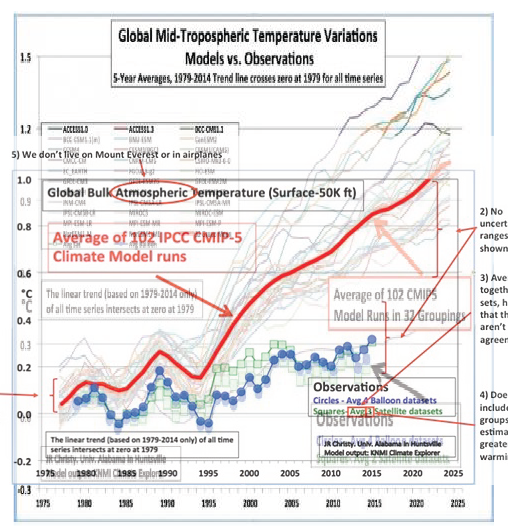
I would strongly suggest that these discussions of models, reliability, and the semantics of "predict", "project", etc be moved to the models are unreliable thread where these issues have been extensively discussed, as this thread concerns issues with Dr Christy's chart and the (odd) choices made in creating it.
-
FrankShann at 22:03 PM on 22 February 2016Republicans' favorite climate chart has some serious problems
The core issue here is merely semantic. Modellers use "predict" to mean how well their model performs on past data, even when the model has been adjusted (tweaked) in the light of knowledge of the dependent variable. This meaning of "predict" is jargon. The general meaning (well over the 97% consensus mark) is that predict means to make a statement about something that is unknown (such as GMST in 2030-2040, or the presence of gravity waves). For example, I take information about the results of football matches over the last 10 seasons and make a model that "predicts" the winners. Then I try different variables or transformations and get better "prediction". But the vast majority of people do not regard this as prediction - for prediction, they require my model to say which teams will win *next* season. That is, GMST after 2015, not 1880-2015. I was suggesting (and still suggest) avoiding jargon and using the widely accepted meaning of "predict" (as defined in the Oxford Dictionary) - which means that CMIP5 describes rather than predicts GMST for the vast majority of 1880 to 2015.
Tom Curtis @19. I did not say global mean surface temperature (GMST) was "fed into" CMIP5, but I agree that I should have made it clear that I am not suggesting that global mean surface temperature (GMST) is an independent variable in the CMIP models. I *am* suggesting that the models have been adjusted in the light of how well they predict GMST (and other variables) over some or all of the period from 1880 to 2014 (the period shown in the graph). Knowledge of GMST during the period has influenced the development of the models.
Tom Curtis @20. I am not atacking Dana's post - it is very helpful indeed (as I said @3). Also, I heartily agree that climate models are remarkably useful predictors of future climate, and vastly superior to the denialist attempts. I merely suggest that Dana consider altering one word (predict to describe) so the post is more plausible to readers who are not statistical modelers (the vast majority of the population) so it reads "Climate models have done an excellent job describing [instead of predicting] how much temperatures at the Earth’s surface would warm" because this statement is supported by a graph plotting CMIP5 against GMST from 1980-2015 (and it still refutes John Chrisy's misleading implication that climate models do not describe past GMST well). The link you mention to the excellent Comparing Global Temperature Predictions article (which I printed and gave to my friends in 2011) occurs at the end of the post, far removed from the predict/describe statement.
I am disappointed at the response to my efforts to help. I am not a climate scientist, but I have have extensive experience with statistical modeling and scientific publication (I'm a member of the International Advisory Board of The Lancet). I tried to help because I think climate change is extremely important and that Sceptical Science is a very useful resource - and that it might benefit from advice from a non-climate scientist about how a post could be misinterpreted by other people who are not climate scientists. Perhaps I won't bother in future.
-
Tom Curtis at 16:15 PM on 22 February 2016Republicans' favorite climate chart has some serious problems
FrankShann @various, CMIP5 uses historical data to 2005 inclusive, but scenario data thereafter. The equivalent model experiments for the IPCC TAR and AR4 used historical data to 2000, and scenario data thereafter. I am not aware of the dates for the FAR and SAR, but clearly they predated the reports themselves (1990 and 1995 respectively). Hansen 88 used historical data only up to 1983 (from memory).
This is important because Dana wrote:
"Climate models are certainly useful, and are doing a pretty darn good job predicting global warming. Their predictions have been far more accurate than those made by climate contrarians, who keep telling us that the Earth will start to cool any day now, as we keep breaking heat records."
In doing so he links to an article discussing the predictions of all five IPCC reports, plus other 'warmist' predictions, along with those few predictions made by AGW 'skeptics'. He was not referring to just CMIP5 predictions as you suppose, and all of the predictions include several years after the last historical forcing data, including CMIP5.
The article summarizes some of the results from a number of articles discussing the predictions of just one individual or organization in any article. The results of the comparisons are summarized in this graph:
So, leaving aside all the technical points about predictions and retrodictions, and predictions and projections; your criticism of Dana is wrong. The worst that can be said of his claim is that it is fleshed out in this article, but another. That, however, is a necessity of communication. Even in the world of the internet, there is still no royal path to knowledge. And links are not just decorations.
And for what it is worth, the HadCRUT4 trend since 2005 is 0.127 +/- 0.22 C/decade, compared to a CMIP5 prediction of about 0.2 C/decade. As the difference between scenarios is inconsequential over that time period, the distinction between projection and prediction is nugatory. Ergo, the CMIP5 prediction still fairs fairly well, and certainly outperforms any 'skeptical' prediction over the same period.
-
Tom Curtis at 15:15 PM on 22 February 2016Republicans' favorite climate chart has some serious problems
FrankShann @18, GMST was not data fed into the climate models. It is a dependent variable. This can be seen by the variability of model retrodictions over the historical period (in this case for CMIP3):

Given the other things you say, your claim that "Global mean surface temperature (GMST) information *was* given to CMIP5 beforehand, so the graph is description and not prediction" is quite bizarre. I assume your claim was just poorly worded, and ask for clarrification.
-
FrankShann at 14:52 PM on 22 February 2016Republicans' favorite climate chart has some serious problems
scaddenp @17, yes of course it's a prediction - but we won't know whether the prediction is "excellent" until we've seen what happens to y when x changes. If I have a model that suggets that Brazil will win the next world cup, it's a prediction - but we won't know if my model has done "an excellent job" until 2018. The fact that my model suggests Germany as the likely winner of the 2014 world cup is poor evidence I have "an excellent model", and it's not prediction because the information was given to the model beforehand.
@11: "In science, a 'prediction' includes any output of a model or theory that relates to data that was not given to the model before-hand (either explicitly as input, or implicitly as data used to derive a relationship included in the model)." Global mean surface temperature (GMST) information *was* given to CMIP5 beforehand, so the graph is description and not prediction.
There are two separate issues. First, what constitutes a prediction (as a minimum, the output must not be part of the input; in common usage, it states something we do not already know). Second, what constitutes evidence that a prediction is "excellent".
John Christy's misleading graph purports to show that CMIP5 does not model past temperatures well (and so cannot be trusted to predict future temperatures). Dana's graph provides good evidence that CMIP5 does model past GMST well (which suggests it may be good at predicting future GMST), but it does not provide evidence that CLIP5 actually does predict GMST well.
Public perception of the basis of climate science is immensely important, as Sceptical Science has repeatedly stressed. It is important that the evidence be presented in a clear and understandable way with no hint of hyperbole. It will damage public perception to claim that the graph that Dana used is evidence that "climate models have done an excellent job predicting how much temperatures at the Earth’s surface would warm" (they have, but that's not shown by this graph). All that is needed to refute Christy's graph is to say that "climate models do an excellent job describing how much temperatures at the Earth’s surface have warmed".
-
scaddenp at 12:33 PM on 22 February 2016Republicans' favorite climate chart has some serious problems
Frank, if some says, "if variable x changes 10 in the future, then y will change to between 45 and 50", is that a prediction? Climate models are always about saying "if net forcings are x, then climate will be y".
-
FrankShann at 12:03 PM on 22 February 2016Republicans' favorite climate chart has some serious problems
@7 and @11. Predict means to state what will happen in the *future* (Latin prae- "beforehand" + dicare "say"), or to state the existence of something that is *undiscovered* (such as my example of gravitational waves, or Bob's crude oil).
I am well aware of the sloppy use of "predictor variables" in statistical modelling (I am a regular user of Stata), but the correct term is independent variables and *not* predictor variables. The latter term is used (incorrectly) by some scientists because once a model has been developed the (known) independent variables are sometimes used to predict the (unknown) dependent variable.
Bob says that prediction includes "any output of a model or theory that relates to data that was not given to the model before-hand (either explicitly as input, or implicitly as data used to derive a relationship included in the model)". Taylor (2012) says CMIP5 includes near-term "simulations focusing on recent decades and the future to year 2035. These 'decadal predictions' are initialized based on observations and will be used to explore the predictability of climate and to assess the forecast system's predictive skill." Global mean surface temperature observatons to (about) 2014 were available before CMIP5, and were used to develop the model. The model has had direct or indirect input from the independent variable (GMST) during its development - this is completely different to the prediction of gravitational waves or the location of new deposits of cude oil.
The graph presented by Dana is "based on observations" up to about 2014, so it models or describes these observations but it does not predict them (either in the future or as unknowns) . As the Taylor (2012) CMIP5 paper says, the model's predictive skills will be tested in the period from now up to 2035 and beyond.
So I think Dana's usage is incorrct both technically and in terms of the common meaning of "predicting". Even if the usage were technically correct, if "the goal of Skeptical Science is to explain what peer reviewed science has to say about global warming" to the general public, then then it should use words in the same sense as the general public, or make it very clear that jargon is being used.
The post should say that the graph shows that (CMIP5) "climate models have done an excellent job describing [or modeling] how much temperatures at the Earth’s surface would warm" - not predicting.
-
Tom Curtis at 08:12 AM on 22 February 2016Republicans' favorite climate chart has some serious problems
Tom Dayton @12, I certainly agree that having baselined by trends intersecting at the first year in which all data sources provide data, Christy should have shown the actual trend lines (a point I made previously). I would go further and say the trend lines should have been the most prominent feature of the graph, and the uncertainty of the trend lines the second most prominent feature of the graph. I do not agree that the actual values should not have been shown at all. The variability of the data matters, as does the tendency to different trends in different periods, both of which can be approximately estimated from trendlines. (On this point, Christy can also be criticized for showing five year rather than annual means, and for showing the mean of model runs for models with multiple runs in the CMIP5 database, both of which reduce the variability in the data, ie, the reason for showing the data in addition to the trend lines.)
I certainly do not agree that you must baseline by the mean of a multidecade interval (as opposed to the intersect of trends). The appearance of the models having "underprojected early and overprojected later" that you consider a virtue is in that case entirely an artifact of the greater model trend plus the baselining method. Because of the higher trend over the baseline period, of necessity the early values are below the mean and the later values above the mean. But that tells us nothing about the performance of the models, only that they had a high trend in the baseline period. If observations have a low trend in that period, that does not show the models to be more accurate than would be the case from simply showing trends - and to the extent that it appears to do so, it is a false appearance.
Of course, I am not wedded to ordinary least squares linnear trends. If you think some other statistical model shows the variability in trends overtime better, and can be statistically justified, by all means show the data using that other method.
-
Republicans' favorite climate chart has some serious problems
Warming from surface level up to 7,200 meters vs. 15,800 meters:
Am I overly suspicious if I believe that the "bulk atmosphere" was defined as going from sea level to 50,000 feet on purpose?
RATPAC-A data is here.
-
Republicans' favorite climate chart has some serious problems
Another problem with the chart:
The "bulk atmosphere" is defined as extending all the way up to 50,000 feet (15,240 m). In most of the world this includes the lower parts of the stratosphere, and as we all know, one of the primary fingerprints of warming caused by greenhouse gases is stratospheric cooling. Comparing a climate model of the surface with observations that is partly made in the stratosphere seems quite dishonest to me, or is it just one more example of the deniers’ incompetence?
Observations made with weather balloons show the stratospheric cooling in the right part of this chart. Even the black curve in the left part of the chart (10,400 m) and to some degree the pink curve (9,200 m) show signs of slower warming than the lower part of the troposphere.
An honest comparison with CMIP-5 should exclude all observations from the 9,200 m level and higher.
-
Tom Dayton at 03:45 AM on 22 February 2016Republicans' favorite climate chart has some serious problems
Tom Curtis, I respectfully disagree with your approval of Christy's graph intersecting at a single year. I agree that looking only at trends avoids the issue of baseline choice affecting perception, but to really do that the trends should be presented alone, without the temperatures at individual times--either simply numerically, or graphically of just those trend numbers. Lots of folks have done that for quite a while.
The fact that Christy presents those temperatures at individual times means he is opening the possibility of multiple interpretations of a different sort. That would be true even if he presented trend lines only and none of the individual temperature dots. He has created the perception that the models overprojected always. If instead he had baselined more "fairly" (representatively), the models would be perceived to have underprojected early and overprojected later. That matters, because again the models do not produce trends as primary products. There is some amount of independence among the temperature projections at individual times.
-
Bob Loblaw at 02:04 AM on 22 February 2016Republicans' favorite climate chart has some serious problems
FrankShann:
The way you have worded both your comments still leaves me with the impression that you are using an overly-restrictive definition of "prediction". In science, a "prediction" includes any output of a model or theory that relates to data that was not given to the model before-hand (either explicitly as input, or implicitly as data used to derive a relationship included in the model). As Tom Curtis describes in detail, a retrodiction of data that was not used in the model is still a valid test, regardless of whether it is from the past or the future.
As a crude example (pun intended), a model that predicts where to find oil is still a good model even though the oil has been sitting in that place for millions of years. If the model only tells you where to look for oil you've already found and built into the model, it's not much use. If it helps you find oil nobody ever knew about before, then the model is good. [Even if finding an burning more oil is not good climatologically-speaking!] If you test the model by seeing if it correctly predicts the presence of oil that you know about but never told the model about, then it's still a useful test.
-
Rob Honeycutt at 01:19 AM on 22 February 2016Republicans' favorite climate chart has some serious problems
Glenn... That one does seem to be different. After I scaled it correctly the red modeled mean line rises faster than the ones in my previous chart. I'd guess he did limit it to the tropics.
-
Tony_G at 21:41 PM on 21 February 2016Animal agriculture and eating meat are the biggest causes of global warming
The Zero Carbon Australia Land Use Report (link fixed) mentioned above:
"A number of agricultural industries are among the most emissions intensive activities in Australia. Beef production, for example, is more emissions intensive than aluminium and steel production. Emissions from agriculture are even more significant when the impact of activities is calculated over 20 years instead of the more common 100-year accounting approach. When considered from this perspective, agricultural emissions could account for as much as 54% of Australia’s total emissions." -
FrankShann at 19:43 PM on 21 February 2016Republicans' favorite climate chart has some serious problems
Tom Curtis @7, thank you for taking the trouble to reply to my post. Dana raised the issue of "predicting", not me. He presented a graph of CMIP5 against global mean surface temperature as evidence that "climate models have done an excellent job predicting how much temperatures at the Earth’s surface would warm". I question whether that particular graph provides evidence for Dana's assertion that climate models have made accurate predictions. I would have no argument with Dana using that graph if he had said that "climate models do an excellent job describing how much temperatures at the Earth’s surface have warmed". I am trying to make a constructive contribution.
I did not challenge the statement that climate models have accurately predicted (or described) global warming, and I was not discussing the relative merits of prediction versus post hoc analysis. However, in response to your post, a scientific theory is greatly strengthened if it makes falsifiable predictions (e.g. relativity and gravitational waves), and Newton's equations are respected more because they make reliable predictions (in most circumstances) than for their post hoc deduction of Galilean kinematics. -
Glenn Tamblyn at 16:56 PM on 21 February 2016Increasing CO2 has little to no effect
fred.steffen
In addition to the radiance calculator Tom linked to, take a look at this site from the Uni of Chicago. It uses the Modtran radiative transfer code to allow you to do what if's with IR emissions for different situations.Pick an atmospheric temperature/cloud profile, set your different GH gases then see what would be observed at different heights.
-
fred.steffen at 15:52 PM on 21 February 2016Increasing CO2 has little to no effect
@Glenn Tamblyn and @Tom Curtis, thank you very much for the information! I'm gonna try and get my head around all of that. I'll come back with more questions if I have any :)
-
Tom Curtis at 14:05 PM on 21 February 2016Republicans' favorite climate chart has some serious problems
While agreeing in general with Dana's post, I do not think Christie's graph is improperly alligned. Specifically, it is alligned so that the trend of all series passes through zero at 1979. Like the mean, a trend aggregates a large body of data, and reproduces it with fewer numbers. The mean reproduces it with just one number, while a trend reproduces it with two - the trend itself, and a reference point (the intersect) on the y-axis. That intersect is similar to a mean in the sort of information it reproduces (though differing in exact value just as modes, medians, harmonic means, and geometric means differ). In fact, given a flat timeseries with white noise, as the number of data points increases, the y-intercept will tend to approach the mean.
That being the case, the use of a y-intercept of a trend line is not the same as arbitrarilly aligning single years. Rather, it compresses the data from (in this case 36 data points) for each time-series and uses that compressed information to align the time-series.
What can be criticized on this point is that Christie, having alligned by trend, does not show the trend lines. By excluding them, the graph gives the appearance of a comparison of absolute displacement of different data points rather than a comparison of the difference in trend. He also does not show the relevant uncertainty in the trend (not the uncertainty in the anomaly value).
-
Tom Curtis at 13:50 PM on 21 February 2016Republicans' favorite climate chart has some serious problems
FrankShann @3, in logical terms, a set of propositions, x, predicts another set of propositions, y, if and only if y can be logically deduced from x. This is the fundamental relationship that underlies all explanation. Of course, sometimes we are not able to predict events from a set of propositions, but only the statistical distribution in which the event lies, or in other words, the probability of its occurence. Being human, we will often claim that something "explains" something else, when it only explains why the event is highly probable - but that does not alter the fact that fundamentally, explanation is logical deduction.
The sole difference between prediction and retrodiction is that the former is explanation before the event, and the later is explanation after the event. Logically, this is irrelevant to how impressive the explanation is. One explanation is superior to the other based on simplicity (ie, the number of entities and relationships invoked), the preciseness of the conclusion of the successful deduction, and a priori probability of the premises. Nothing else, including the time it was made, enters into the fact. We are not less impressed by Newton's deduction of Galilean kinematics from his laws of motion, nor of Keppler's laws of planetary motion from his laws of motion plus the law of universal gravitation because they were after the event - and nor should we be.
The reason we are suspicious of retrodiction is the suspicion that they are ad hoc, ie, that they relly on premises added after the event to make the prediction fit, and at the cost of the simplicity of the premises used. However, the inclussion of ad hoc premises can be tested for either before or after the event. Therefore, provided we exclude ad hoc premises, prediction is no better in a scientific theory than retrodiction. Indeed, that is necessarilly the case in science. Otherwise we would need to preffer a theory that made correct predictions into the future but entirely failed to retrodict past observations over a theory that both predicted and retrodicted past and future observations with a very high degree of accuracy but occasional failures. Indeed, as we cannot know in advance future success, science is built on the principle that successful retrodiction in the best guide to successful prediction.
Given the above, your suspicions of CMIP5 models is based on an assumption that the change between them and earlier models is from the addition of ad hoc premises. That is in fact contrary to the case. The earliest climate models, due to lacking perfect resolution, needed ad hoc adjustments to close the energy budget. They needed ad hoc values for the rate of heat absorption by the ocean because they did not model the ocean. The very earliest models required ad hoc assumptions about the ratio of increase of different GHG because they did not have the capacity to model all GHG. As computer power has been improved, these ad hoc assumptions have been progressively removed. In terms of the elegance of prediction, CMIP5 models are vastly preferrable to the older models - but that is the crucial criteria.
If we prefer the predictions of Hansen (88) as a test of the validity of climate science - we are being unscientific. The model used in Hansen (88) did not include aerosols, did not include all GHGs, used a swamp ocean, did not include a stratosphere, and was not able to be run enough to generate an ensemble of predictions (a necessary feature for generating the probabilistic predictions of climate). In short, it was a massively ad hoc model, especially when compared to its modern incarnation. Therefore, if we are interested in science rather than rhetoric, the successful retrodiction by CMIP 5 models should impress us more than successful (or unsuccessful) predictions of Hansen (88).
Nor is the development from more use of ad hoc premises to less either unusual or a problem in science. In fact it is typical. Newton started predicting the motion of planets using the ad hoc premise that planets were point masses. Later that was improved upon by the ad hoc premise that planets were empty shells with all their mass distributed evenly at their surface. Only as computational power and mathematical techniques have improved has it become possible to model planets as genuine 3-D objects with variable mass concentrations in Newton's theory. This was not a basis of rational criticism of Newton's theory, and nor is the primitive nature of the model used in Hansen (88) a valid criticism of climate science. But just as we would not prefer continuing to use point masses in prediction in gravitation, nor should we preffer the predictions of Hansen (88) over the retrodictions of CMIP5.
-
Glenn Tamblyn at 09:20 AM on 21 February 2016Republicans' favorite climate chart has some serious problems
Here is another one of his you might like to add to the comparison Rob
This one just says it is the Tropics/TMT.
-
Rob Honeycutt at 04:51 AM on 21 February 2016Republicans' favorite climate chart has some serious problems
I would like to know from Christy why he changed his graph over the year from "Global Mid-Tropospheric Temperature" to "Global Bulk Atmosphere." He's clearly using exactly the same data and calling it two different things. Here's what happens when you overlay the same graph Christy made a year earlier.
-
Tom Dayton at 00:47 AM on 21 February 2016Surface Temperature or Satellite Brightness?
Olof now reports at Moyhu that RAOBCORE and RICH balloon radiosonde datasets in fact are kept up to date.
-
SirCharles at 00:20 AM on 21 February 2016Republicans' favorite climate chart has some serious problems
Here a graph by Zeke Hausfather, Climate/Energy Scientist, U.C. Berkeley, @hausfath:

Prev 526 527 528 529 530 531 532 533 534 535 536 537 538 539 540 541 Next


