


 Arguments


Recent Comments
Prev 527 528 529 530 531 532 533 534 535 536 537 538 539 540 541 542 Next
Comments 26701 to 26750:
-
Ken in Oz at 21:06 PM on 11 November 2015G R A P H E N E
When coated with Lithium it becomes a superconductor, having no resistance to an electric current at room temperature.
As Ed pointed out - 5.9K - a wee bit cooler than most rooms. Still, it's good to know there is innovation in the pipeline with the potential to make electric ships, trucks and planes as well as cars, solar homes and businesses not merely possible but the superior option. Not all innovation makes it to commercialisation let alone ubiquitous utilisation but there is no sign that the well is drying out.
-
Tom Curtis at 19:28 PM on 11 November 2015Climate's changed before
JH inline @506, NN1953VAN-CA previously linked to the data Alley et al (2000), ie, GISP2, and Petit et al (1999), ie, Vostok, as the data justifying the claim. However, he clearly misrepresents it. Specifically, he claims temperature variations of 3 degrees for Vostok, GISP2 and global temperature series within the last 300-400 years. Vostok shows a maximum 0.36 and minimum -1.84 variation from the most recent value after 1600 AD, giving a maximum variation over that period of 2.2 C. GISP2 shows a maximum variation from the most recent value of 0 C and a minimum -0.4985 C over the same period, giving a maximum temperature variation of 0.5 C. The average** of the two shows a maximum 0 C and minimum -1.1412 C, giving a maximum variation of 1.14 C.
Of course, had he said 500 years, he would have shown a 3.17 C decline in temperature between 1553 and 1716 (163 years) for Vostok, but still not for GISP2 or the average value.
That is, of course, irrelevant as you know. Both GISP2 and Vostok are regional temperature indices, and regional temperature fluctuations are expected to be much larger than global temperature fluctuations. That is particularly true at the poles, where we expect higher value fluctuations than at the equator. If we expand the number of proxies to just eight, any notion of large scale global temperature fluctuations over a short the centenial scale in the holocene is clearly unwarranted:

Note, the eight temperature series include both Vostok and Gisp2. As this is very well known, the question for NN1953VAN-CA is, why are they excluding data to make plausible a clearly falsified claim?
** Average taken by infilling a value for all dates by persistence within each data series, then taking the mean at each date.
Moderator Response:[JH] Thank you for the clarification.
-
NN1953VAN-CA at 14:08 PM on 11 November 2015Climate's changed before
responding to moderator,
In my comment NN1953VAN-CA @504 I was not being dismissive and I do understand nature around me.
There is no politics in my comment, unless … mentioning that CO2 is taxable??
I was trying to point out proportions in atmosphere content and emphasize proportional influence.
Somehow present content of CO2 concentration in the atmosphere does not produce mathematical models calculated temperature raise. That is point and lacks reasonable explanation.
IPCC prediction quote:
The average predicted temperature increase over the next 100 years is around 3 degrees centigrade
Looking at previous measurements – Antarctic or Greenland Ice core – Global temperature, recently (300 – 400 years ago) varied within 3 degrees in span of 200 years without significant CO2 change.Moderator Response:[JH] Please document the sources for the assertions that you have made.
[PS] Yes, your comment on tax was a completely political insertion. And your last sentence would certainly be dismissive hand-waving to me. Furthermore, your comments so far contradict your assertion "I do understand nature around me." For instance the comment "Looking at previous measurements – Antarctic or Greenland Ice core – Global temperature, recently (300 – 400 years ago) varied within 3 degrees in span of 200 years without significant CO2 change." only makes any sense if you somehow believed that science asserts that only CO2 can change the global temperature. It does not (eg see here) as both the above article and the pointers I provided indicate. Furthermore you continue to conflate local temperatures with global. A better way to assess climate sensitivity from glacial cycle (using all forcings), is discussed here (note Fig3)
-
villabolo at 13:05 PM on 11 November 2015G R A P H E N E
And what will the Koch brothers do to stop this technology?
-
chriskoz at 12:57 PM on 11 November 2015G R A P H E N E
Typo in my previous post: of course Avogardo constant is 6.022E23 atoms per mole
-
chriskoz at 12:53 PM on 11 November 2015G R A P H E N E
...one atom (0.35 nm) thick. 1 gram of graphene is sufficient to cover an area of 2,630 square metres and one square metre weighs 0.77 milligrams
2,630 m2/g seems ~right based on the calculation I've done using Avogardo constant (2.022E23 atoms per mole, i.e. 12g in case of C)
But 0.77 mg per m2 looks like a mistake. 1000mg over 2,630 m2 reduces to 0.38mg over 1 m2. Unless "1 m2" cannot exist in a single layer but for a strange reason, two layers are needed.
-
Tom Curtis at 11:44 AM on 11 November 2015Water vapor is the most powerful greenhouse gas
The misnamed "old sage" (@ 222) asserts that raindrops are "... the only generator of radiation of any significance in the atmosphere". That is, he claims the vast majority of radiation in the atmosphere comes, not from water vapour, but from water in a liquid (or, presumably, frozen) state. He provides no source or data for the claim. It is, however, a claim shown easily to be false by clear sky surface, downward IR spectrums such as this one from Wisconsin:
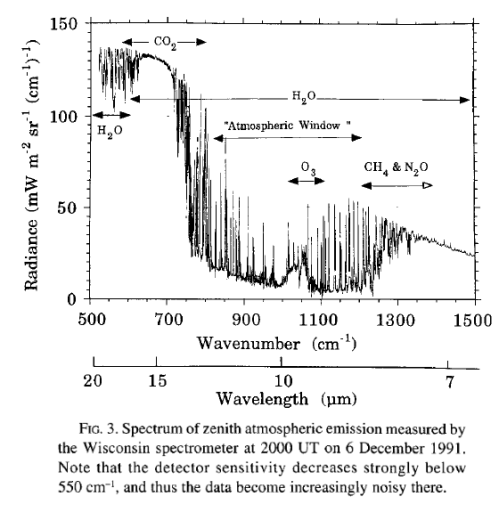
Note that the H2O lines shown are for water vapour, not liquid water which has a different spectral signature, being effectively a black body in the IR spectrum.
The relative contribution of liquid water to atmospheric radiation can be checked by comparing the cloudy and clear sky radiation using a radiation model. Using modtran, with tropical atmosphere, 0 km altitude looking up, but otherwise default settings, the back radiation is 347.91 W/m^2 in the clear sky state, and 418.25 W/m^2 with a low cumulus cloud cover. That is, the low cloud cover increases the backradiation by 70.34 W/m^2 or by 20.2%; but that liquid water contributes >50% of the total radiation where it is present.
It contributes greater than 50% because the other radiation is still emitted, but then absorbed by liquid water drops. Indeed, where present, if we consider all the radiation emitted by liquid water drops and then absorbed by other drops before escaping the cloud layer, the total emission by liquid water, where present is >> 50%, but how much greater would be very difficult to determine (and beyond the capabilities of public access radiation models). It may be this fact that "old sage" is relying on in his claim. If so, it still does not justify the claim as it only applies where the liquid water (ie, clouds) is present.
A full examination of the issue using global cloud cover and allowing for all emissions may justify the claim that liquid water in the atmosphere is responsible for the vast majority of all emissions in the atmosphere - or not. That however, is irrelevant to "old sages" specific claim, however, which was that it was "the only generator of radiation of any significance". As seen above, under some circumstances adding the cloud layer only increases backradiation by 20%, so that emission from liquid water in those circumstances is of significantly less (approx a quarter of) significance than emission by gases (including WV), because it only makes about a 25% difference to the total backradiation.
Even that, however, is overly generous to "old sage". An increase in backradiation makes no net difference to the surface energy balance because it will be balanced by increased evaporation, or increased convection (as we have all seen in the formation of cumulo-nimbus clouds). In contrast, a TOA energy balance is, in the end, only eliminated by a change in surface temperature. Therefore it is the TOA energy balance which determines the effect on GMST of changes in radiative components of the atmosphere. And there we are fairly confident about the relative effects. Specifically, CO2 contributes about 20% of the total greenhouse effect, clouds (liquid and frozen water in the atmosphere) about 25% and WV about 50%.
So, in the end, what "old sage" says may be true if "significance" is interpreted purely in terms of quantity of emission (although he has not shown it). If that is how he intended it, however, it is doubly misleading. Misleading because, by focussing on emission only and ignoring absorption, he grossly overstates the relative impact on daily weather (backradiation); and misleading because by focusing on backradiation he completely ignores the primary factor effecting global climate change.
-
Tom Curtis at 10:49 AM on 11 November 2015By rejecting Keystone, President Obama cements his climate legacy
ryland @4, another way of saying there is an increase in transport complexity is to say that the cost of the tar sands oil, delivered to market, will be greater. And if the cost is greater, sales will be less. From that it follows that, on your own assumptions, less tar sands per unit time will be consumed, because of the pipeline ban. As other, renewable energy sources become cheaper and more available, that in turn means that less tar sand oils will be consumed overall. So, from your own assumptions, it is clear that your first claim is mistaken.
Apart from that consideration, in moral issues (and the bringing of new sources of CO2 emissions to market is definitely a moral issue in todays world), that the immoral act will be done anyway by some other never excuses doing it yourself. The appeal that the tar sands oil will be transported by some other means is just the naked claim that moral considerations should be excluded from economic considerations. It do not subscribe to that sociopathy.
-
Dcrickett at 07:52 AM on 11 November 2015G R A P H E N E
When I was in college, a common saying was that it was not too urgent to quit smoking, because science was about ready to bring us "safe" cigarettes. And when I was in high school, Lewis Strauss, Chairman of the Atomic Energy Commission, promised us "electricity too cheap to meter." And we hear about the limitless inexpensive energy we'll get from fusion power.
"Graphene Power" might well be the answer to the billion+ maidens' prayers. But time scales for implementation? I fear that under the best of lucky-but-reality-based dreams, we gotta quit smoking, diet, exercise, drink more water and less alcohol... and walk/bike/bus, wear long underwear in season, etc.
-
John Hartz at 07:52 AM on 11 November 2015Water vapor is the most powerful greenhouse gas
In a press release issued yesterday (Nov 9, 2015), the World Meterological Organization (WMO) states:
Water vapour and CO2 are the two major greenhouse gases. But it is CO2 which is the main driver of climate change. Water vapour changes are the so-called feedback mechanisms and happen as a response to the change in CO2. For a scenario considering doubling of is CO2 concentration from pre-industrial conditions, i.e. from about 280 to 560 ppm, water vapour and clouds globally would lead to an increase in atmopsheric warming that is about three times that of long-lived greenhouse gases, according to the Bulletin*.
Greenhouse Gas Concentrations Hit Yet Another Record, WMO Press Release, Nov 9, 2015
*WMO Greenhouse Gas Bulletin issued Nov 9, 2015.
-
Water vapor is the most powerful greenhouse gas
old sage - Um, no. The only phrase in your comment that is correct is that "..as it warms, more water vapor is produced". Not even a complete sentence.
Water vapor acts as a feedback to CO2 driven temperature changes, and while it radiates a significant portion of climate energy to space, it's strictly through thermal emission from water vapor - not collecting energy from molecules 'dissolved in water droplets', which is complete, utter, nonsense. Nor by any means is it the only pathway to Earth emissions - CO2, CH4, CFCs, clouds, the atmospheric window, etc, all share in IR emissions.
The limiting factor in climate feedback is the Stephen-Boltzmann law, wherein energy radiated to space scales with total Earth emissivity and T4 temperatures.
I strongly suggest, 'old sage', that you do some reading before posting additional misunderstandings - The Discovery of Global Warming by Spencer Weart is an excellent and approachable place to start.
-
ryland at 06:46 AM on 11 November 2015By rejecting Keystone, President Obama cements his climate legacy
Tar sands oil will still be extracted, transported and consumed whether the pipeline is there or not. Can't quite see how this pipeline ban will affect this except to increase transport complexity.
-
old sage at 05:57 AM on 11 November 2015Water vapor is the most powerful greenhouse gas
There seems to be an obsession with positive feedback here. Earth's stability arises from the fact that as it warms, more water vapour is produced. That then rises and condenses out into water droplets. These collect translational energy from all the molecules which dissolve in them - h2o, co2, n2,o2, converting it to vibrational together with latent heat of condensation. The raindrops - being the only generator of radiation of any significance in the atmosphere - then get on with the job of pushing more energy out, the higher they are and the more complete the cloud cover the greater the portion leaving earth. It is radiation from clouds which keeps the temperature up under a cloudy sky. It's radiartion from clouds which keeps earth warmer under cloudy skies, not radiation from water vapour.
Moderator Response:[PS] Attempted to fix html.
Can I please suggest that before you criticize the science, that you take some time to first understand it. There are good resources on this site to do so. Repeatedly making nonsense assertions will be regarded as sloganeering.
-
Ed Wiebe at 03:41 AM on 11 November 2015G R A P H E N E
According to the paper about the discovery of superconducting lithium decorated monolayer graphene, it is superconducting at 5.9 K.
http://arxiv.org/abs/1508.05925Moderator Response:[PS] Fixed Link, html.
-
wili at 02:40 AM on 11 November 2015G R A P H E N E
"Graphene does not occur naturally"
Does that mean it can't be broken down by natural processes? Don't we already have problems with pollution from nano-tubes etc. Is this going to add to that problem?
-
kar at 02:38 AM on 11 November 2015Lessons from Past Climate Predictions: Wallace Broecker
Please check if you could update the correct URL for the "missing link" to the paper, in the first sentence:
... to predict future global temperature changes. His 1975 paper Climatic Change: Are We on the Brink of a Pronounced Global Warming? is widely credited with coining the term "global warming". ...
Moderator Response:[PS] Thanks for that heads up. In meantime try this link.
-
wili at 02:28 AM on 11 November 2015G R A P H E N E
"The only way to curb production of fossil fuels and ultimately end their use is to replace them with an affordable, reliable alternative."
Certainly, this is an important element in moving away from ffs. But we also need to increase efficiency and decrease total use. As Kevin Anderson has pointed out, these can be done much more quickly and radically than a build out of a whole new energy generation system. And time is one thing we don't really have enough of!
-
CBDunkerson at 23:45 PM on 10 November 2015Tracking the 2C Limit - September 2015
For future updates you may want to express the total warming as a range, or at least talk more about how the baseline impacts the result. I'm seeing more news articles mention a total warming figure, and most seem to be using a higher baseline figure.
The media will likely make a big deal when we 'pass 1 C' warming... based on whatever standard they are using. While the 1880-1909 baseline is certainly logical, you might want to try to get an idea of where the media is getting their results and what standard those sources are using. I'm wondering if it isn't just the single year 1880 value.
-
Tom Curtis at 16:17 PM on 10 November 2015Climate's changed before
NN1953VAN-CA @504, water vapour is mentioned all the time in discussing climate, as the water vapour feedback. That is because, if you suddenly doubled the amount of water vapour in the atmosphere what would happen is that over a few weeks at most, the excess water vapour would precipitate out resulting in a WV concentration similar to current values. Likewise, if you suddenly halved the WV in the atmosphere, over a few weeks at most the WV would be replenished by evaporation. The upshot is that the only effective means to change the WV concentration of the atmosphere over the long term is to change the temperature.
In contrast CO2 concentrations are far more amenable to alteration over the short term. Indeed, for periods of time less than a few hundred years, changes in CO2 concentration are an almost direct function of emissions. Consequently, be emitting CO2 we have a small effect on temperture which is reinforced by the effect of that temperature change on the water vapour concentration. Doing the reverse, however, would not work.
Finally, as an aside, concentration alone is not a good way to judge the relative effect on the total greenhouse effect of a gas. CO2 may only have one fiftieth of the concentration of WV in the atmosphere, but it has 25% of the effect on the total greenhouse effect.
Moderator Response:[PS] Any further discussion of water vapour should go to "Water vapour is the most powerful GHG".
-
NN1953VAN-CA at 15:46 PM on 10 November 2015Climate's changed before
Thank you, CO2 significance in GW
With CO2 measurements of almost 400 ppm, the recent global temperature measurements somehow do not reflect publicity given to CO2. I am trying to understand how something that is measured in ppm can make such a significant change in global temperature. At the same time, water vapor, which is present in thousand time higher concentration, is not being mentioned at all. There are dry areas on earth, trade winds carrying enormus quantity of water vapor, global circulation, ocean currents (gulf stream) all more influential than CO2 but CO2 somehow has the publicity.Maybe this is because it can be taxed, or maybe because we can't influence any other factor. Regardless, trying to prove that in the present atmosphere the CO2 at 400 ppm influences the GW and WV at 40% is not mentioned at all, somehow does not work. Our planet has a stable pattern in climate changes for millions of years with CO2 either higher or lower than now; many spices appeared and disappeared, what one has to consider natural, as if not, we as recent planet product wouldn't even come to existence.
Moderator Response:[PS] Please check your politics at the door and stick to science. Your comment about water vapour are pure sloganeering - the role of water vapour is in an integral part of science. Take the time to read what the IPCC WG1 actually says before trying to be dismissive. Just because you dont understand something doesnt mean that science doesnt either.
-
Tristan at 15:31 PM on 10 November 20152015 SkS Weekly Digest #44
Has this been toon of the week before? It's awesome.
-
chriskoz at 13:04 PM on 10 November 2015By rejecting Keystone, President Obama cements his climate legacy
Obama's he climate policy legacy may be overstated by this article.
Most of his policies, including XL rejection and fracking industry expansion, can be attributed to his desire to free US dependence on foreign fossil fuels rather to care about environment.
Perhaps his car and power plant regulations and talks with China are driven by env concerns but this XL may be not.
-
wili at 13:02 PM on 10 November 2015By rejecting Keystone, President Obama cements his climate legacy
"When we look back, the Obama Administration will be acknowledged as the first Administration to take climate change seriously"
If true, how sad, given that the Clinton Administration include Al Gore as VP. But I'm not sure one decision out weighs years of 'all of the above' policies that saw big increases in domestic oil drilling, huge increases in fracking, and continued mining of coal, much of which was sent oversees to be burnt. And of course, TransCanada may well try again with the next administration. -
John Hartz at 05:11 AM on 10 November 2015By rejecting Keystone, President Obama cements his climate legacy
Suggested supplemental reading:
Keystone pipeline rejected: Is TransCanada out of options? by Michael D. Regan, The Christian Science Monitor, Nov 8, 2015
-
John Hartz at 04:56 AM on 10 November 20152015 SkS Weekly News Roundup #45
@chriskoz #2: In light of your comment, you will want to check out:
Keystone pipeline rejected: Is TransCanada out of options? by Michael D. Regan, The Christian Science Monitor, Nov 8, 2015
-
Tom Curtis at 17:45 PM on 9 November 2015The thermometer needle and the damage done
michael sweet @11, it turns out that of the eight category 2 or stronger cyclones in the Arabian Sea, based on the NOAA database, prior to 2015:
1) All have occured north east of a line from the Maldives to Quatar;
2) The first to occur was in May of 1975, with 5 occuring after 1997;
3) Of the 6 category 3 plus, the first was in Nov, 1977, with 5 of the 6 occuring after 1997; and
4) The two category 4 plus cyclones occured in 2007 (Gonu) and 2010 (Phet).
On that basis I would agree that prima facie, the strengths of Chapala and Megh are a product of global warming.
-
michael sweet at 12:59 PM on 9 November 2015The thermometer needle and the damage done
Tom,
Dr. Jeff Masters, who is a hurricane specialist, says:
"Twin major hurricanes in the Arabian Sea: unprecedented in the historical record
Megh is the second major Category 3 or stronger tropical cyclone to affect Yemen this month. Just a week ago, Tropical Cyclone Chapala took advantage of the the warmest waters ever recorded in the Arabian Sea at this time of year to intensify into a top-end Category 4 storm with 155 mph winds (1-minute average). This made Chapala the second strongest tropical cyclone on record in the Arabian Sea, behind Category 5 Cylcone Gonu of 2007, the only Category 5 storm ever recorded in the Arabian Sea (Gonu peaked at 165 mph winds). Chapala went on to devastate Yemen's Socotra Island and mainland Yemen near the port city of Mukalla on November 3, killing at least eight people and causing widespread destructive flooding. According to NOAA's Historical Hurricanes tool, prior to this year, there had only been five major Category 3 or stronger tropical cyclones recorded in the Arabian Sea since accurate satellite records began in 1990, and an additional Category 3 storm that occurred in 1977. Thus, two major hurricanes in one month in the Arabian Sea is a remarkable occurrence." (emphasis in original).While your calculation suggests a one in 250 chance of two category 1 hurricanes near Socotra in a single year, what is the chance of two category 3 hurricanes, which are much rarer? Therecord shows that two category three or higher hurricanes in a single year have never happened before. I note that the only observed category 5 hurricane occured less than 10 years ago and its formation was affected by AGW. Previous observations, while less accurate than satalites, go back over 125 years and show no additional major hurricanes.
I stand behind the claim that the hurricanes in Yemen are an unprecedented event.
-
chriskoz at 12:22 PM on 9 November 20152015 SkS Weekly News Roundup #45
How remarkable is the fact theat on Nov 2, TransCanada asked Obama to suspend review of Keystone XL, as opposed to pressing him to review and approve for several leading years. They wanted the review to be held in Jan 2017 when Obama’s term will be over. No comment necessary: they new the rejection was coming.
IMO, the rejection is just symbolic if any of Rep candidates - hardcore science deniers - will succeed Obama. Then Transcanada will not hesitate to reapply for this time an assured permit. Our only hope is that Hillary wins, then after next 4 or 8 years the issue may become irrelevant when e.g. declining renewable prices render Keystone XL uneconomic & obsolete.
-
Tom Curtis at 11:51 AM on 9 November 2015Antarctica is gaining ice
dale38 @444, as I understand it, the study to which you refer (Zwally et al, 2015) estimates the bedrock under the East Antarctic Ice Sheet is sinking, whereas most other models and observations suggest that it is falling.
As to sea level rise due to displacement of mantle, because rock is denser than ice, more water must be drawn from the sea to displace the mantle than the volume of the mantle displaced. It follows that accumulation of ice must result in a fall in sea level, and vice versa.
-
Tom Curtis at 11:44 AM on 9 November 2015The thermometer needle and the damage done
Michael Sweet @9 the colour key to the graph is found here. Further, a better graph can be found here. It extends from 1970-2005:

Looking closely, it shows 6 tropical cyclones transiting or glancing Socrota Island in that period, of which two where hurricane strength at some stage in their history.
Bob Hensen mentions a Tropical Storm and a Tropical Depression, neither of which was at hurricane strength. Based on the NOAA hurricane tracks database, the 1984 storm passed directly over Socrota Island before striking the Yemeni mainland. There are only two storms in the region in 1960, a Tropical Storm that dissipated about 100 Nautical Miles north of Socrata Island, and a Force 1 Cyclone that dissipated about 200 NM north of Socrata Island. He ignores the Cyclone Keila in 2011, which having struck the coast of Oman, doubled back around to strike the Yemeni mainland. More importantly, he ignores strength 1 cyclone that grazed Socrota Island in 1922, along with five other tropical storms or depressions to have passed over the island in the 125 year period, including storm 12A which appears to have dropped from strenth 1 to Tropical Storm status just before landfall on Socrota Island.
Using the NOAA data, I can calculate a rough estimate of the probability of two cyclones hitting Socrota Island in a year. In all, since 1844, at least 33 storms of at least strength 1 have formed within 600 NM of Socrota Island. Of those, at least 13 have occured in a year in which another strength 1 storm also formed. That is, given that a Hurricane strenght forms in a given year, there is a 34.4% chance that another will form in the same year. Of those storms, at least 3 have passed withing 50 NM of Socrota Island while still being at least strength 1, meaning that if a strength 1 storm forms in the region, it has a 9.1% passing close enough to Socrota Island to significantly effect it. Combining the values, we then have a 3% chance that if a strength 1 storm significantly impacts Socrota Island, another will do so in the same season. Further, there is at least a 15% chance of a strength 1 storm forming in the region in any year, leading to a 0.4% chance of that occuring in any year. That is, it is a 1 in 250 year event. That has not occured before 2015, but the probability of its occuring is not so low that we should be stunned that it has occurred, or immediately leap to the conclusion that because the event is rare it was caused by global warming.
Indeed, paradoxically, we should expect 1 in 250 year events every year. That is because the odds are for a limited location. Taken across all locations globally, the chance that no 1 in 250 year meteorological event occurs is vanishingly small.
-
dale38 at 11:19 AM on 9 November 2015Antarctica is gaining ice
It is common to assume that the Earth's crust is solid. It is not. The NASA study released 10/30/2015 concludes that Antarctica has been gaining ice mass for over 10,000 years. That mass of ice has pushed parts of the continent below sea level. It follows that the mantle around Antarctica should be similarly pushed up. This is all a dynamic process which has a long lag time. In short, Antarctica could be gaining ice mass and still causing the oceans to rise.
Venus is a very poor model for the Earth as also is Mars. Venus has four times the amount of nitrogen as the Earth which indicates that it started with an atmosphere of at least four times that of Earth. Even today, with an atmosphere of 96% CO2, the average temperature at an altitude of 55 km, which corresponds to 6 km on Earth, is only 27 degrees C (80.6F). Venus also receives twice the radiation from the sun as the Earth.
Moderator Response:[PS] If read the papers, you will see that GIA is very much part of calculation (and a key uncertainty)
Please be careful to ensure comments do not drift offtopic. Nothing further on mars/venus here please.
-
NN1953VAN-CA at 11:15 AM on 9 November 2015Climate's changed before
Just to correct previous statement 'there are no links to GW' there is some influence, but not significant one
Moderator Response:[PS] Please read carefully the 3 tabs in "CO2 causing warming" and also perhaps this one. You cannot infer significance of CO2 from your presentation to date. It is logically equivalent to statement "Wildfires occur naturally therefore arson cant happen". You must consider all forcings in making inferences from past climate change.
-
NN1953VAN-CA at 11:04 AM on 9 November 2015Climate's changed before
Thanks for links - I wondered why it doesnt make them clickable. Just curious about CO2 influence, how much it really does influence climate, as there are no links to GW.
-
NN1953VAN-CA at 09:22 AM on 9 November 2015Climate's changed before
DSL,
Thank you for direction where to get more information on CO2 lag.
If we accept scientific measurements of samples done by reputable institutions and their findings for the last 5000 years, CO2 level in the atmosphere was between 250 – 280 ppm, except in last 50 years, when it raised to recent level. With CO2 stable as measured, for the past 5000 years it would be reasonable to have stable temperatures for the same period if CO2 was key factor. Measured temperature varied in last 5000 years much more with stable CO2 level, than it changed recently with CO2 gone considerably higher. There are Greenland Ice core findings and Vostok Ice core findings proving much more dynamic changes in temperature than change in CO2 in atmosphere.
Look through tables:
Historical Isotopic Temperature Record from the Vostok Ice Core
http://cdiac.esd.ornl.gov/trends/temp/vostok/jouz_tem.htm
temperature varied from 1.97 below mean and 1.33 above mean. More than 3 degrees for CO2 variation of roughly 30 ppm.
Temperature in central Greenland
LINK
Temperature varies from -32.18 to -28.75 – about the same as for Vostok, more than 3 degrees for the same change in CO2 content. (30 ppm)
CO2 content of almost 400 ppm should cause considerable temperature change if it is major factor, measured temperature increase does not reflect that.Moderator Response:[PS] Fixed links. Please use the link button in future to create therese. It would appear that either you havent read the intermediate version of article or you havent understood it. CO2 is not the only influence of climate and no scientist says that it is. Only that it is the main factor behind current warming. Also do not confuse global average temperature variation with local temperature variation.
[RH] Shortened link that was breaking page formatting.
-
Hockey stick is broken
dvaytw - Dr. Muller seens to have the view that if he has not personally done the work, personally checked the evidence, then it is in doubt. And he will thus blithely dismiss solid work, take as gospel tripe like M&M, etc. So I would take his pronouncements with large blocks of salt.
The 2006 NAS report states in its conclusions:
- It can be said with a high level of confidence that global mean surface temperature was higher during the last few decades of the 20th century than during any comparable period during the preceding four centuries. This statement is justified by the consistency of the evidence from a wide variety of geographically diverse proxies.
- Less confidence can be placed in large-scale surface temperature reconstructions for the period from A.D. 900 to 1600. Presently available proxy evidence indicates that temperatures at many, but not all, individual locations were higher during the past 25 years than during any period of comparable length since A.D. 900. The uncertainties associated with reconstructing hemispheric mean or global mean temperatures from these data increase substantially backward in time through this period and are not yet fully quantified.
- Very little confidence can be assigned to statements concerning the hemispheric mean or global mean surface temperature prior to about A.D. 900 because of sparse data coverage and because the uncertainties associated with proxy data and the methods used to analyze and combine them are larger than during more recent time periods.
So the work he signed off on indicates high confidence in the last 400 years, less confidence in the previous 600, and reasonable uncertainty about 1000 years and greater ago, based on the evidence available at that time.
In the intervening decade additional proxies have been located, producing work up to and including Marcott et al 2013, which concludes that recent temperatures represent a reversal of a cooling trend that started 5000 years ago, with current temps warmer than the mean temperatures over 82% of the Holocene (going back 11,500 years).
Muller's statements regarding paleotemperature reconstructions were reasonable a decade ago, but are now sadly out of date. And his assertions about MBH/M&M simply indicate that he hasn't looked into the M&M work - it's nonsense, multiply debunked, most notably by Wahl and Ammann 2007. M&M's failure to apply PCA selection rules alone invalidates the work, let alone their many other errors and misstatements. Muller is (once more) talking through his hat.
-
Swayseeker at 05:08 AM on 9 November 2015Q&A: Is Antarctica gaining or losing ice?
With carbon dioxide increasing it seems that the world is going to get warmer so I do not doubt that global warming is taking place. However, if ice is melting at the poles and so less radiation is being reflected into the sky will this not decrease the effective sky temperature used to calculate the radiant energy lost by a surface on the ground during the day? Could this significantly decrease surface temperatures of some bodies such as ice (depending on emissivities, etc)? Also, temperature change will effect the temperature of the seawater and this could cause different proportions of microscopic sea life to result. The temperature change and different turbidity of the water will change the reflectivity the absorptivity and emissivity of the seawater. Could this significantly affect energy exchange between earth and space and between seawater and ice? For instance for snow with an effective sky temperature of 230 K I calculate a 13 W/square metre loss in energy, whereas for an effective sky temperature of 250 K I calculate a 48 W/square metre gain in energy. Used absorptivity of snow = 0.28 and emissivity=0.97. Used total solar energy (direct and diffuse) = 300W/square metre. Used surface temp of snow 260 K If you look at figures using this sort of calculation a significant portion (often the larger portion) is due to Tsky (the effective sky temperature). The aborption of total solar energy is actually a lot less than absorption of energy from the atmosphere.
-
michael sweet at 03:39 AM on 9 November 2015The thermometer needle and the damage done
Tom,
I found your graph at Wikipedia. It was not labeled very well, but it appears to me that the blue dots are tropical storm strength and other colors indicate Cyclone (hurricane) status. None of the old curves crossing Yemen are hurricane strength anywhere near Yemen or Socrotra island. Bob Hensen (who writes most of Jeff masters blog now) states:
"Aside from Chapala, only two other tropical cyclones are known to have made landfall in Yemen in the last 125 years: a destructive tropical depression in 2008, which caused an estimated 200 deaths, and a tropical storm-strength cyclone in 1960. The impact of the 2008 cyclone was magnified by heavy rains that had fallen just days earlier from the remnants of another tropical cyclone. Likewise, if Megh did make landfall on a track like Chapala’s, the potential for flooding this time could be even worse."
I understand that in times past the rare tropical storms that formed in this part of the world did not usually reach hurricane strength. The water temperatures are record warm this year, and the record is very long. This area has had sailors for centuries, Hurricanes are known to be extremely rare. The occurance of a single hurricane strength landfalling (or nearby) storm in Yemen (or Socotra) is apparently unknown for at least 125 years. Two hurricane strength storms in a single year is unprecedented.
-
ingersol at 02:25 AM on 9 November 2015Scientists warned the US president about global warming 50 years ago today
OK, thanks scandenp. Let's try it this way;
https://www.dropbox.com/s/chgc15zoflz95ko/BEST%20-%20full.jpg?dl=0
https://www.dropbox.com/s/2v3pqs5dez8c961/Broecker%20over%20BEST%20-full%20fade.jpg?dl=0
-
dvaytw at 01:30 AM on 9 November 2015Hockey stick is broken
PS MA Rodger: the NAS report in question was actually this one:
-
dvaytw at 00:57 AM on 9 November 2015Hockey stick is broken
MA Roger, I realize it's off-topic, but can you comment about my statement above that,
"I feel like, about the question of the use of the IPCC's uncertainty terminology, there's a deep misunderstanding here. Without having read much of it , I'm quite sure that climate research uses the same Frequentist standards that Dr. Muller is used to and that, if the IPCC is assessing likelihood based on a large number of such pieces of research, all of which purport to be showing statistically significant results, then in fact the IPCC is being even more conservative with its use of such terminology and not less."
With his big diatribe about statistical significance, Muller was ripping on my comment that if he's going to point out weak evidence for climate impacts on tornadoes and hurricanes, he should also point out the IPCC describes impacts on extreme drought, extreme precipitation and coastal flooding as "likely" and heat waves as "very likely". He equates the percentages for those terms as basically equalling "no evidence at all".
-
MA Rodger at 23:47 PM on 8 November 2015Hockey stick is broken
dvaytw @153.
Just reading Muller's comment @153, I feel Muller is being insincere. The NAS report (assuming this is the report in question) does echo IPCC AR5 Chapter 5 when it says:-
In terms of the average surface temperature of Earth, these indirect estimates show that 1983 to 2012 was probably the warmest 30-year period in more than 800 years.
The only issue here is that Mann et al (1998) provided a 1,000 year proxy record not an 800 year record. To ignore this 800 year finding shows somebody playing with Ockkhams broom. But he is less than adept at sweeping things under carpets with such a broom because when he says "there was no evidence that the current temperature is the warmest in 1,000 years," he is plain wrong. There is evidence but it is not strong enough. The relevant part of IPCC AR5 is 5.3.5.1 which says:-
Based on multiple lines of evidence (...), published reconstructions and their uncertainty estimates indicate, with high confidence, that the mean NH temperature of the last 30 or 50 years very likely exceeded any previous 30- or 50-year mean during the past 800 years (...). The timing of warm and cold periods is mostly consistent across reconstructions (in some cases this is because they use similar proxy compilations) but the magnitude of the changes is clearly sensitive to the statistical method and to the target domain (land or land and sea; the full hemisphere or only the extra-tropics;). Even accounting for these uncertainties, almost all reconstructions agree that each 30-year (50-year) period from 1200 to 1899 was very likely colder in the NH than the 1983–2012 (1963–2012) instrumental temperature.
NH reconstructions covering part or all of the first millennium suggest that some earlier 50-year periods might have been as warm as the 1963–2012 mean instrumental temperature, but the higher temperature of the last 30 years appear to be at least likely the warmest 30-year period in all reconstructions (...). However, the confidence in this finding is lower prior to 1200(AD), because the evidence is less reliable and there are fewer independent lines of evidence. There are fewer proxy records, thus yielding less independence among the reconstructions while making them more susceptible to errors in individual proxy records. The published uncertainty ranges do not include all sources of error (...), and some proxy records and uncertainty estimates do not fully represent variations on time scales as short as the 30 years considered ... . Considering these caveats, there is medium confidence that the last 30 years were likely the warmest 30-year period of the last 1400 years. (My bold.)
Thus all Muller's blather about 33% applies to hockey sticks longer than 800 years. He conveniently forgets to mention the "very likely" status of the 800 year hockey stick which in IPCC-speak means a greater than 90% liklihood but less than 99% (which would be classed "virtually certain" ). For longer 1,000 year hockey sticks there is evidence, it does point to recent temperatures being warmer but the evidence is not reliable enough to strongly support it.
-
wili at 23:12 PM on 8 November 20152015 SkS Weekly News Roundup #45
If one cyclone hitting Yemen was "rare," what word can express how weird it is that two are hitting that war torn country within a week of each other--after nearly a hundred years without any?!
-
Tom Curtis at 21:03 PM on 8 November 2015The thermometer needle and the damage done
wili @6, the al jazeera article to which you link indicates that Socrota Island being struck by two cyclones in one season is unprecedented, not that its being struck by a cyclone at all is unprecedented. Indeed, the following map of cyclone tracks shows that while uncommon, cyclones are definitely not unprecedented in the region, with 10 occuring of the Yemeni/Somali coast between 1980 and 2005, and with at least one of those striking Socrota Island and one stricking the Arabian Peninsula almost precisely on the border between Yemen and Oman. Given that single cyclones are unusual, but not unprecedented, nothing significant follows from just one season with two cyclones in the region.

-
Andy Skuce at 16:52 PM on 8 November 2015The thermometer needle and the damage done
Well, yes, denisaf and wili, the Burke study only looked at the effect of temperature, not resource depletion, nor extreme weather.
-
wili at 14:08 PM on 8 November 2015The thermometer needle and the damage done
Yemen is about to be hit by its second cyclone in a week...after seeing not one cylcone in nearly 100 years.
Do you think maybe, just maybe, something's a bit...out of kilter??
earth.nullschool.net/#current/wind/surface/level/orthographic=-309.08,10.96,2584
-
denisaf at 09:38 AM on 8 November 2015The thermometer needle and the damage done
This assesment of the relation between climate change and economies can quite easily lead to misjudgment on what will happen in the future because it only deals with some aspects of how civilization operates. The holistic scenario is that society is very dependent on the goods and services provided by a vast, irrevocable aging infrastructure operaated and maintained by using irreplaceable natural resources. Economic growth entails the usage of these natural resources at a high rate without taking into account the divestment of natural material wealth.
A rational consideration of how climate change (and ocean acidification) will affect what happens should take into account what will irrevocably happen to the infrastructure.
-
scaddenp at 06:32 AM on 8 November 2015Scientists warned the US president about global warming 50 years ago today
You cannot post images directly, you have to post links to images. See the bottom of the comments policy for tips on how to post images.
-
PhilippeChantreau at 05:44 AM on 8 November 2015Hockey stick is broken
I'm surpised he refers to M&M. Perhaps it is a different paper, but the one in which they intended to demonstrate that Mann's statistical methods generated hockey sticks was a fraud. They designed their algorithm to sort curves in such a way that the hockey stick shaped ones would come first, and then they showed only the top sample, which obviously happened to be hockey sticks. I believe there are links in this thread from a couple of years ago.
-
ingersol at 05:19 AM on 8 November 2015Scientists warned the US president about global warming 50 years ago today
I have been having fun with overlaying Broecker's grah on the instumental record. I stripped everything but the meteoological record and the combined projection from Broecker. I found a combined instrumental record graph. Calibrated the axes and used Broecker's meteorological record for verticle alignment. I get a different result from Dana's creation with Broecker being closer to the brink than he realized. See what you think.

-
sifeher at 04:12 AM on 8 November 2015Q&A: Is Antarctica gaining or losing ice?
Ma Roger @20.
I rechecked my power numbers and found that I did us 60 MW/pump x 14 x 250 (scale factor) to arrive at the 210 GW power requirement estimate. In my proposed concept, it would require 42,000 wind turbines of 5 MW each to power 3,500 pumps of 60 MW (80,000 hp) each. That would be a mega project. But the task of countering SLR is no small deal any way we look at it. Thanks for your interest and attention to details. I would like to continue our chat via email: sifeher@scdinstitute.org
Prev 527 528 529 530 531 532 533 534 535 536 537 538 539 540 541 542 Next


