


 Arguments


Recent Comments
Prev 532 533 534 535 536 537 538 539 540 541 542 543 544 545 546 547 Next
Comments 26951 to 27000:
-
Andy Skuce at 08:24 AM on 15 October 2015Methane release from melting permafrost could trigger dangerous global warming
I agree that the headline is misleading. The permafrost feedback is mostly a CO2 story. Methanotrophs may well gobble up some or most of the methane in some soils, but in saturated, anoxic areas, methane will (and currently does) make it into the atmosphere. Increased vegetation growth rates probably make the Arctic a carbon sink for now, but most models do not see the vegetation keeping up once the permafrost starts to thaw in earnest. See my SkS piece on the recent Schuur et al review paper for more details.
I agree also that the text quoted by gws is potentially misleading. Anthropogenic methane emissions are about the same magnitude as natural biochemical sources. Fossil fuel emissions, in the US at least, account for about 40% of the anthropogenic methane emissions, whereas fossil fuels make up about 94% of the CO2 emissions. EPA
-
Tadaaa at 06:41 AM on 15 October 2015Meet The Denominator
Apologies I know this his is an old thread, but I have recently become interested in the whole debate around climate science, and I find this an invaluable and informative resource
I only today saw poptech's blog - fairly standard contrarian fair
but I can't help thinking it is a mistake to delete poptech's post
Moderator Response:[PS] Well it actually was a mistake. An mistaken push of "spammer" button which deletes posts and account. Given that poptech had long been in violation of comments policy, as well as tiresome troll who could not imagine any data that might change his mind, the effort to restore his posts wasnt worth it. If you think poptech has anywhere managed to say something worth discussing, feel free to comment on an appropriate thread.
-
gws at 04:22 AM on 15 October 2015Methane release from melting permafrost could trigger dangerous global warming
John,
The headline is misleading, since the permafrost warming effect is largely one coming from carbon released as CO2, not methane. As the soil thaws more methane can be formed, but also more methane will be consumed in the topsoil layer by methanotrophs. The text also does not consider the additional carbon taken up in permafrost regions as a result of changing vegetation, which is believed to counteract the soil carbon release due to increasing LAI and length of growing season.
Furthermore, the text
"Unlike carbon dioxide, which is emitted primarily through burning of fossil fuels, methane has a large natural emission component."
is also misleading because the natural CO2 sources to the atmosphere are also much larger than teh fossil fuel source. Lay people will misinterpret this. What you actually meant is that excess CO2 on top of the natural carbon cycle is driven by fossil fuel emissions (roughly 90%), while excess methane (over the preindustrial methane cycle) has a larger variability of sources.
-
digging_the_dirt at 02:18 AM on 15 October 2015Heat from the Earth’s interior does not control climate
Thanks for this very thorough article as well as the discussion .
I have run into a few other denier hypotheses; 1. That the weakening of the earth’s electromagnetic field is causing climate change. 2. That it is from HAARP. 3. That it is from climate warfare. 4. That it is caused by reduction in cloud cover. 5. That it is caused by chem-trails. Most of the above is easy to ignore.
Here’s part of my response to the cloud cover and chem-trail hypotheses:Here is some science and math related to the purpose and weather out-comes from chem-trails. It also documents increased rather than decreased cloud cover: http://meteora.ucsd.edu/~jnorris/presentations/Caltechweb.pdf
See:
Page 19 for a chart that shows the type of clouds that reduce the green house effect.
Page 29 for a discussion of anthropogenic effects that make clouds more reflective.
Pages 30 and 31--charts that explain the above.
Page 64 --last statement: "Cloud changes since 1952 have had a net cooling effect on the earth."
(Of course we know that the net cooling the clouds are providing is not enough to offset global warming.)
Important— on page 59 he states that the increase in the types of clouds which are reducing the effects of climate change cannot solely be attributed to anthropogenic sources.~~~
Thanks again, just thought if you hadn't seen this link or these hypotheses you might find the interesting.
-
qedscience at 17:53 PM on 14 October 2015Understanding climate feedbacks
@5,6,8
I have responded to your comments on my blog, I have found them very useful and thank you all for commenting. You may wish to read all the responses as they interlink to a certain extent.
Tom Curtis @5
Thank you for that clarification on volcanoes. For that paragraph in general, I did address it in one of my responses. You are right in concluding it was overtly 'emotional', I'll try not to do that in future.
Jim Eager & Glenn Tamblyn @6,8
I agree that it is really a disgrace that he was allowed to make those kind of statements in a school textbook.
-
DSL at 13:33 PM on 14 October 2015Climate's changed before
NN1953VAN-CA, where are you getting the 800 year figure? I suggest you read this post on the science of the lag.
-
NN1953VAN-CA at 12:20 PM on 14 October 2015Climate's changed before
DSL,
If CO2 concentration lags behind temperature raise for 800 ± 200 years than, when temperature starts dropping, CO2 still raises so temperature would not drop ever. Temperature drops eventually, what in that theory explains how CO2 concentration drops and what makes it drop.And on cooling cycle if CO2 lags, how higher CO2 level alows cooling, when it should be warming factor.That makes me think that CO2 is not as significant as it looks in GHG theory, there are more factors to take in calculation. Maybe physical mechanism established over a century ago needs some new aspect to warming.
Moderator Response:[PS] Please see the myth "positive feedback leads to runaway warming". The basics of feedback apply here and the effective CO2 feedback parameter is way less than 1. Rather than being century old science, ice age cycles are very active research areas. I strongly advice you at least read Chapter 5 of Ar5 to see latest work and understanding before leaping to unwarranted conclusions. The paleoclimate chapter in Ar4 is also a good index to key results and papers. The negative feedbacks associated with milankovich-induced ice sheet growth include: increased albedo, reduced production of wetland methane, and greater absorption of CO2 by cooling ocean.
-
Glenn Tamblyn at 11:05 AM on 14 October 2015Understanding climate feedbacks
QEDSscience @4. I posted a comment on your blog. That he makes the comments he does in a Chemistry textbook is astounding.
-
mancan18 at 10:08 AM on 14 October 2015Understanding climate feedbacks
Thanks for this post. It is very informative.
One of the issues that it highlights, however, is the nature of climate change uncertainty within the whole debate. It also highlights why the climate models aren't perfect, a feature common to all modelling. Even the economic models used for microtrading where shares are automatically bought and sold on stock markets in milliseconds aren't perfect. Although the models do a good job, none provide a complete picture because certain compromises have to be made because not all feedback effects are understood as entirely as they need to be and the supercomputers used for the models do not have the capacity to deal with them all.
Dealing with feedback effects is one of the main reasons that climate models do not have the necessary resolution to make predictions as precisely as the naysayers would have the models do. Because the impact of all feedbacks and the chaotic nature of the phenomena being studied means that no single model has perfect resolution. It also means no model makes perfect predictions. That is the reason why naysayers are able to sow seeds of uncertainty, create confusion and peddle their propaganda for political purposes. However, it does seems that all the models have one thing in common, if CO2 increases are taken out of the equation then the models aren't very good at simulating the real world. It also means that naysayers should be taking all the models into account, not just the ones that suit their anti-AGW and CC propaganda.
As I undertsand it, Hansen, over a decade ago, asked for a satellite to be put into orbit to obtain data related to aerosols and cloud cover so he could further refine the climate models. This was seen as unnecessary by the Bush administration. I don't know if such satellites and others required to study the impacts of climate change feedbacks exist nowadays, however, the whole episode seems to indicate those prone to naysaying because of their political views and financial interests, don't see obtaining the data as necessary. They just don't seem to even want to know.
The trouble with uncertainty related to CC due to an incomplete knowledge related to feedbacks, however, is that the outcome can be either good or bad. There is uncertainty where other more certain indicators show that something favourable should still result. This means there is no need to worry other than gaining more understanding and knowledge. Or there is an uncertainty where other certain indicators show that something undersireable may happen. This means we do need to be worried, and we do need to gain more knowledge and understanding so we can develop strategies to deal with it. Our imperfect understanding of how CC feedbacks will ultimately impact the world's climate, does have uncertainty attached to it. However, there are other indicators where our knowledge is much more certain. None of our more certain indicators show that the CC outcomes that are likely to be desireable. This is uncertainty that we should be wary of, uncertainty that even the naysayers should be wary of, and it does mean that we need to further diminish the uncertainty related to feedbacks and tipping points through further study so we gain more knowledge and understanding. This should allow the resolution of the various CC models to be further refined.
-
Jim Eager at 04:51 AM on 14 October 2015Understanding climate feedbacks
Qed, I have posted a comment at your blog. The author of your text, George Facer, seems to exhibit a disturbing pattern of injecting his biased and ill informed personal views on climate change into his textbooks.
-
Tom Curtis at 03:56 AM on 14 October 2015Understanding climate feedbacks
qedscience @4, technically questions like this should be posed on one of the Weekly Digest posts (where virtually all questions are on topic) rather than in other specific blogs where it is likely (and happens to be the case here) that they are not on topic. That said, I will briefly respond.
First, I consider it academic malpractise, equivalent in severity to plagiarism or fraud, to publish in text books work that you have not submitted and published in the peer reviewed literature. It always represents the strategy of the charlatan, of trying to persuade those without the relevant skills and expert knowledge to properly to assess your claims when you know full well that you are unable to persuade, and have not even tried to persuade, those with the relevant skills and expert knowledge. Where I a publisher, I would cease publication of all books authored by somebody who would stoop to this tactic.
Second, your response is quite good, but you do make some mistakes. In particular, volcanism was not a significant factor in build up of CO2 concentration from glacial peak to interglacial. In fact increased global temperature will increase CO2 concentrations, at least partly by reducing the ability of water to dissolve CO2. That effect probably results in a 10 ppmv increase in concentration per degree C increase in global temperature, although it may be as much as 20 ppmv per 1 degree increase. What happens when the world starts warming from a glacial is that the increased temperature results in an increase in CO2 concentration, which in turn results in a further increase in temperature.
Beyond that point, your response is very good.
-
qedscience at 01:21 AM on 14 October 2015Understanding climate feedbacks
mods, if this violates the comment policy, I'm sorry but I'm just asking for a little help.
I'm an A-level student with a blog, and I posted something on 'science denial in school textbooks', along with an attempted (fairly brief) rebuttal to something I found in one of my textbooks. I'd really appreciate it if you guys had a look and check I haven't made a fool of myself :D
https://qedscience.wordpress.com/2015/10/12/science-denial-in-school-textbooks/
I've read from SkS for about 5ish(?) years now so I haven't just turned up to spam.
thanks for reading.
Moderator Response:[RH] Activated link.
-
DSL at 23:31 PM on 13 October 2015Climate's changed before
NN1953VAN-CA, one thing you need to take into account in your reasoning: increasing CO2 in the atmosphere causes the climate system to warm. No paleo data is needed to confirm this. We have direct surface observations of the greenhouse effect (downwelling longwave radiation), and the physical mechanism has been established for well over a century. This is not about finding something to blame for the warming. The theory was established first. The warming was measured decades later.
-
ianperrin at 17:16 PM on 13 October 2015Understanding climate feedbacks
The link to Prof. Wolff's article has changed to:
http://www.carbonbrief.org/guest-post-understanding-climate-feedbacks/
-
NN1953VAN-CA at 13:40 PM on 13 October 2015Climate's changed before
My observation on warming
Why to take el Nino effect together with CO2 effect, is there any connection with El Ninios and CO2 levels in the past?
El Nino and tectonic activity may be linked, effect of el Nino is definitely more influential then CO2 as trend is shorter with more effects.
How to blame CO2 when there were periods in the past of the planet when it was warmer with lower CO2 level and colder with CO2 higher.
Another question is: How to get reliable trend out of 200 years of observation, when this planet has trend of warming or cooling which lasts several hundreds thousands years. It may give short trends at the best but hardly indicate global planet trend in long time perspective.There are sometimes polar wortex - when good part of continent freezes for several weeks, anyone tried to link to global trends.
-
Tom Curtis at 07:04 AM on 13 October 2015It's the sun
Pfc Parts @1153:
1)
"The paleo record clearly shows an upward trend in TSI. To counter the obvious conclusion reached from these measures, the author changes his reference to satellite observations, which show a locally declining trend. This is, without doubt, a choice biased by the author's ideology and his intention to refute a rising TSI either exists or is a significant factor in rising global temperature."
This is transparently false. The sunspot number shows the same decline since 1979 (ie, since the commencement of satellite observations) as is to be found in the PMOD TSI index.
2)
"In general, use of measures for either solar output (TSI) or surface temperature taken before the broad use of the telegraph should be discarded; these measures were taken by hand using uncalibrated instruments and communicated by horse drawn carriage and sailing ship. The are not accurate or precise to the levels claimed by the models based on them, which are defined in fractions of a Watt and degree Centigrade. It's frankly absurd to use these data. Reconstructions (Wang et. al.) are even more difficult to accept; the error of estimate exeeds the observed variation in the measured value."
Uncertainty of the mean of n independent variables equals the uncertainty of the measurement divided by the square root of the number of measurements. Therefore if we have a number of observations with an uncertainty of 2 then we have uncertainties of (with number observations followed by uncertainty:
2 0.71
5 0.45
10 0.32
20 0.22
100 0.10
200 0.07
1000 0.03
2000 0.02
10000 0.01As can be seen, uncertainty decreases rapidly with multiple measurements. Ergo, the uncertainty in such things as global means surface temperature due to even quite large instrument errors is small. Uncertainty due to coverage biases are a different matter but that has nothing to do with the accuracy of instruments or the means of communicating results.
Clearly your mathematical argument does not hold water (which is itself no surprise as the scientists doing the reconstructions are themselve competent mathematicians).
@1154, the linear regressions in question are not thermodynamic equations. Ergo your "point" is a simple non sequitur.
-
Pfc. Parts at 05:58 AM on 13 October 2015It's the sun
And it could be useful for hte author to explain why the data reductions presented (the models) were based on multiple liner regression? By all accounts (and I do mean all) thermodynamic systems have the signature characteristic ov being non-linear.
-
Paul D at 05:39 AM on 13 October 2015Understanding climate feedbacks
A human positive feedback:
http://www.bbc.co.uk/news/science-environment-34501867
Yep, ignore the cause of climate change then use the excuse that people need help fighting climate change to justify more oil extraction to pay for the help. -
Pfc. Parts at 05:23 AM on 13 October 2015It's the sun
The fundamental problem with this analysis lies in the measurements used. The author begins with a paleo record (Wang 2005), which provides an estimate of TSI based on theororetical reconstructions and concludes his argument with direct instrument measures of TSI using advanced orbital measures obtained over the period between 1978 and 2010.
The paleo record clearly shows an upward trend in TSI. To counter the obvious conclusion reached from these measures, the author changes his reference to satellite observations, which show a locally declining trend. This is, without doubt, a choice biased by the author's ideology and his intention to refute a rising TSI either exists or is a significant factor in rising global temperature.
In general, use of measures for either solar output (TSI) or surface temperature taken before the broad use of the telegraph should be discarded; these measures were taken by hand using uncalibrated instruments and communicated by horse drawn carriage and sailing ship. The are not accurate or precise to the levels claimed by the models based on them, which are defined in fractions of a Watt and degree Centigrade. It's frankly absurd to use these data. Reconstructions (Wang et. al.) are even more difficult to accept; the error of estimate exeeds the observed variation in the measured value.
This is the root of the problem climateologists face when building models or presenting the results of them; they lack sufficient data. Climate change is a slow process that is detectable in very small changes. To be useful, measurements used must come from calibrated instruments with the accuracy and precision needed to build models capable of making predictions with error bars signigicantly smaller than +/- 1 degree centigrade. It is statistically impossible to use data such as those presented in this article to achieve that goal.
Impossible. This is not an ideologically based argument; it is mathematical. The problem Climate Science faces isn't theoretical, it's based on measurement. Measurements with the necessary precision and accuracy simply are not available over the necessary time frame. There is no way to correct this problem.
-
wili at 01:42 AM on 13 October 2015Understanding climate feedbacks
Thanks for presenting these important studies. It sure would be nice, though, to have a better idea of exactly how they affect the range, and the most likely value, for climate sensitivity. It seems odd that the 'wide range' link in the last line pulls up an old slr chart that does not seem to incorporate the feedbacks discussed here.
-
DSL at 23:51 PM on 12 October 2015NASA Retirees Appeal to their Own Lack of Climate Authority
zoo58, I know what the qualifier "extreme" means, but it is a qualifier. It only works as a defined noun in well-estabished context. You have not established the context of your use. I have no idea what you think of as "extreme" in the context of climate risk aversion, and I'm still have no idea who you're responding to (these "extremists" you appear to be imagining).
-
uncletimrob at 18:23 PM on 12 October 20152015 SkS Weekly Digest #41
Oh God!
I just read some of the comments on Eco-Watch about Cruz's lies. How can anyone in their right mind believe a non-scientist when he is commenting about science.
Frankly it beggars belief that if you want the facts - about anything - that you would believe opinions (Cruze the science illiterate in this case) before going to the people who have actually done some research.
Stupidity is alive and well it seems.
-
Tom Curtis at 17:34 PM on 12 October 2015CO2 lags temperature
It has now been four days since my challenge to tatelylle @496 that he either justify his apparently absurd claim that ice melt is not a feedback on changes in Global Mean Surface Temperature (GMST), or confirm that his argumentation has been based on equivocating between the cause of changes in GMST (in his earliest post, and by context of the main article) and the cause of initial melt of NH ice sheets. tatelyle has done neither. Apparently he can neither provide evidence for his claim, nor honestly admit to the equivocation that lies at the heart of his rhetoric. He has therefore demonstrated that he is either not interested in, or as MA Rodger suggests @499, not capable of coherent and honest discussion of the issues involved. Consequently I have no further interest in discussing the matter with him.
For readers following the discussion, however, I need to clarrify some issues. Specifically, tatelyle continues to make grossly inflated estimates of the Milankovitch forcing involved both changes in GMST and in the initiation of NH ice sheet melt.
For GMST, global temperatures fluctuate approximately linearly with net global Top Of Atmosphere (TOA) energy flux, subject to a lag based on thermal inertia which is large relative to a single year. It follows the relevant variation in TOA insolation is the globally, and annually averaged value. As a less accurate proxy of GMST, we could estimate regionally averaged temperatures as a function of regionally averaged net TOA flux; and from that estimate a global average temperature. This is less accurate because it ignores the large lateral heat transfers at the Earth's surface due to winds and ocean currents. However, even doing this we must again take a global, annual average. That is, if we assume NH summer temperatures vary with TOA solar flux, then the impact of that variation of GMST must still be averaged over the global surface area to reflect the impact on GMST. Ergo, tatelyle's core argument for higher relevant fluxes is based on the assumption that we are not discussing the effect of Milankovich cycles on GMST (contrary to the clear context in the main post and his initial statement of the issue).
Turning to the relevant forcing for the initiation of glacial melt, tatelyle is quite correct that it should not be globally, or hemispherically averaged. Rather, the value should be considered only over the area of ice melt. Never-the-less, tatelyle's back of the envelope calculations of the value are grossly exagerated. Specifically:
1) tatelyle uses an exagerated estimate of necessary increase in July 65o N insolation.
tatelyle uses as the baseline of his estimates a 90 W/m^2 change in mean daily insolation in July at 65o North. He draws that figure from the graph below, but only one of the upswings in summer insolation shown in that graph equals or excedes 90 W/m^2 (and that one did not result in a deglaciation). The mean increase in insolation on that chart, averaged across all upswings, is 60 W/m^2 (or 61 W/m^2 if only the two upswings leading to glaciations are counted). The median is 58 W/m^2 and the 5th percentile is 20 W/m^2. Clearly based on these figures, tatelyle's figure is at least a 50% and potentially a 350% exageration of the July 60o N insolation necessary for a deglaciation. As the largest insolation upswing did not result in a full deglaciation, it is clear that no value shown on the chart is sufficient for a deglaciation by itself, but that other factors must also be involved.

For what follows, rather than trying to estimate the exact insolation change needed, I have used the deglaciation with the smallest change in insolation, ie, the Holocene deglaciation, as a benchmark. I have calculated the values for the difference in insolation between the inosolation minimum (20 Kya) and respectively, the present, the peak Holocene insolation (9 Kya) and the onset of rapid deglaciation (15 Kya). For insolation figures I have used the data from Berger (1978) as it is considered most accurate for the present (1950) and equivalent to the more recent 1991 calculations out to 800 Kybp. As the data comes by 10 degree latitude band, I have calculated the 65o N values by taking an area weighted average of the 70o (75-65o) and the 60o (65-55o) bands. This may result in a small error as an estimate of insolation at 60o N precisely, but a better estimate of the mean insolation over the band of most significant ice sheet melt. The calculated insolation difference for July at 65oN from the insolation minimum are for 0 Kybp, 9 Kybp and 15 Kybp are respectively, 7.4 W/m^2, 51.5 W/m^2 and 29.2 W/m^2.
2) tatelyle assumes peak montly mean daily insolation over the entire melt season.
As noted, tatelyle's estimate of a 90 W/m2 insolation increase was based on July at 65o N. The insolation increase in June and August, let alone April and October, is less. As a result the mean daily summer insolation change for 65o N for LGM to Holocene maximum (20-9 Kybp) is 44.1 W/m^2, 10% less than the July value.
Of course, tatelyle challenges the use of only summer insolation. He considers it obvious that the melt season lasts 40% of the year. That is far from obvious to me. I suspect the melt season depends on latitude, altitude and local conditions. That quibble aside, in Greenland melt occurs between April and October, with the vast majority of the melt occuring in the summer months of June-August. To estimate a melt season, I note that Peter Huybers (2006) notes prior reports that melt is ice ablation correlates with positive degree days, ie, days when the 2 M air temperature rises above 0 degrees. He shows that positive degree days are highly correlated with days when TOA insolation exceeds 275 W/m^2. Using that relationship, I use a melt season consisting of any month in which mean daily insolation averages 275 W/m^2 or more - which turns out to be April-August. So defined, the TOA insolation difference averaged over the melt season at 65o N turns out to be 2.4 W/m^2 between LGM and present (20-0 Kybp), 32.4 W/m^2 for LGM to Holocene peak (20-9 Kybp), and 25.7 W/m^2 for LGM to onset of rapid deglaciation (20-15 Kybp).
3) tatelyle ignores the effect of albedo.
Being as fair as possible to tatelyle, the 32.4 W/m^2 difference between insolation minimum and maximum is the value he wanted to compute, and is just over his revised estimate of 32 W/m^2. It might appear that his inaccurate calculation has cancelled out the effect of his theoretical errors. This would be the case were it not for his most fundamental error - ignoring albedo.
Solar forcing equals TOA insolation - reflected shortwave radiation at TOA. Therefore, to calculate the equivalent of the CO2 forcing, tatelyle needs to adjust the TOA insolation for albedo. Because in this instance we are examining only the impact over the ice sheets durring the glaciation, and as we are examining the no feedback case (both from tatelyle's hypothesis and because we are examining the regional forcing), the appropriate albedo is ice sheet albedo at the start of the melt season. For Greenland that is 0.835. Adjusting for Albedo then gives us a melt season 65o N mean daily insolation of 0.4 W/m^2 for the LGM to present (20-0 Kybp), 5.3 W/m^2 for LGM to peak insolation (20-9 Kybp), and 4.2 W/m^2 for LGM to onset of rapid deglaciation (20-15 Kybp). These are overestimates of the relevant values because the calculation does not include the impact of cloud cover, which further reduces the effective mean daily insolation at the top of the ice sheet.
These values (although upper limits) are the best comparitors to tatelyles calculated value of 32 W/m^2. In particular, the difference between the LGM and the onset of rapid deglaciation probably represents the best estimate of the upper limit on the necessary regional insolation forcing change to initiate deglaciation. Based on that, tatelyle overestimates it by 660%.
Note, this is for the change in regional forcing directly impacting on the icesheet. For TOA insolation, his estimate is reasonable, and for global forcing (ie, the most relevant value), the true figure is approximately 1.3 W/m^2 over the melt season and 0.5 W/m^2 averaged over the full years forcing.
-
PhilippeChantreau at 17:33 PM on 12 October 2015NASA Retirees Appeal to their Own Lack of Climate Authority
"Character assassination"? Really? Go read WUWT and see how puny we are in that department. Over there, calls for hanging scientists are routine. Posturing is truly better described by rep. Inhoffe bringing a snow ball in the House to argue that climate change isn't happening. That's posturing. So is passing laws that banned public servants from using certain words that pertain to rising sea level because the legislators don't like these words and it's bad for seaside real estate business. Seems you have your scales skewed.
-
PhilippeChantreau at 17:13 PM on 12 October 2015NASA Retirees Appeal to their Own Lack of Climate Authority
We are erring on the side of off-topic but since moderators are allowing, I'll follow up. Your humingbird analogy is inappropriate and you qualification of car accident is equally wrong. You don't understand the initial analogy because because you fail to graps the significance of the risk at the scale of an individual vs a population.
You say car accidents are a routine every day occurrence. They are at the level of a population, but not at that of the individual experiencing the accident. For the immense majority of people involved in accidents, they are an extremely rare occurrence. Some find them rare enough that they are confident that it won't happen to them and dispense of insurance. Most people, however do get insurance, not because of the likelihood of the event, but because of dangers involved. For any given person, car accidents are not routine at all. They cause trauma, physical and psychological. They can have very serious consequences, often life changing, and always put a nasty wrench in people's plans.
The initial analogy was about the thought process of an individual assessing his risk and need for an insurance. The probability of the occurrence is low but the implications of it are very significant. Furthermore, the probability is not that low if one looks at the actual numbers, and any individual knows the results of accidents. Therefore, purchasing the insurance is a no-brainer.
At the level of the world population, we need to do the same risk assessment. The people who recently died in floods in the SE US and in France certainly would agree that risk assessment is in order if they could still do so. The fact that most of the New Orleans levees were topped over during Kathrina, the enormous storm surge leading to seawater flooding the NY subway during Sandy, the heat wave in Moscow, the fires in Australia, all these are very real and were either predicted by scientists, or are fully consistent with the theory. We have already reached the level of a continuous background of climate related adverse events. People do die from them and the damages total in the billions.
This makes your hummingbird analogy even more wrong than its sheer absurdity could. We're not talking about a remote risk, dependent on a far fecthed theory at all. We're talking about risk that has already materialized as predicted. We're talking about occurrences happening on a regular basis. How many 1000 years type of events do we need in a decade year for you to understand? How many in a single year?
Your "extreme" mumbo jumbo is completely irrelevant. Responding to future risks identical to some that have already materialized does not constitute extreme risk aversion by any stretch of the imagination. Hence the question about what is extreme, which was in fact entirely justified.
To get back on topic, you still have not come close to demonstrating that the NASA retirees that are the subject of the OP have done a true in-depth examination of the science.
-
Tom Curtis at 17:08 PM on 12 October 2015NASA Retirees Appeal to their Own Lack of Climate Authority
zoo58 @62:
"How does one decide whether someone's opinion matters or not?"
1) Your opinion does not matter if you set unrealizable standards for those whose opinion you disagree with. Thus when the letter writers write:
"We, the undersigned, respectfully request that NASA and the Goddard Institute for Space Studies (GISS) refrain from including unproven remarks in public releases and websites."
if by "unproven" they mean lacking deductive proof, they set up an unrealistic standard in that no scientific statement can possibly be proved deductively. Of course, if they are not setting up so unrealistic a standard, NASA already complies with their request in that their public statements on climate are back by comprehensive evidence.
2) Your opinion does not matter if your argument depends essentially on applying a restrictive standard on those you disagree with that you do not accept for yourself. On this count, the NASA contrarian signatories clearly fail. They make numerous claims regarding matters of fact in the letter, and provide not even a single refference in support, let alone "proof". They expect us to take their claim, for example, that NASA's public statements on climate amount to "unbridled advocacy of CO2" on their authority alone. They do not even cite their qualifications to prove their authority, so that we are expected to accept mere interns (Thomas Wysmuller) as authorative simply because they were employed by NASA.
In stark contrast, the public statements by NASA are backed be extensive peer reviewed literature - much of which is available free to the public on the NASA website.
Indeed, it is plain that you also do not accept the standard demanded of NASA. You write, "As distinguished people with related skills and education who have attempted to conduct a non-biased and in-depth examination of the evidence ..." but offer not evidence that all or any have either or both of "related skills and education", that they are "unbiased", or that they have conducted any review of the evidence. Nor will you be able to for such a review is not to be found from most (if not all) of the authors of the letter; and description of NASA's statements as "advocacy" and "extreme" shows without doubt that they are biased.
-
Tom Curtis at 16:24 PM on 12 October 2015NASA Retirees Appeal to their Own Lack of Climate Authority
zoo58 @71, in your comment @68 you write:
"The risk analysis involved in something as big as climate change (it truly impacts everything on this planet) is really, truly, extremely complex."
If, as you insist, we shoud interpret your earlier use of "extreme" ("Risk aversion taken to the extreme...") to mean "utter extreme", we must do the same here. Transparently that is not the case, however. Climate, while extremely complex, is not so complex as the action of the brain, the interaction of genes to generate life, or even sociology or psychology. Yet surely your second use emphasises the extremity of the case far more than your first.
We can take home from this that you are mistaken in claiming that your first usage is "...not according to my definition, according to the standard definition of the term...", as your second usage is valid but does not comply with your interpretation of the definition. Your inconsistent usage shows that you do not in fact believe your extremist interpretation of the dictionary definition.
Regardless of your usage, of course, it could simply be pointed out that you have taken one of five senses of the word "extreme" (the fourth sense given) and reified to to be the only usage of the term (at least when it suites your argument). That is, "Risk aversion taken to the extreme" need only mean risk aversion taken to "great or exaggerated lengths" (sense 1b) or risk aversion "exceeding the ordinary, usual, or expected" lengths (sense 1c).
In scientific terms the later woud be glossed as "risk aversion in the upper 5%ile of the population" and the amount of risk aversion needed would be dependent on the distribution of risk aversion in the population. As it is not true that 5% of the population is so risk averse that they never do anything, that also means your original claim is not true.
-
Tom Curtis at 16:04 PM on 12 October 20152015: Still No Let Up in Ocean Warming
Most of bozza's comments strike me as being either meaningless, or nonsensical. As pure noise, obstructing debate rather than aiding it. His latest seams to indicate that:
1) He does not recognize that there is an SI unit for temperature (also measured in degrees); and that
2) He mistakenly thinks that Joules are a unit of temperature.
Or, of course, it may just be pure nonsense where his act of using vagueness to maskerade as profundity is caught out again.
-
bozzza at 15:57 PM on 12 October 20152015: Still No Let Up in Ocean Warming
@ 8,
..look up SI units and you will discover you are incorrect!
-
bozzza at 15:33 PM on 12 October 20152015: Still No Let Up in Ocean Warming
Dacama: science is all about definitions.
In a very real sense science- and thus the whole world- is based on consensus and it is called, "nomenclature".
-
zoo58 at 14:02 PM on 12 October 2015NASA Retirees Appeal to their Own Lack of Climate Authority
@DSL #69
No, not according to my definition, according to the standard definition of the term that you'll find in the dictionary.
1
a : existing in a very high degree
b : going to great or exaggerated lengths : radical
c : exceeding the ordinary, usual, or expected
2
archaic : last
3
: situated at the farthest possible point from a center
4
a : most advanced or thoroughgoing
b : maximum
5
a : of, relating to, or being an outdoor activity or a form of a sport (as skiing) that involves an unusually high degree of physical risk
b : involved in an extreme sportSee: http://www.merriam-webster.com/dictionary/extreme
Taken to "the extreme" means taken to the "maximum" or farthest possible extent.
Comprendes?
Moderator Response:[JH] If you persist in lacing your comments with inflamatory remarks, they will be deleted.
Please note that posting comments here at SkS is a privilege, not a right. This privilege can be rescinded if the posting individual treats adherence to the Comments Policy as optional, rather than the mandatory condition of participating in this online forum.
Please take the time to review the policy and ensure future comments are in full compliance with it. Thanks for your understanding and compliance in this matter.
-
michael sweet at 11:42 AM on 12 October 2015NASA Retirees Appeal to their Own Lack of Climate Authority
Zoo58,
I notice a complete absence of scientific references in your diatribes about AGW. Can you cite a source to support your absurd claim that scientists do not know the damages that AGW will cause if a business as usual case? Please cite the IPCC report to support your wild, baseless claims. Please propose a reason for the 1000 year floods last week in the USA if AGW is not influencing weather. You must account for the increase in flooding rains in the USA and the drought in California at the same time. Claims of wild coincidence do not hold water, provide a real explaination. These effects were projected in advance by the scientists who study GW.
This is a scientific blog. Posters are required to cite reliable sources to support their claims. You have completely failed to cite any sources, even unreliable ones. If you want to convince people that your claims have merit you need to start citing data.
Please no more absurd claims about humming birds.
-
scaddenp at 11:40 AM on 12 October 20152015: Still No Let Up in Ocean Warming
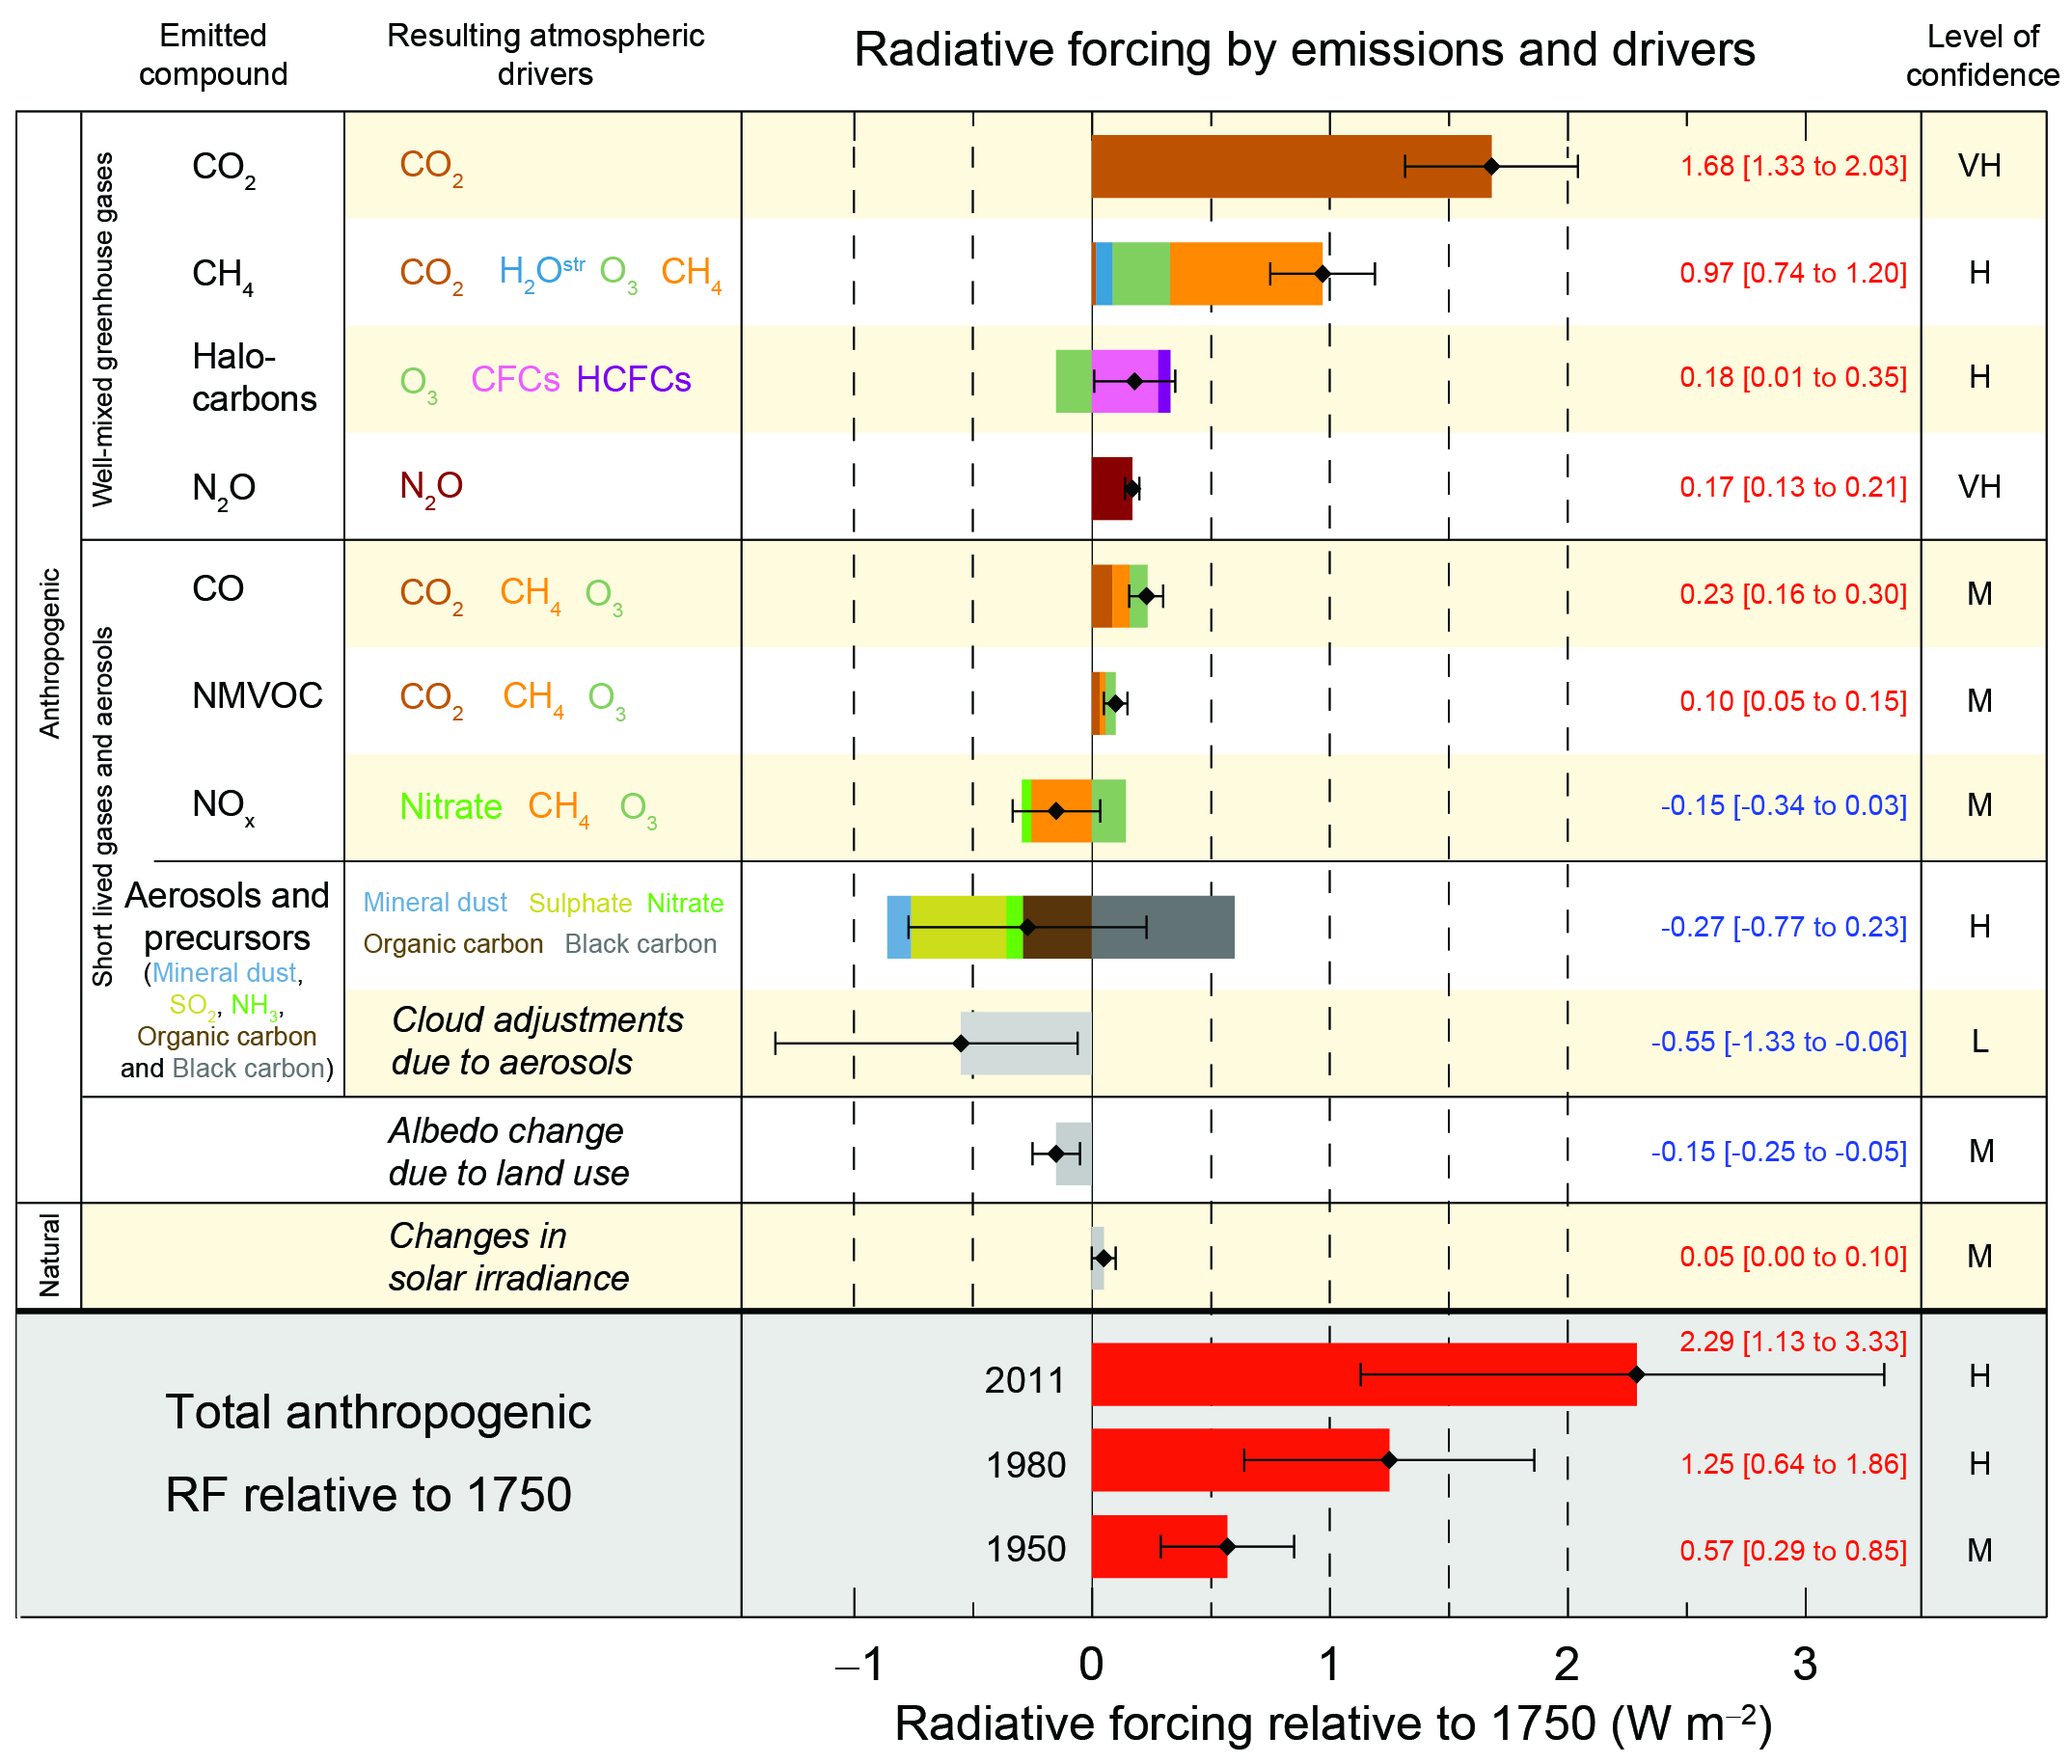
Forcings - if earth system is in equilibrium, (energy in = energy out), then 30-year temperature trend would be flat and the variations you see are those due to the uneven heating of a mostly water-covered planet. Forcings are a way of expressing perturbations to this energy balance - usually expressed as top-of-atmosphere energy fluxes, as if due to change in solar radiance. eg a reduction of the solar output, increased albedo due to land-use change, or volcanic dust sheilding are examples of negative forcings. Increases in GHG are positive forcings . Under the "resources" menu, there is a climate glossary for looking up terms. Here you find the formal definition: viz
"Radiative forcing is the change in the net, downward minus upward, irradiance (expressed in W m–2) at the tropopause due to a change in an external driver of climate change, such as, for example, a change in the concentration of carbon dioxide or the output of the Sun. Radiative forcing is computed with all tropospheric properties held fixed at their unperturbed values, and after allowing for stratospheric temperatures, if perturbed, to readjust to radiative-dynamical equilibrium. Radiative forcing is called instantaneous if no change in stratospheric temperature is accounted for. For the purposes of this report, radiative forcing is further defined as the change relative to the year 1750 and, unless otherwise noted, refers to a global and annual average value. Radiative forcing is not to be confused with cloud radiative forcing, a similar terminology for describing an unrelated measure of the impact of clouds on the irradiance at the top of the atmosphere."
-
dacama at 11:11 AM on 12 October 20152015: Still No Let Up in Ocean Warming
thanks for your time this evening... I will be back reading this site again later this week.
-
dacama at 10:53 AM on 12 October 20152015: Still No Let Up in Ocean Warming
I do not understand the expression "forcings." Would the following expression work too: "More precisely, caused by the net impact of natural and anthropogenic..."
-
scaddenp at 10:45 AM on 12 October 20152015: Still No Let Up in Ocean Warming
"the energy imbalance caused by excessive CO2 production?"
More precisely, caused by the net change in forcings, natural and anthropogenic, of which GHG, especially CO2, is the biggest component.
See this graph for the detail.
-
dacama at 10:35 AM on 12 October 20152015: Still No Let Up in Ocean Warming
Ok to #14...and thank you for your time.
-
dacama at 10:30 AM on 12 October 20152015: Still No Let Up in Ocean Warming
the energy imbalance caused by excessive CO2 production?
-
scaddenp at 10:26 AM on 12 October 20152015: Still No Let Up in Ocean Warming
"The oceans held heat energy before 1985, so why the zero on the y axis and what difference does it make?"
The OHC is an anomaly measurement. (An absolute measurement doesnt make a lot of sense). So what is measured is change of temperature since 1985 (or whatever the baseline is - I dont remember),and that is then converted to change in the amount of energy stored. Ie 17E22 Joules isnt the total energy stored in oceans (whatever that would mean), but the amount that has accumulated in the oceans since 1985.
-
scaddenp at 10:20 AM on 12 October 20152015: Still No Let Up in Ocean Warming
That is 0.09C averaged over all oceans down to 2km deep. (That amount of energy stored in the atmosphere instead of ocean would make us a fireball). Now this does not mean that oceans are going to boil anytime soon but then no one said they would. The IPCC reports detail the implications of continued temperature rise.
What is does do is confirm the energy inbalance and that it is at a rate consistent with calculated change in climate forcings. It means that earth will continue to warm till the energy does balance. The measure is interesting too because surface temperatures (where we live) are subject to a lot of internal variability (you dont need to transfer very much heat from ocean to atmosphere to warm up surface temperatures a lot as in say an El Nino) but the ocean heat content is a much better, less variable, indicator of the overall energy balance.
-
dacama at 10:13 AM on 12 October 20152015: Still No Let Up in Ocean Warming
Ok, I now understand that heat is energy and this small increase in temp means a lot of energy when spread over the entire ocean. The oceans held heat energy before 1985, so why the zero on the y axis and what difference does it make?
-
dacama at 10:01 AM on 12 October 20152015: Still No Let Up in Ocean Warming
In Levitus et al., 2012 it says in section 3 that the ocean temp has increased 0.09C since 1995. To the layman like myself I look at that number and say “what’s the big deal?” Anyone want to help me understand why it is a big deal?
-
scaddenp at 09:49 AM on 12 October 20152015: Still No Let Up in Ocean Warming
Appreciate that but temperature and energy are not same thing. Hence the "hiroshima bombs", Earthquakes, dynamite etc in the heat widget to the right of the screen.
-
DSL at 09:46 AM on 12 October 2015NASA Retirees Appeal to their Own Lack of Climate Authority
Zoo58: "Risk aversion taken to the extreme, as I qualified it, would indeed stop humanity from doing anything."
Oh, I get it now. According to your definition of "extreme," anyone who took risk aversion to the "extreme" would be bonkers. What, pray tell, is your definition of "extreme" risk aversion, and is anyone seriously advocating for it? -
zoo58 at 09:05 AM on 12 October 2015NASA Retirees Appeal to their Own Lack of Climate Authority
@DSL #65, @PhilippeChantreau #66
The analogy in this article is poor because one is a known, routine, predictable event that happens every day in America (a car collision), and the other a theoretical disaster scenario that we have never experienced (a rapid climate change disaster).
All analogies are limited, but this one is particularly bad because the author uses it to draw a connection between Americans buying collision insurance and Americans dramatically changing their energy sources in an attempt to avoid a theoretical problem. The difference should be obvious.
Admittedly, I struggled to think up a better analogy and picked a rather absurd one (from a scientific perspective), hastily, to try to demonstrate my point.
Perhaps a better analogy could be postulated in the area of infectious disease. I'm thinking out loud here... we know that high concentrations of humans in cities and frequent travel between them increases the danger of infectious outbreak and that an infectious outbreak could potentially dramatically harm humanity. Should humans cease to travel or cease building cities in an effort to reduce the risk of a large-scale outbreak?
You might argue "no" (I would) because we are smart enough that we can deal with infectious disease, get them under control, create vaccines or drugs, etc. Climate skeptics can argue analogously that we know enough about our world to mitigate to effects of and adapt to climate change.
I'm sure that you get my gist, so would either of you care to help think of strong analogy, rather than cut me down?
@PhilippeChantreau #66
The rest of the post is ripe with straw men, such as "stop humanity from doing anything", and indications of zoo58 lack of knowledge and understanding of the science underpinning the risk analysis he attempts to question.
Risk aversion taken to the extreme, as I qualified it, would indeed stop humanity from doing anything. There is unknown risk in every action. Scientific understanding of our world makes humans powerful. That power gives us more confidence that we can identify and deal with problems as they arise.
The risk analysis involved in something as big as climate change (it truly impacts everything on this planet) is really, truly, extremely complex. It's easy to blame others for not understanding it, but do you? What I perceive as cimate alarmists' penchant for character assassination and political posturing over elevating the discussion certainly does not inspire my confidence.
-
dacama at 08:54 AM on 12 October 20152015: Still No Let Up in Ocean Warming
found it ..thanks for the links.
-
dacama at 08:47 AM on 12 October 20152015: Still No Let Up in Ocean Warming
Most non scientist live in a degree world, not a joules world. Does that make sense?
-
scaddenp at 08:28 AM on 12 October 20152015: Still No Let Up in Ocean Warming
The OHC is derived from integration of temperature profile which of course means warmer at top. So when you ask for C, then temperature where? Or perhaps more importantly, why do you ask? If you want to how OHC is derived from ocean temperature measurement, then try this. If you want to know how accurately can you determine OHC given accuracy of measurement and float distribution, then try here with more recent discussion here.
-
dacama at 07:43 AM on 12 October 20152015: Still No Let Up in Ocean Warming
Hi, what does 17*10^22 joules mean in degress C or K?
Thank you.
-
PhilippeChantreau at 04:22 AM on 12 October 2015NASA Retirees Appeal to their Own Lack of Climate Authority
I would add that the OP appropriately disputes the fact the individuals mentioned have conducted a true "in depth" assessment of the science. I see nothing in zoo58's showing that their assessment really was in depth. In fact, it is abundantly clear from their declaration that it was not so.
Prev 532 533 534 535 536 537 538 539 540 541 542 543 544 545 546 547 Next


