


 Arguments


Recent Comments
Prev 538 539 540 541 542 543 544 545 546 547 548 549 550 551 552 553 Next
Comments 27251 to 27300:
-
Daniel Bailey at 07:41 AM on 27 September 2015It's not us
-
Paul Barry at 23:03 PM on 26 September 2015It's not us
Perhaps it is a while since these pages were updated?
In the sections above which discuss the radiation spectra evidence, the links to the following papers do not work: Griggs 2004, Chen 2007, Philipona 2004, Wang 2009, Evans 2006.
Perhaps an investigation into why these links are failing is in order. Is it possible to provide more durable links? Would a more complete bibliographical reference would be a good idea?
-
fk9014 at 19:58 PM on 26 September 2015Celebrated NASA planet hunter shifts his sights back to climate change on Earth
Grr, another one of those [click here to read the rest] links just to get the reader to go to the Guardian website for the final line of the article.
-
Treesong2 at 12:16 PM on 26 September 2015Celebrated NASA planet hunter shifts his sights back to climate change on Earth
I see you corrected two of the three 'Keppler's of the original article but not the 'Principle' Investigator or 'its four years of its operation'.
Bravo for Dr Borucki! I think I'll up my contribution to UCS in his honor. -
michael sweet at 08:40 AM on 26 September 2015Citi report: slowing global warming would save tens of trillions of dollars
CBDunkerson,
This is very good news indeed. Hopefully wind and solar will continue to get cheaper and more and more will be built. Thanks for the link to a good, positive read.
-
Tom Dayton at 02:16 AM on 26 September 2015Satellites show no warming in the troposphere
Tamino showed difference between RATPAC balloon measurements and satellite measurements, which sharply increases after the year 2000.
-
Tom Dayton at 02:12 AM on 26 September 2015It hasn't warmed since 1998
Tamino yesterday posted temperatures with updated removal of influences for solar, reflective aerosols, and El Nino. Still no recent pause visible. Surprise.
-
CBDunkerson at 22:57 PM on 25 September 2015Citi report: slowing global warming would save tens of trillions of dollars
We're now starting to see evidence that renewables are replacing fossil fuels even in some countries that aren't particularly rich in renewable energy and whose governments are actively opposing the transition;
Guardian: Renewable energy outstrips coal for first time in UK electricity mix
Just further evidence that economic realities are starting to drive fossil fuels out of business.
-
Tom Curtis at 16:32 PM on 25 September 2015Climate change set to fuel more "monster" El Niños, scientists warn
Ogemaniac @3, not that quickly. We will first be served with about five years of "it was only because it was a record breaking El Nino" which climate scientists will have "malliciously ignored". Only after that five year break will we start copping the "it hasn't warmed since" meme again.
-
Tom Curtis at 16:29 PM on 25 September 2015It hasn't warmed since 1998
Following KR's suggestion, I have responded to billev elsewhere.
-
Tom Curtis at 16:28 PM on 25 September 2015It's a natural cycle
"The chart, just above, shows me a pause in temperature rise from 1880 until about 1910 and one from the mid 1940's until about the mid 1970's."
As with the chart mentioned above, the chart below shows the GISS LOTI, but adds two sets of trend patterns. The first (trend pattern a) is that described by you above, while the second shows a continuous trend from 1910 to 1964, and a continous trend from 1965 to 2014. The inflexion point was chosen based on the location of the inflexion point in the radiative forcing record. That is, it was not chosen simply to get a best fit in the temperature record:

Despite that, it gives a very good fit. Ignoring the excursion in the early 1940s, they both have an r squared of 0.92, showing that on the basis of correlation there is no reason to preffer one over the other. Even including the early 40s, the cherry picked 5 trend pattern only improves squarred correlation from 0.9 to 0.92.
Against that, to gain that 0.02 lift in correlation, you need to add in 7 extra parameters. That is, you gain a minimally improved fit only by greatly increasing the ad hoc complexity of your model.
Actually, that understates it. That assumes you use an error function on th quarter wavelenght of your wave pattern (ie, the time between inflexion points). Doing so greatly decreases the likelihood of the function but means you only have on extra function. In fact, the inflection points are cherry picked to match known temperature inflexion points, not derived from a model. Ergo you require one parameter per inflexion point, or an additional three parameters.
All this means that any scientific test of the goodness of fit that also measures complexity (such as the Akaike Information Criterion) will pick the three trend pattern over the five trend pattern every time. They will also pick the pure forcing plus ENSO model (which gives an even better fit with no ad hoc parameters) over the three trend model as well, but that is beside the point.
What is important is that you only see the pattern you mention because, either, you have had it imprinted by excess familiarity from denier propaganda; or because you do not properly discount patterns for cherry picked elements. If you let the data speak for itself, and eschew cherry picking - it is obvious that there is a relatively constant rise in temperature from about 1910 to 1965, with a large aberration approximately coinciding with WW2.
-
Kiwiiano at 15:11 PM on 25 September 2015Climate change set to fuel more "monster" El Niños, scientists warn
Just curious...what causes the La Nina trade winds? Do they just happen or are they being drawn toward the warmer (presumably rising) air over the western Pacific? And do they subside during an El Nino or is air rising off the warmer eastern Pacific causing air to be sucked off the Americas, pushing any humid air away from the coast?
Or is it always a lot more complicated than that?
Moderator Response:[Rob P] Check out this video from the UK's Met Office. Yes it's a simplification, but I think it's at the appropriate level for a general audience.
-
Ogemaniac at 12:46 PM on 25 September 2015Climate change set to fuel more "monster" El Niños, scientists warn
I agree, Wol. We need to be ready for a decade or more of "Global warming stopped in 2016!".
-
It hasn't warmed since 1998
billev - I would suggest reading (and commenting upon) the Why did climate cool in the mid-20th Century, or possibly It's a natural cycle, where your recent posts would be relevent. They aren't in this thread.
Hint - Cooling mid-20th century isn't due to a natural cycle, but rather primarily due to anthropogenic factors and volcanic variability. Nor is there any reason whatsoever to expect some cycle-induced cooling to kick in.
-
Rob Honeycutt at 03:06 AM on 25 September 2015It hasn't warmed since 1998
billev... You have to understand that global temperature changes for physical reasons. The 1880-1910 trend is during a period when human greenhouse gas emissions were still very low, but starting to have an effect. At that point in time, natural forcings could have more of an influence on global temperature.
Then, think about what was happening from the 1940's through 1970, and what specifically happened in 1970. First you had WW2 and then a huge amount of industrial growth post war, which put out atmospheric aerosols which tend to block sunlight and cool the planet. Then 1970 saw The Clean Air Act, which cleaned up a large portion of the aerosol output and, essentially, unmasked the underlying greenhouse gas forcing.
-
billev at 02:15 AM on 25 September 2015It hasn't warmed since 1998
The chart, just above, shows me a pause in temperature rise from 1880 until about 1910 and one from the mid 1940's until about the mid 1970's. it also could be indicating another pause beginning about 2000 but that is not clear from this chart. I realize that I used my eyes to observe this chart but wasn't it intended that I do that?
-
Rob Honeycutt at 01:43 AM on 25 September 2015Scientists Respond To Tol’s Misrepresentation Of Their Consensus Research
Tol said at one point:
a. shut up
b. destructive comment
c. constructive commenta. is wrong
c. is not an option. I don’t have the resources to redo what they did, and I think it is silly to search a large number of papers that are off-topic; there are a number of excellent surveys of the relevant literature already, so there is no point in me replicating that.that leaves b
But even here he's not being honest since he's spent vastly more time on this issue than is required to replicate the entire Cook study. His rationale for his choices should be: a) I don't want to, b) I want to, and c) I don't want to.
-
Climate change set to fuel more "monster" El Niños, scientists warn
My prediction is that, if indeed this turns out to be a humdinger of an el nino, the deniers will say that it's all due to short term variability and nothing can be inferred from it. Ignoring the fact that they use the cherry-picked 1998 as their starting date for the "pause".
Might be a good idea to refute this argument before they try it on?
-
Acouphène at 23:42 PM on 24 September 2015Climate change set to fuel more "monster" El Niños, scientists warn
Hello,
What makes that coupling with the atmosphere is good or not?
Thanks!
-
michael sweet at 19:33 PM on 24 September 2015In a blind test, economists reject the notion of a global warming pause
GP Alldredge,
The shape of a 5 year trailing mean and a 5 year centered mean is exactly the same. It is just shifted back 2.5 years. If the "1998 peak" is not visible in the trailing mean it will also not be visible in the centered mean. 1998 is not visible because it is a short weather spike that is averaged out.
-
GP Alldredge at 18:27 PM on 24 September 2015In a blind test, economists reject the notion of a global warming pause
As Tom Curtis notes above @9, the "5-year running mean" presented to the economists is a trailing average such as an economist might expect for forcasting purposes, rather than the usual centered average as used for the multi-year averages of temperature anomalies. The 2.5-year lag forced on this 5-year mean changes the visual appearance of the 5-year mean, reducing the visual correspondence of this mean to the various prominent annual extremes in the temperature anomaly record.
For example, the prominent El Nino peak of 1998 followed by the deep La Nina minima of 1999 and 2000 is barely noticeable in the trailing 5-year average compared to that of the usual centered 5-year mean. (Similarly for the strong stratospheric-injecting volcano events of the early 1980s and 1990s.)
A subtle, but very neat touch to further disguise the real identity of the underlying data.
-
bartverheggen at 17:45 PM on 24 September 2015Scientists Respond To Tol’s Misrepresentation Of Their Consensus Research
uncletimrob asked: Does Toll really believe what he says or is he just saying because he can?
I was wondering the same, whether he was perhaps pulling a practical joke. I asked him via twitter. His response was rather evasive, on the one hand claiming that these studies don't measure anything, but on the other hand seemingly happy to draw conclusions based on (his misrepresentations of) them. See e.g. towards the end of storify.
-
Tom Curtis at 14:17 PM on 24 September 2015It hasn't warmed since 1998
Billev @358 (and prior)
1) Using GISS LOTI, the peak 18 year trend in recent decades is from 1992-2009. At 0.23 C per decade, it is 39% greater than the trend from 1981-1998, and is statistically significant. Given that, claiming the "pause" or "hiatus" started "...about the year 2000" is clearly based "put[ting] too much emphasis on individual years" - specifically, 1998.
2) The following are the successive record years (including ties) since 1880:
Year Record Interval
1880 -0.21
1881 -0.12 1
1882 -0.11 1
1900 -0.09 18
1926 -0.09 26
1931 -0.09 5
1937 -0.02 6
1940 0.08 3
1941 0.13 1
1943 0.14 2
1944 0.25 1
1980 0.28 36
1981 0.33 1
1987 0.34 6
1988 0.4 1
1990 0.44 2
1995 0.46 5
1997 0.48 2
1998 0.63 1
2002 0.63 4
2005 0.69 3
2010 0.72 5
2014 0.75 4(Interval is the number of years since the last year that set or equaled the then previous temperature record.)
As you can see, three new records have been set since 1998, and 1998 was equalled in 2002 as well. Your other putative "pause" is noted for the complete absense of records in the interval. Therefore the two phenomenon are not analogous, even if we ignore the fact that the current "pause" is an artifact of cherry picking 1998 as the start year.
3) The following is the GISS LOTI showing the running five year mean:

Looking at the five year moving average, it is very clear that there has been a more or less constant upward trend from about 1915-1970 with a single large excursion peaking in 1945. The description of the temperature history as a warming trend from 1910 to 1940 followed by a cooling trend/pause from 1940-1970 imposes a preconcieved pattern onto the data, and is not supported by that data. The 60 year sawtooth or sine pattern in the temperature data are a figment of the imagination. Therefore even if we were to be so statistically adventurous as to infer a long term cycle from a single repetion of the cycle, you would have no basis for predicting a pause from about 2000 (said pause not existing in any event).
-
Digby Scorgie at 13:41 PM on 24 September 2015Scientists Respond To Tol’s Misrepresentation Of Their Consensus Research
Is this a Tol-free website?
Sorry, I couldn't resist!
-
Rob Honeycutt at 11:42 AM on 24 September 2015It hasn't warmed since 1998
Billev... You really wouldn't want to try to discern a trend by eye, since your eyes can easily deceive you. You need to test for trends through statistics. As the moderator pointed out, SkS has a trend calculator you can use to test trends on any of the data sets for any time period you like.
-
billev at 09:59 AM on 24 September 2015It hasn't warmed since 1998
I base my observations on a perusal of the NOAA temperature charts from 1880 to the present. Those charts indicate pauses in temperature rise from about 1880 until about 1910 and again from the early 1940's until the early 1970's. A few years ago these same charts indicated a leveling of average global temperature. It seems thjat in recent years the scale of these charts has been changed to make them smaller and render it difficult to discern a trend. I am also concerned that officials of NOAA and possibly GISS have given press releases citing particular years and months as the hottest on record. I would prefer that they remain dispassionate providers of the most accurate temperature data possible. I am confused be the response to my comments. I thought, by virtue of its title, that this thread was concerned with the plausability of any pause in the rise of global temperature.
Moderator Response:[TD] You will be less confused if you actually read the original post. No, wait, don't type yet; really read it for understanding. Now read my previous comments to you. Again, read carefully for understanding. This original post is about the myth of a recent pause in the long term trend of global warming. There is another post devoted to the other myth you asserted, which is that natural cycles are responsible for pauses, coolings, and warmings. (Edit: Better phrasing is that the myth you asserted is that the recent warming circa 1970 on is due to natural cycles rather than anthropogenic causes.)
You are incorrect about the scale of the charts being changed to make trends harder to see. The data all are available for anyone to graph, and there are a bazillion graphs from both official and unofficial producers, with a variety of scales and many that are user-settable. One example is the Skeptical Science trend calculator. Statistical analyses do not in any way depend on graph scales.
Your concern over press releases is off topic. It is also bizarre since those agencies merely are stating facts that you and anyone else can check.
-
Rob Honeycutt at 08:15 AM on 24 September 2015It hasn't warmed since 1998
billev... Except that it's been fairly well established at this point that there's been no pause. Any potential pause from natural forcings is overwhelmed by the much larger radiative forcing of man-made greenhouse gases.
-
billev at 07:27 AM on 24 September 2015It hasn't warmed since 1998
I still say wait and see. Some of the years during the next pause (about 2060-2090) will be even warmer than those during this pause.
Moderator Response:[TD] Now you've focused on a topic that does not belong on this thread. If you want to claim that there are natural periodic cycles in temperature, first read the post countering the myth that It's a Natural Cycle, including watching the Denial 101x video at the bottom. Probably you are repeating reverberations from the debunked Loehle and Scafetta data torturing, so you should read that post too. Then comment on one of those threads. For yet more debunking of what climate statistician Tamino calls "mathturbation," enter "mathturbation" into the Search field on his site.
-
billev at 02:35 AM on 24 September 2015It hasn't warmed since 1998
The currently available temperature records show pauses in warming from about 1880 until about 1910 and from the early 1940's until the early 1970's. Approximately equal length periods of warming were interspersed with the pauses. If this possible pattern was real then there was cause to expect another pause in warming to begin at about the year 2000. It appears that such a pause did begin but now its presence is in dispute. It would probably be a good idea not to put too much emphasis on individual years (or months) during this period but rather assess whether or not it was a pause at ar near its probable end around 2030.
Moderator Response:[TD] It is best to read the original post before commenting. Actually read it. Thoroughly. This post is not about individual years or months. After you read the Basic tabbed pane, read the Intermediate one, and watch the Denial 101x video at the bottom of that tabbed pane. Then read the recent post "In a Blind Test," not just because of that most recent blind test being reported, but more importantly for links to the multiple previous studies using a diversity of approaches that all found there has been no recent pause in the long term warming trend. It simply does not exist. The assessment you suggested in your comment has been done already. Repeatedly. To exhaustion.
-
MA Rodger at 20:14 PM on 23 September 2015Scientists Respond To Tol’s Misrepresentation Of Their Consensus Research
uncletimrob @3,
The alternatives you present in you question aren't a dichotomy - or .
The classic lie, presenting something known to be wrong to knowingly deceive others becomes less stark as either the error becomes less obviously wrong or as it becomes seen as less important to the message (and note Tol considers his overaching message very important). Add to that the ambiguity of who the message is intended for, and the dichotomy is replaced by a whole set of possible situations. Note that the "because he can" may not entirely be about getting the peer review to accept this nonsense. Tol appears mindful that his work's rejection provides an opportunity (for him or others) to bash on about a scientific conspiracy. What fun he has!
Myself, I'm of the view that if somebody inappropriately presents egregious nonsense (like Tol is doing here) he is plainly a liar but whether he is lying to us or to himself (your question) or (in my view) to what degree the nonsense is a product of incompetence, who can say. You'd need to examine his comments in detail to see how stupid/deceitful such a man is.
In Tol's case, note the comment on his blog "That was a bit of an eye-opener." It seems he hadn't thought to carry out this analysis before which demonstrates s pretty rubbish grasp of the subject he purports to analyse.
It is also evident from Tol's blog that he holds in very low regard both the journal in which he is seeking publication and the referees he is seeking to persuade with his work.
Interesting stuff, but none of that helps in answering your/my question.
Moderator Response:[PS] Enough please. This kind of speculation serves little purpose and is borderline for the comments policy. Anyone who wants to pursue this should take it up with Toll directly.
-
uncletimrob at 18:34 PM on 23 September 2015Scientists Respond To Tol’s Misrepresentation Of Their Consensus Research
I apologise. Let me re-state my question. Does Toll really believe what he says or is he just saying because he can?
-
TonyW at 16:02 PM on 23 September 2015Tracking the 2C Limit - August 2015
So we're at 1.074 above just over a century ago (at least for now) but what is the increase above pre-industrial, which seems to be the key base-line. I've seen various estimates but is there one that has a high confidence? If, for example, the warming from 1750 to 1900 was 0.2C, we're already at 1.274 above preindustrial. Hansen thinks anything over 1C is dangerous. It's hard to disagree.
-
Don9000 at 09:02 AM on 23 September 2015Scientists Respond To Tol’s Misrepresentation Of Their Consensus Research
What is intellectual fraud if not what I've just read described and documented above?
Moderator Response:[PS] Dealing with fact is better than dealing with intent/motive or speculation on what someone may or not know/believe. An accusation of fraud implies a knowing attempt to deceive. Let's stick to fact.
-
uncletimrob at 06:23 AM on 23 September 2015Scientists Respond To Tol’s Misrepresentation Of Their Consensus Research
Is Toll being deliberately dishonest because he can be (or is paid to be perhaps), or does he really believe what he writes?
Moderator Response:[PS] No accusations of fraud etc. Please review the Comments Policy
-
Rob Honeycutt at 04:29 AM on 23 September 2015Tracking the 2C Limit - August 2015
Trevor... Sorry about that. I was talking NH Summer. June, July, August 2016.
-
Trevor_S at 20:05 PM on 22 September 2015Tracking the 2C Limit - August 2015
>but the warming continues to into the Summer.Would it be possible to use the name of months or even quarters eg Q2 2016 etc. There is a southern hemisphere, so I am unsure if you mean December 2016, the austral Summer, or not. -
BaerbelW at 14:21 PM on 22 September 2015Measuring CO2 levels from the volcano at Mauna Loa
jg recently created a neat graphic showing why Mauna Loa is a very good spot to take CO2 measurements.
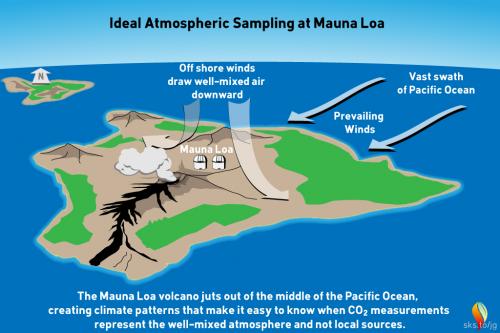
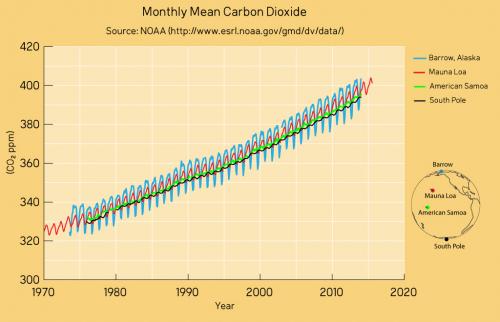
The relevant rebuttal "Mauna Loa is a volcano" was updated with it a short while ago. It also includes a cleaned up and improved version of the NOAA-graphic of CO2-concentrations measured in different places of the earth.
-
Joris van Dorp at 02:21 AM on 22 September 2015Exxon's Own Research Confirmed Fossil Fuels' Role in Global Warming Decades Ago
There is plenty of solid scholarly work on the nuclear option for solving AGW. Barry Brooks did one a few months ago. There are a few others before that. The least SkS could do mention them in the news roundup. What is stopping SkS? It's no wonder that the SkS readership seems to have bought into the 'renewables will save us' mantra that Michael Sweet holds so dear.
Here's the paper by Brook. Put it up as an article on SkS and let's have a grownup discussion.
journals.plos.org/plosone/article?id=10.1371/journal.pone.0124074
Moderator Response:[RH] At this point you're just repeating yourself, which is slogoneering and against SkS policy.
[DB] Joris has voluntarily recused himself from any further participation in this venue.
-
Rob Honeycutt at 02:00 AM on 22 September 2015Tracking the 2C Limit - August 2015
Thanks, mitch. Good point.
-
mitch at 01:19 AM on 22 September 2015Tracking the 2C Limit - August 2015
You should make certain to put the baseline period for the anomaly just after the size of the anomaly, e.g., 1.074 degrees above the 1880-1909 baseline. It took me a few minutes to find the baseline in the figure. Unfortunately, one of the ways to minimize the temperature change is to move the baseline. It is important to keep the two pieces of information together.
-
CBDunkerson at 22:31 PM on 21 September 2015Measuring CO2 levels from the volcano at Mauna Loa
Andrew B, even setting aside Tom's maps and analysis, showing that the claim of the Kilauea plume impacting readings at Mauna Loa is fiction... shouldn't the fact that there are not regular large swings in the Mauna Loa data, as winds blow or clear the plume over the observatory, have been enough to see that it was nonsense? Shouldn't the fact that readings at Mauna Loa match those at numerous other sites around the planet have been enough to see that it was nonsense? Shouldn't the fact that thousands of scientists around the world have accepted the accuracy of the Mauna Loa data for decades now, with only random bloggers claiming otherwise, have been enough to see that it was nonsense?
Here's some nice people at NASA helpfully providing additional reasons the claim is bunk;
http://earthobservatory.nasa.gov/blogs/climateqa/mauna-loa-co2-record/
-
AnotherBee at 20:49 PM on 21 September 20152015 SkS Weekly News Roundup #38
The link for the story
For California, El Niño’s Dark Clouds Could Mean Rain but Also Trouble by Adam Nagourney, New York Times, Sep 10, 2015
points to The Guardian.
It should point here http://www.nytimes.com/2015/09/11/us/for-california-el-ninos-dark-clouds-could-mean-rain-but-also-trouble.html
Moderator Response:[JH] The glitch has been fixed. Thank you for bringing it to our attention.
-
michael sweet at 20:01 PM on 21 September 2015New paper shows that renewables can supply 100% of all energy (not just electricity)
Joris,
This thread documents that renewables can provide 100% of all power. Even the most optimistic nuclear supporters do not claim they can supply more than half of electricity. Provide evidence to support your absurd claims or go away.
[Moved here from another comment by moderator]
In response to your false claim that nuclear has suffered from bad press, nuclear proponents need to stop whining. Where I live in Florida the utility executives do not care at all about Greenpeace and they control the decisions. Your claim is false on it's face. Stop wasting our time. The more you rant, the less people listen to you.
Nuclear is not being built because it is uneconomic. The current plants being built in the West are grossly overbudget and way behind schedule. I have seen the Norway plant described by a nulcear engineer as "unbuildable". So much for generation three. Wind is cheaper than existing nuclear in most of the USA already, how could nuclear possibly pay for a new plant that takes a decade to build?
Only Barry Brook, who is an ecologist not a nulcear engineer, publishes papers suggesting nuclear can be useful. He estimates that by 2060 half of electricity can be supplied by nuclear. This is too little too late. He does not estimate any costs, probably becasue it is too expensive. Renewable is ready to provide all power, ten times as much as estimated for nuclear by optimists who are not even nuclear engineers. If you cannot find published papers to support your wild claims go away.
I read a lot of papers about nuclear while doing the background for the renewable review linked above. People who research future energy supplies have given up on nuclear. It is uneconomic and cannot be built in the time necessary to do anything about AGW.
Moderator Response:[PS] Snipped section from comment in alternative place moved here.
-
michael sweet at 19:59 PM on 21 September 2015Exxon's Own Research Confirmed Fossil Fuels' Role in Global Warming Decades Ago
Joris,
You are off topic and provide no sources for your absurd claims. I responded to your false claim that renewables cannot provide baseload power here.
In response to your false claim that nuclear has suffered from bad press, nuclear proponents need to stop whining. Where I live in Florida the utility executives do not care at all about Greenpeace and they control the decisions. Your claim is false on it's face. Stop wasting our time. The more you rant, the less people listen to you.
Nuclear is not being built because it is uneconomic. The current plants being built in the West are grossly overbudget and way behind schedule. I have seen the Norway plant described by a nulcear engineer as "unbuildable". So much for generation three. Wind is cheaper than existing nuclear in most of the USA already, how could nuclear possibly pay for a new plant that takes a decade to build?
Only Barry Brook, who is an ecologist not a nulcear engineer, publishes papers suggesting nuclear can be useful. He estimates that by 2060 half of electricity can be supplied by nuclear. This is too little too late. He does not estimate any costs, probably becasue it is too expensive. Renewable is ready to provide all power, ten times as much as estimated for nuclear by optimists who are not even nuclear engineers. If you cannot find published papers to support your wild claims go away.
I read a lot of papers about nuclear while doing the background for the renewable review linked above. People who research future energy supplies have given up on nuclear. It is uneconomic and cannot be built in the time necessary to do anything about AGW.
If you want to post about nuclear, write an OP supporting nuclear and cite data. Invariably nuclear proponents go quiet when they have to provide data. Provide peer reviewed, supporting data or go away.
Joris should be banned for wasting our time with no supporting data. His willingness to bet his family is not evidence.
Moderator Response:[PS] Thank you commenting in the appropriate place. Part of comment moved there too. And yes, Joris has been invited to submit an article instead of spamming other topics.
-
Joris van Dorp at 19:09 PM on 21 September 2015Exxon's Own Research Confirmed Fossil Fuels' Role in Global Warming Decades Ago
@16. Fossil industry leaders are not against solving climate change, but they are against the idea that unilaterlally enforcing investment in uncompetitive technologies is going to solve climate change. Only *global* carbon regulation has any hope of success. Individual nations attempting to become zero-carbon by using uncompetitive technologies will merely weaken their own economies, not solve the AGW problem. As Kyoto has demonstrated, attempting to reduce carbon emissions unilaterally merely stimulates energy intensive industry to move to other countries. And that's exactly what happened. China became the worlds manufacturer by massively increasing the burning coal. Kyoto countries gained the psychological satisfaction of achieving some paper promises, but the AGW problem is global and Kyoto did absolutely nothing to solve it.
This is why some fossil fuel companies have aided and abetted climate 'skeptics'. They view the policy proposals coming out of popular sustainability sentiment as being ineffective, inappropriate and harmful.
-
Joris van Dorp at 18:52 PM on 21 September 2015Exxon's Own Research Confirmed Fossil Fuels' Role in Global Warming Decades Ago
@13. What alternatives are there to nuclear for baseload? There are none which are remotely competitive or abundant enough. Hydro and biomass are limited resources. Fossil CCS is an option, but only temporary and hard to mandate globally. solar and wind paired with storage is a no-go, due to the cost of storage. Only nuclear does the job. Why deny this?
@14. Exxon did come out with their research findings at the time. It was the basis of their decision to invest in clean energy, and they used their research to convince shareholders of the need to invest in developing alternatives. To suggest that they hid this research is nonsense.
That said, I think this discussion will go nowhere if it is denied that nuclear power has suffered from negative PR campaigning by antinuclear groups. If anything, the only way to understand why nuclear has not already solved the global climate/energy problem is this wellfunded, decades-long running negative PR. To deny the role of antinuclearism is to misunderstand why nuclear stopped expanding in the '70's and 80's.
The decision by the moderater to deny that nuclear (and by extension humanity) has been a long-term victim of antinuclear propaganda means that the discussion about solutions to climate change on SkS remains meaningless, fruitless and not up to the task. We will be discussing solutions forever, while the world burns.
I notice that many commenters are free to assert the most obvious untruths about energy and energy technology, but that only I - when I mention nuclear - get warned about it, despite the fact that I have never posted anything on SkS or elsewhere that is not backed up by solid evidence and clear reasoning. So it seems that antinuclearism is endemic in SkS moderation. Get your act together SkS!
Moderator Response:[PS] This is final warning. This deleted because it is offtopic. If you cannot comprehend this and insist on talking nuclear on unrelated threads, then you will not post here.
-
Magma at 12:39 PM on 21 September 2015In a blind test, economists reject the notion of a global warming pause
Michael & Tom, @17-19: I interpreted the study's methodology exactly as Tom did. As well, the sentence before his quote in 18 started "The sample of economists 202 (N = 25) was tested online..." which I interpreted as likely being a survey carried out with limited time and opportunity for analysis. Note that this is different from the Associated Press 2009 article by Seth Borenstein referenced in the paper, which clearly stated that its disguised data was sent to economists for analysis. See Statisticians reject global cooling
Re. 'questions' vs. agreement or disagreement with statements, yes, I was somewhat careless with my choice of words. However I stand by the assertion regarding the leading or biasing nature of the statements the economists were asked to agree with, particularly the fifth one (incompetence/fraud). -
Tom Curtis at 09:56 AM on 21 September 2015In a blind test, economists reject the notion of a global warming pause
Magma @16, with regard to your point (3), no "questions" were posed to the experts. Rather, statements were presented with the experts being asked to agree or disagree based on a six point scale. As disagreement is as easy as agreement, it is difficult to see how the survey items can be "leading questions".
In other respects, I agree with your comment.
-
Tom Curtis at 09:48 AM on 21 September 2015In a blind test, economists reject the notion of a global warming pause
michael sweet @17, the paper says:
"All experts held at least a Master’s degree or a PhD in economics or an allied discipline, with all but 4 experts reporting 5 or more years of professional experience. Participants were shown the GMST data through 2010, but presented as “world agricultural output” (see Figure 3). The graph was accompanied the following statement that experts had to evaluate in light of the plotted data ..."
In that statement, they use "graph" and "data" interchangably; the experts where "shown", not given the data; and the data is referred to as the "plotted data". All of these strongly suggest the data was presented in the graph shown as figure 3, and not also given as numerical values. Further, the stimulus given in such experiments is of the essence of the experiment. Had the experts also been given the numerical data, and that not been explicitly mentioned, that would represent a significant breech of experimental protocol. Therefore, absent clear statement to the contrary by one of the authors, we can safely assume that only the graph was presented.
-
michael sweet at 09:38 AM on 21 September 2015In a blind test, economists reject the notion of a global warming pause
Magma,
I do not see anywhere in the paper wehre it states that the economists were not given the raw data from the graph to evaluate. It also does not say that they were given the data. It seems to me that you are assuming that the data was withheld without supporting information. It seems to me that in asking for a complete evaluation the data would have to be available if the economists wanted to look at it. It would be simple to convert the temperature data into agricultural data.
Please provide support for your claim that the economists were not shown the data.
Prev 538 539 540 541 542 543 544 545 546 547 548 549 550 551 552 553 Next


