


 Arguments


Recent Comments
Prev 559 560 561 562 563 564 565 566 567 568 569 570 571 572 573 574 Next
Comments 28301 to 28350:
-
Rob Honeycutt at 02:17 AM on 3 July 2015Watts' New Paper - Analysis and Critique
John Hartz... Yup, that's the one. Which brings up a good point.
If Watts had "[decided] to pre-release in order to obtain hostile independent review" why would he be touting it as a "game changing paper?" I find this notion to be dubious at best and downright deceptive if true.
If you have a paper where you're looking for independent public review, then you should state as much up front! That's not what Tony did. He posted it making wildly unsubstantiated claims about it being something important, influential and about to be published. It strikes me as being supremely self-deluded to suggest posting it before publication was for the purposes of review.
-
KR at 00:36 AM on 3 July 2015Watts' New Paper - Analysis and Critique
Evan Jones - The only relevant 'systematic error' would of course be one in trends, in change. The issue of site quality is relevant to certainty bounds, but unless you have evidence of consistent trends in microsite driven changes in temperatures, I don't think there's much support for overall missed trend errors.
Not to mention that the US is only ~4% of the globe. I am always saddened by the arguments (both implicit and explicit) on WUWT and other sites claiming (without evidence, mind you) that US adjustments are wrong, usually with claims of malicious distortion and conspiracies, and therefore that global temperature trend estimates are also claimed to be wholly wrong.
I fully expect that the upcoming paper, regardless of the strengths or weaknesses of the work and data, will be be (mis)used as part of such arguments, just as Fall et al 2011 was. Which IMO is unfortunate; it subtracts from the actual worth of these papers.
-
John Hartz at 23:38 PM on 2 July 2015Watts' New Paper - Analysis and Critique
@Evan Jones: Is this the "game-changing" paper that Watts promised a few years ago?
-
Evan Jones at 21:11 PM on 2 July 2015Watts' New Paper - Analysis and Critique
For me, closer to four. I have been at it since Fall et al. (2011), of which I was a co-author. It was necessary to convert the ratings from Leroy (1999) to Leroy (2012). After the criticisms here and elsewhere, it was then necessary to address the outstanding issue of TOBS, station moves, and MMTS conversion. Then swing it all over from USHCN2.0 to USHCN 2.5.
The appearance of an ebullient Evan Jones to claim (in the present tense) credit for (actually) an almost three-year-old comment
Anthony made the decision to pre-release in order to obtain hostile independent review so any issues could be addressed before submission. Having done that, peer review will go a lot easier.
I hashed this out on Stoat, but we made note of the criticisms here, as well. I am not disputing the problems with raw data. But I do have some issues with the adjustment procedure, especially with homogenization.
Doc. VV and I burned through a forum-plus on Sou's blog discussing that point. He says aour findings are interesting, but thinks the divergence between the well and poorly sited stations will be acounted for by jumps. But I've run the graphs, and the divergence is as smooth as silk. He also points out that homogenization will not work if thereis a systematic error in the data. In this cas, that systematic error is microsite.
The problem is that only 22% of sample is well sited, so the well sited stations are brought into line with the poorly sited stations rather than the other way around. If one does not address siting, it is a very easy error to miss. I find it is quite unintentional on NOAA's part, but it is a severe error, nonetheless.If anyone has any specific questions about the current state of the study, I will be pleased to answer.
-
MA Rodger at 19:50 PM on 2 July 2015The Skeptical Science temperature trend calculator
Philip Shehan @80.
OLS yields 90% limits less than half that quoted by Karl et al (2015) so the 'claim' was nonsense. The method used is described as "using IPCC methodology" which is also evidently not that used by the SkS trend calculator.
-
dvaytw at 18:16 PM on 2 July 2015Update on BC’s Effective and Popular Carbon Tax
I've been arguing about this in another forum:
Climate Change - Impacts Part 2
The opposing argument against the info I posted from SkS are as follows:
1) while BC is keeping pace with the rest of Canada, it was doing better before 2008:
2) it's unlikely that a few cents' tax had such a dramatic effect on consumption:
BC's carbon tax has had little effect on fuel consumption
3) in 2014, gas consumption in BC is back up to where it was in 2008:
-
Philip Shehan at 14:39 PM on 2 July 2015The Skeptical Science temperature trend calculator
It has been claimed that Karl uses OLS calculation of confidence limits rather than autocorrelated confidence limits used in the skeptical science trend calculator. Anyone have an opinion on this?
-
Philip Shehan at 13:26 PM on 2 July 2015The Skeptical Science temperature trend calculator
cunudian:
I partly covered the problem with chopping up temperature trends into short pieces to fit skeptic argument was covered in one of my earlier long (apologies to mods) posts above.
Then there is the astonishing manner in whech people like Singer and David Whitehouse include and exclude the extreme el nino event of 1998 to suit their argument.
According to Fred Singer (my Bold):
“Not only that, but the same satellite data show no warming trend from 1979 to 2000 – ignoring, of course, the exceptional super-El-Nino year of 1998.”
Never mind that “skeptics” have been starting with the exceptional super-El-Nino year of 1998 in order to claim a “pause”.
Presumably, Singer accepts that the green line here shows a statistically warming trend.You must not include the period after December 31 1997 in a shorter period because …well, it would spoil his argument .
Singer can declare that that the purple line shows that there is no warming from 1979 to 2000, as long as you leave out the troublesome data after 1997. (The light blue line shows the inclusion of the forbidden data.)
Furthermore, according to Singer, the data from January 1 1998 onward, (the dark blue line) shows a “pause”. No problem including the el nino event at the beginning of a trend, just not at the end, because…well, it would spoil his argument.
And David Whitehouse says you must not start a trend from 2000, (brown line) because… well, it would spoil his argument too.
But back to Singer. Notice that according to his argument there more of a “pause” before the el nino event than after.
The real absurdity is his claim that there is no warming from 1979 to December 31 1997 and there is no warming from January 1 1998 to the present
But there is warming from 1979 to the present.
Singer’s argument is Alice in Wonderland stuff, achieved by chopping a statistically significant warming trend into two short periods where the noise dominates the signal.
-
Tom Curtis at 06:06 AM on 2 July 2015Temp record is unreliable
I have an actual rebutal of the empty slogan @345 here.
-
Tom Curtis at 06:04 AM on 2 July 2015We're coming out of the Little Ice Age
In an apparent flyby comment, arationofreason wrote here:
"No one doubts that we have been recovering fro the LIA for the last 160 years without the help of CO2 for at least the first 100."
Not only do I doubt it, I doubt the comment even means anything. That is because the key word is "recovery", and it is meaningless to talk about a recovery unless you can identify a ground state to which you are recovering. However, people who discuss the "recovery from the LIA" never identify that groundstate. Indeed, they insist the recovery was ongoing to the end of the 20th century even though end 20th century temperatures were likely higher than those of the Medieval Warm Period, a period of noteworthy and unusual global warmth, at least according to climate pseudo-skeptics. I have commented more on the purely rhetorical nature of the word "recovery" in this context elsewhere.
Not only do I doubt the "recovery" rhetoric based on its emptyness, however. More importantly it does not match what we know about global temperature trends.
I realized this due to a recent discussion I had about mean global temperature around 1750. The upshot is that mean global temperatures over the twenty year period centered on 1750 (1741-1760) are statistically indistiguishable from those centered on 1900, ie, there was no strong trend in mean global temperatures representing any "recovery" from the LIA.
arationofreason specifies the last 160 years, thereby restricting the timeframe to that covered by the instrumental record. Unfortunately for his hypothesis, the first 50 years of that record show a negative trend in GMST. Their "recovery" is actually an ongoing decline in GMST (see table in next paragraph), so that if we were to merely continue it, we would have had declining temperatures over the whole of the twentieth century.
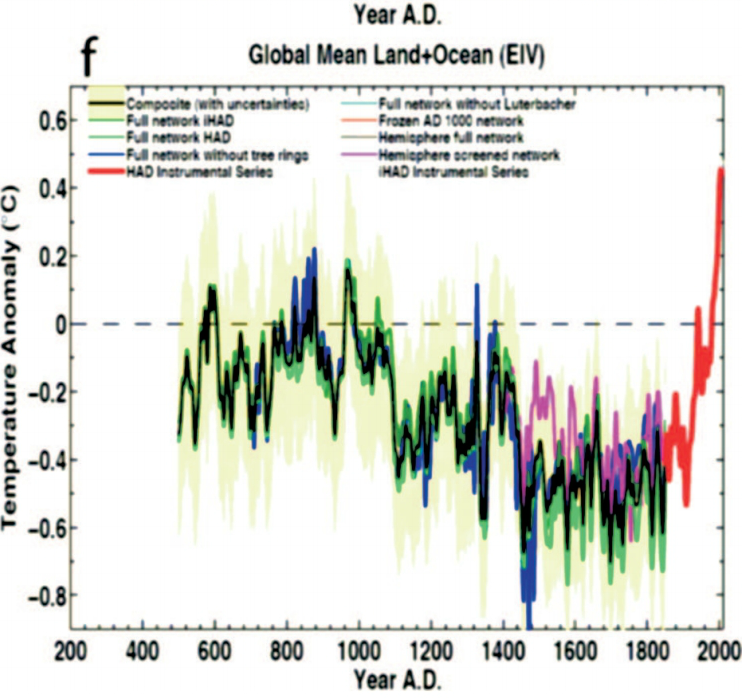
Indeed, extending beyond the instrumental record, we see that there has been no recovery going back to the most intense phase of the LIA in the seventeenth century. Using Mann08 EIV global, we find trends as:
1616-1750 -0.097 C/century (Mann08)
1751-1850 0.000 C/century (Mann08)
1851-1900 -0.020 C/century (HadCRUT4)
1901-2014 0.768 C/century (HadCRUT4)Clearly the "recovery" is a fiction of the imagination. Global temperatures declined from a peak around the 10th century AD (see graph) to a minimum around 1500 AD, from where they bumped around about the same level until after 1900, well after the start of industrial emissions of CO2.
So not only is the rhetorical appeal to the "recovery from the LIA" meaningless, it does not even get the facts about global temperature trends right.
-
KR at 05:29 AM on 2 July 2015As the Denial101x course ends, a new one begins
Wonderful work by all involved - thank you for putting forth such a valuable effort.
-
bwilson4web at 04:28 AM on 2 July 2015As the Denial101x course ends, a new one begins
Can we get some metrics?
- ~14,000 initially signed up
- ~3,114 completed
Thanks, Bob Wilson, Huntsville AL.
-
Eric Grimsrud at 00:29 AM on 2 July 2015As the Denial101x course ends, a new one begins
"Just for fun", I have created an examination for the purpose of steering students towards the traditional and "new age" employment opportunities that appear to exist today. It can be seen at https://ericgrimsrud.wordpress.com/2015/06/27/an-exam-for-professional-aptitude/
-
climatesight at 14:18 PM on 1 July 2015Cracking the mystery of the corrosive ocean
Hi and sorry I am late responding to these comments! Kaitlin here, lead author of the study...
ranyl: You're right, this corrosive water spilling over the sill couldn't happen again today, because none of the deep ocean basins today are isolated like the deep North Atlantic was during the PETM. Ocean acidification coming from the surface is still a major concern though.
knaugle: The starting concentration is 1680 ppm followed by an instantaneous carbon release of 7000 GtC. We also simulated similar behaviour in simulations with starting CO2 ranging from 840 to 2520 ppm, and carbon releases from 3000 to 10,000 GtC (including a gradual carbon release).
RickG: This model simulates present-day surface air temperatures to be about 14 C, more like 13 C for preindustrial (see Eby et al. 2013, doi:10.5194/cp-9-1111-2013). Our PETM simulations started around 24 C, followed by a warming of about 4 C. However, it's not the absolute temperature which matters for ecosystems as much as the rate and magnitude of change.
Treesong2: The deep ocean stays cooler than the surface ocean throughout the entire simulation. However, density depends not just on temperature but also on salinity. The surface and deep North Atlantic had approximately equal contributions of warming to decreased density (although the change happened faster in the surface). But in the surface ocean this was partially offset by increased salinity (due to increased evaporation). So the deep North Atlantic experienced a greater drop in density than the surface did, and eventually in some locations it was less dense than at the surface, even though it was still cooler.
Rob Painting - correct :-)
-
BC at 12:13 PM on 1 July 2015A Southern Hemisphere Booster of Super El Niño
Actually I just realised that this article is talking about the sea level pressure anomalies, which is different to the actual values which I was referring to in my previous post. Even so I'll still be looking at the weather maps with interest.
-
One Planet Only Forever at 12:13 PM on 1 July 2015A Southern Hemisphere Booster of Super El Niño
I am not computer savvy enough to make charts for comments but I have reviewed the NSIDC Arctic Ice extents here and compared them to the super El Ninos of that started in 1982 and 1997 (1972 predates the NSIDC Arctic ice extent data). I also checked in relation to the moderate El Ninos that started in 1986/87, 1991, 2002 and 2009. I based the choice of these additional events on the NOAA ONI history here.
The results are not statistically evaluated it appears that a significant reduction of the Arctic Summer minimum does not always occur the year after the start of a significant El Nino.
However, there appears to be a significant reduction of the Summer minimum about three years after the start of every significant El Nino. Reduced extents appear in:
- 1984/85
- 1990/91
- 1993 and then in 1995 (note a less significant El Nino started in 1994)
- 1999 (note an intense long La Nina followed the 1997/98 El Nino)
- 2005 (note that 2002 was also a low Arctic Summer minimum)
- 2007/08 (note a less significant El Nino started in 2004)
- 2012
That would suggest an Arctic Summer minimum that is lower than 2012 could be expected in 2017 or 2018.
-
BC at 12:04 PM on 1 July 2015A Southern Hemisphere Booster of Super El Niño
I'll start paying more attention to our nightly weather news item. I recall there's been a high over southern Aus recently and these BOM sites show it was so for the last 7 days and is forecast to continue for the next 4 -
Last 7 days (the plot can be animated) www.bom.gov.au/australia/charts/synoptic_col.shtml
Next 4 days - www.bom.gov.au/australia/charts/4day_col.shtml
It'll be interesting to see in the next weeks/months if this high pattern changes much
-
Daniel Bailey at 09:47 AM on 1 July 2015Temp record is unreliable
I have rebutted arationofreason's sloganeering on the UHI effect, here.
-
Daniel Bailey at 09:46 AM on 1 July 2015It's Urban Heat Island effect
A response to arationofreason, who posted this question:
Inconveniently, the Koch Industries-funded BEST team has debunked this tired, trite meme. While urban areas are undoubtedly warmer than surrounding rural areas, this has had little to no impact on warming trends.
And
And
You are welcome to try again, but with actual evidence in lieu of your preferred empty assertions.
Adieu.
-
Tom Curtis at 09:26 AM on 1 July 2015Temp record is unreliable
a[very small]rationofreason's two most recent posts fit exactly to the definition of sloganeering, and so are in direct violation of the comment's policy. I quote:
"Comments consisting of simple assertion of a myth already debunked by one of the main articles, and which contain no relevant counter argument or evidence from the peer reviewed literature constitutes trolling rather than genuine discussion. As such they will be deleted."
(My emphasis)
Not only that, by avoiding the giving of evidence; his or her comments rather contradict his or hers self flattering nom de net. As such, even my ammendation, while reducing the accuracy of the appelation, is still flatering to them, based on observed behaviour.
Moderator Response:[PS] Agreed. Further sloganeering will be deleted. However, please also note the comment policy prohibition on inflammatory remarks.
-
arationofreason at 08:31 AM on 1 July 2015Temp record is unreliable
An increase in temperature over the last 70 years may be due to urbanizaton around the increasingly urban sites.
Moderator Response:[TD] A more appropriate thread for that particular narrow topic is the Urban Heat Island. Note there are both Basic and Intermediate tabbed panes.
[PS] Please take the time to look at the "arguments" button, and then perhaps under taxonomy for such well-worn myths. Repeating such tired slogans without any data or published literature in support of your argument is simply sloganeering and will be summarily deleted.
-
arationofreason at 08:29 AM on 1 July 2015Temp record is unreliable
No one doubts that we have been recovering fro the LIA for the last 160 years without the help of CO2 for at least the first 100.
Moderator Response:[TD] You are mistaken. Please read the post What Ended the Little Ice Age?--the Basic, then Intermediate, then Advanced tabbed panes. If you have further comments after reading those, comment on that thread, not this one.
-
John Hartz at 04:15 AM on 1 July 2015A Southern Hemisphere Booster of Super El Niño
Posted today...
Twin tropical cyclones will aid El Niño
The counterclockwise flow around Tropical Depression Chan-hom in combination with the clockwise flow around Tropical Cyclone Twenty-five is generating a Westerly Wind Burst (WWB) near the equator, just west of the Date Line. The winds of this WWB are predicted to march eastwards towards South America during the coming weeks, pushing more warm water eastwards that will reinforce the on-going moderate-strength El Niño event. This El Niño event is already at the borderline of being categorized as "strong", and this new WWB could well push it past that threshold. This should make for an unusually active Eastern Pacific hurricane season, by bringing warmer waters and lower wind shear (next chance for a named storm there: in about ten days' time, when the MJO pushes eastwards into the Eastern Pacific.) Conversely, El Niño should bring a much less active than usual Atlantic hurricane season, thanks to the high levels of wind shear that typically occur there during an El Niño.
Tropical Atlantic Quiet; Pacific Getting Active by Dr Jeff Master, Weather Underground, June 30, 2015
-
bjchip at 03:50 AM on 1 July 2015A Southern Hemisphere Booster of Super El Niño
Given our position in the flow it may perhaps be notable that New Zealand has had 4 major storm/flooding events in Auckland, Wellington, Dunedin and Whangarei.... in one month. Not normal.
Doesn't prove anything but the weather here is now quite nice, except when we get a weather bomb. Also getting South Island colder than usual. Looking at those wind vectors that would make sense too. Proof of nothing, but suggestive.
-
mitch at 01:16 AM on 1 July 2015A Southern Hemisphere Booster of Super El Niño
Keep the ENSO reports coming please--I am fascinated. Having been out at the end of the 82-83 ENSO, I find it interesting about the surface easterlies in the southern hemisphere. We had 20-30 knot 'trade winds' in our face at 20S when we were heading east of Tahiti. We were very puzzled at the time.
-
Tom Curtis at 18:56 PM on 30 June 2015CO2 has a short residence time
Zadams @149, I assume you are asking how do we know that atmospheric CO2 was not increasing by 3.3 Gigatonnes of Carbon per annum (1.56 ppmv) prior to the industrial revolution?
Well, to start with, the increase in CO2 concentration observed at Hawaii shows an accelerating trend:
Decade Total Increases Average Annual Rates of Increase
2005 – 2014 21.06 ppm 2.11 ppm per year (4.47 GtC per year)
1995 – 2004 18.67 ppm 1.87 ppm per year (3.96 GtC per year)
1985 – 1994 14.24 ppm 1.42 ppm per year (3.01 GtC per year)
1975 – 1984 14.40 ppm 1.44 ppm per year (3.05 GtC per year)
1965 – 1974 10.56 ppm 1.06 ppm per year (2.25 GtC per year)
1960 – 1964 3.65 ppm 0.73 ppm per year (5 years only) (1.55 GtC per year)Second, CO2 data from icecores, and C13 data from icecores, speliothems, corals, and mollusc shells show CO2 levels to have been near constant prior to 1750 going as far back as the end of the last glacial. I discuss these in a post here that canvasses the wide range of evidence showing the recent increase in CO2 to have been anthropogenic (see in particular points 1, 5 and 10).
However, the most fundamental reason is arithmetic. The atmosphere currently has about 400 ppmv of CO2 (848 GtC). If atmospheric CO2 had been increasing continuously by 3.3 GtC per annum into the past, just 257 years ago, the atmosphere would have had no CO2 (at which point there could be no photosynthesis, and hence no plants on which we live). Even an increase of as little as 0.09 GtC per year would mean that at the start of the phanerozoic, at the time humans were inventing agriculture, there would have been no CO2 and hence no possibility of our wheat, rye, rice or maize growing. So, even if we had no CO2 records going back into the past, we would know that the current rate of increase is much greater than fifty times the long term average rate of increase leading into the industrial revolution.
So, if we want to believe that the increase in CO2 is natural in origin, we need to believe that just as the industrial revolution kicked of, the long term natural rate of net emissions suddenlty increased by a factor of 10 or more, and then continued to increase over the following 250 years in almost perfect sync with know human emissions until they rose to their current level of well over fifty times the previous long term rate of increase. Further, at the same time we have to believe their is an independent natural sink that did not previously operated that increased at the same rate as human emissions to nullify them, and which is triggered by those emissions so that it should not be included in the net natural emissions, is also incapable of stabilizing net natural emissions (which on this scenario are anything but stable). Put simply, that is not an elegant hypothesis.
Finally, FYI, from icecore data we know that the long term increase in CO2 over the holocene up to the industrial revolution was actually about 0.004 GtC per annum; and there is good reason to think that most of that was driven by deforestation driven by the expansion of agriculture (ie, that it was anthropogenic).
-
wili at 18:48 PM on 30 June 20152015 SkS Weekly News Roundup #26B
Yes, thanks to all for a very informative discussion.
-
Zadams at 14:02 PM on 30 June 2015CO2 has a short residence time
Hi, the question I have is how do we know that global CO2 emissions weren't increasing at a rate of 3.3x back before the industrial revolution? (Sorry forgot the units). If so, how did the process of figuring that out work?
Thank you.
Moderator Response:[Rob P] - There are multiple lines of evidence, but the simplest to understand is that tiny bubbles of air are trapped in snow on the giant ice sheets of Antarctica and Greenland. As this snow is slowly compacted to form ice, the air trapped inside is sealed off from the atmosphere. The ice that has survived for hundreds of thousands of years is therefore a continuous record of the Earth's atmosphere. Core samples are obtained by drilling down into the ice with specialized drilling rigs, and the ice core is later painstakingly analyzed to determine atmospheric CO2 concentration.
Consider the last 10,000 years for instance.......

Tom Curtis' Climate Change Cluedo is also a worthwhile read if you want to learn more.
-
michael sweet at 11:11 AM on 30 June 2015Renewables can't provide baseload power
Kevin McKinney in a comment at Real Climate cited Jacobson et al 2015. This paper presents a plan to convert 100% of all energy used in the USA to Renewable Energy (not all electricity, all energy). From the abstract:
"This study presents roadmaps for each of the 50 United States to convert their all-purpose energy systems (for electricity, transportation, heating/cooling, and industry) to ones powered entirely by wind, water, and sunlight (WWS). The plans contemplate 80–85% of existing energy replaced by 2030 and 100% replaced by 2050. ...Year 2050 end-use U.S. all-purpose load would be met with 30.9% onshore wind, 19.1% offshore wind, 30.7% utility-scale photovoltaics (PV), 7.2% rooftop PV, 7.3% concentrated solar power (CSP) with storage, 1.25% geothermal power, 0.37% wave power, 0.14% tidal power, and 3.01% hydroelectric power. Based on a parallel grid integration study, an additional 4.4% and 7.2% of power beyond that needed for annual loads would be supplied by CSP with storage and solar thermal for heat, respectively, for peaking and grid stability. Over all 50 states, converting would provide 3.9 million 40-year construction jobs and 2.0 million 40-year operation jobs for the energy facilities alone, the sum of which would outweigh the 3.9 million jobs lost in the conventional energy sector. Converting would also eliminate 62 000 (19 000–115000) U.S. air pollution premature mortalities per year today and 46 000 (12000–104 000) in 2050, avoiding $600 ($85–$2400) bil. per year (2013 dollars) in 2050, equivalent to 3.6 (0.5–14.3) percent of the 2014 U.S. gross domestic product. Converting would further eliminate $3.3 (1.9–7.1) tril. per year in 2050 global warming costs to the world due to U.S. emissions. These plans will result in each person in the U.S. in 2050 saving $260 (190–320) per year in energy costs ($2013 dollars) and U.S. health and global climate costs per person decreasing by $1500 (210–6000) per year and $8300 (4700–17 600) per year, respectively. The new footprint over land required will be 0.42% of U.S. land. The spacing area between wind turbines, which can be used for multiple purposes, will be 1.6% of U.S. land. Thus, 100% conversions are technically and economically feasible with little downside. These roadmaps may therefore reduce social and political barriers to implementing clean-energy policies."
It appears to me that scientists researching future energy supplies have moved way beyond the question of "Can RE supply baseload energy?" and are now planning how to power the entire civilization. Their conclusion is that current technology is capable of powering all of civilization.
Their paper describes all states generating enough power to power that state. Then interconnects betweeen states balance generation and demand (for example Florida has a lot of solar but no wind for night time generation). If the system was optimized it would cost less (for example having Texas generate excess power using their large wind resource and exporting power to Florida all day long). They consider all costs including building out the infrastructure and transmission lines.
Moderator Response:[JH] Formatting glitch fixed.
-
PhilippeChantreau at 11:04 AM on 30 June 20152015 SkS Weekly News Roundup #26B
Thanks, that's plenty to chew...
-
Daniel Bailey at 08:57 AM on 30 June 20152015 SkS Weekly News Roundup #26B
7.2.7.1 Contrails and Contrail-Induced Cirrus
"Estimates of the RF from persistent (linear) contrails often correspond to different years and need to be corrected for the continuous increase in air traffic. More recent estimates tend to indicate somewhat smaller RF than assessed in the AR4...we assess the combined contrail and contrail-induced cirrus ERF for the year 2011 to be +0.05 (+0.02 to +0.15) W m–2 to take into uncertainties on spreading rate, optical depth, ice particle shape and radiative transfer and the ongoing increase in air traffic."
8.3.4.5 Contrails and Contrail-Induced Cirrus
"AR4 assessed the RF of contrails (persistent linear contrails) as +0.01 (–0.007 to +0.02) W m–2 and provided no estimate for contrail induced cirrus. In AR5, Chapter 7 gives a best estimate of RF due to contrails of +0.01 (+0.005 to +0.03) W m–2 and an ERF estimate of the combined contrails and contrail-induced cirrus of +0.05 (+0.02 to +0.15) W m–2. Since AR4, the evidence for contrail-induced cirrus has increased because of observational studies (for further details see Section 7.2.7)."
-
Kiwiiano at 06:01 AM on 30 June 20152015 SkS Weekly News Roundup #26B
Apropos the NZers et al who are sceptical....
"It is difficult to get a man to understand something when his comfortable lifestyle depends on not understanding it."
-
John Hartz at 04:37 AM on 30 June 2015Irreversible loss of world's ice cover should spur leaders into action, say scientists
Suggested suplemental reading:
Melting Arctic sea ice could be disrupting the oceans’ circulation—with major consequences by Chelsea Harvey, Energy & Environment, Washington Post, June 29, 2015
-
knaugle at 03:34 AM on 30 June 2015Irreversible loss of world's ice cover should spur leaders into action, say scientists
There is an interesting page, Paul Ward's "Cool Antarctica" that makes an interesting read related to this:
http://www.coolantarctica.com/Antarctica%20fact%20file/science/global_warming.php
Under the discussion of the West Antarctic Ice Sheet [and its apparent slow collapse] is the statement:
"The end result of this is the possibility that we have already been committed to a rise in global sea levels by 3m or more over the coming centuries."
Moderator Response:[JH] Link activated.
-
Rob Honeycutt at 02:44 AM on 30 June 20152015 SkS Weekly News Roundup #26B
Philippe... Here's some information from IPCC AR4 about aviation where they break it down into relative radiative forcing. The figures seem to agree with what I said above with 2015 projections for aviation having a contribution of about 5% of total anthropogenic radiative forcing.
Some folks will try to slip in the 2-3% CO2 emissions figure to make it seems smaller, but the net total effect is in the range of 5% or so.
-
PhilippeChantreau at 02:22 AM on 30 June 20152015 SkS Weekly News Roundup #26B
Rob, can you elaborate or point me to a source for aircraft emissions having an effect double their value? Are you talking about CO2 or the ensemble of CO2 and particulates? Does that include the effect of contrails? I would have thought that CO2 emitted closer to the surface, where the IR emitted, would have had more effect.
-
FrankTrades at 02:22 AM on 30 June 2015Irreversible loss of world's ice cover should spur leaders into action, say scientists
Assuming the obvious, that global warming will cause direct melting of polar ice caps, let's look at the RATE of sea level increase since the mid-1800s. Google the data with this search: Battery NOAA Sea Level. That give a long-tern look at data. The chart will show a strict linear trend of increase, not the least bit influenced by the world population increase from 1 billion to 7 billion since the beginning of that data measurement. Given that burning of hydrocarbons MUST have increased at least an order of magnitude in that time, the data completely mitigate against any conclusion that there has been influence of man on sea level rise and thus global warming.
Moderator Response:[TD] Your comment is off topic for this thread. Please place further comments on this topic on the thread "How Much Is Sea Level Rising?" Please actually read that post before you comment, instead of making a comment that clearly is refuted in the post. For example, in that post note the greater than linear increase in sea level when measured away from plate boundaries and areas of isostatic rebound, and when measured globally instead of at one location. (Shocking to some is the fact that Manhattan is not the entirety of the world.) Also note that your crude speculation about CO2 rise is unnecessary, because it has been measured.
-
Rob Honeycutt at 02:04 AM on 30 June 20152015 SkS Weekly News Roundup #26B
Wili... Currently aviation accounts for about 2-3% of global CO2 emissions, but their effect is about double that because the emissions are primarily released at altitude. Aviation is still a growing industry, but they're also not a denial-driven industry like the FF industry. The entire aviation industry is actively working on more efficient aircraft, alternative fuels, as well as alternative propultion systems. And as anyone who flies can attest (with much grumbling), they're clearly trying to get as many human bodies into the smallest possible aircraft as possible. :-)
Surface transportation will continue to be the bigger nut to crack since it accounts for 30% of CO2 emissions.
-
wili at 01:06 AM on 30 June 20152015 SkS Weekly News Roundup #26B
The eco-village piece points out that the good people at Findhorn fail to meet sustainable footprint levels mostly because they faly at levels normal for Westerners. I too have noticed that reducing or eliminating flying on quizzes like that at myfootprint.org dramatically reduces one's footprint.
It would be great to see more info on the contributions of flying toward climate change. Is there something about where the emissions are injected into the atmosphere (mostly much higher than most other sources) that changes the profile. Or is it just the large amount of energy and so fuel it takes to accelerate a large metal object to about 600mph away from earth's gravitational center?
I don't really mean to further burden the mods on this, but if other commenters have any insights or links on this, I would appreciate it.
-
Glenn Tamblyn at 23:34 PM on 29 June 2015It's the sun
As a first approximation, that you would get a nice peak in the sunspot power series at the solar cycle frequency is a bit of a no-brainer - like duh man!
Expecting that the temperature data would show a similar correlation is based on assuming a raft of physical realtionships that ae actually unphysical. Starting with the fact that most energy exchange in the climate system is into and out of the oceans which have huge thermal mass and massively damp down any frequency responses to something like solar variations.
So not what are you missing. What are you expecting and are your expectations reasonable; thermodynamically reasonable? -
bozzza at 16:18 PM on 29 June 20152015 SkS Weekly Digest #25
@3, while you have a point about birth control you are also saying he has no right to talk about climate change as a market failure.
One of the biggest themes of the bible was market failure due to human failure and you are trying to make people forget that point.
-
ancient_nerd at 16:17 PM on 29 June 2015It's the sun
I tried a fourier analysis of the solar incidence and temperature data. The idea was that there would be big peaks in the spectra at the frequency of the sunspot cycle. I used a 121 year period where the SATIRE-T2 and NOAA anomaly sets overlap. A nice big peak showed up at just the right spot with the Solar Data. However, with the temperature data, the spectral components were almost missing entirely. They were actually low points in the noise floor.
Any idea what I could be missing?
-
Rob Honeycutt at 12:12 PM on 29 June 20152015 SkS Weekly Digest #25
Paraquat... This is a lot more than just "nice." As John said, it's potentially game changing. He couching this as a global moral issue, which it is. And not only that, he's primarly speaking to many millions of people whom have previously been uninvolved, or at least dispassionate about, climate change.
The Pope knows his audience. I'm excited he's taking on climate change and will happily allow him to tend his flock as he sees best.
-
John Hartz at 11:58 AM on 29 June 20152015 SkS Weekly Digest #25
Paraquat: Pope Francis is using his moral authority to convince world leaders to commit to taking meaningful action on mitigating manmade climate change when they meet in Paris in December. This is a significant and potentially a "game-changing" initiative.
-
Paraquat at 09:43 AM on 29 June 20152015 SkS Weekly Digest #25
This sudden lovefest with the Pope has me scratching my head. Yes, it's nice that he agrees that AGW is real - that's better than denial. But if the Pope wants some real action to solve the problem instead of just spouting some nice words, he can use his power as the head of the Catholic church to lift the Papal ban on birth control. Doing so would instantly improve the lives of millions of Catholics and is as much a human rights issue as it is an environmental issue.
-
Stephen Baines at 09:01 AM on 29 June 2015It's not us
That is an excellent graphic! Have to remember that for class. Thanks Tom D.
-
Tom Dayton at 08:36 AM on 29 June 2015It's not us
Excellent dynamic graphic at Bloomberg, showing natural versus anthropogenic forcings.
-
John Hartz at 05:52 AM on 29 June 2015Renewables can't provide baseload power
Moderation Comment:
We are investigating whether or not Superposition and Henchman21 are sockpuppets. Until we complete our investion, please do not repond to any posts made by either Superposition and Henchman21.
Moderator Response:[DB] Henchman21 is confirmed as a sock puppet of SuperPosition. Both user id's have had their posting rights rescinded.
-
Petr Glad at 05:20 AM on 29 June 20152015 SkS Weekly News Roundup #26B
destruction (treating) flue gas emissions and the Future power engineering
http://www.etenergycorp.com/
Global warming, power generation, and pollution
https://sites.google.com/site/environmentalfrompg1/home/apvrvv
Site "scisyhp-physics - PG-1"
https://sites.google.com/site/scisyhpphysicspg1/Moderator Response:[JH] Your post is too cryptic to ascertain why you have posted the links to three separate websites. Please explain the points you want to make in a new post. Thank you.
-
MA Rodger at 02:57 AM on 29 June 2015Renewables can't provide baseload power
Henchman21 @185.
Why do you say the quote(s) do(es)n't "say that variable RE can supply a baseload"? Is the 'RE' being mentioned not variable enough for you? Or is there some part of 'baseload' that you consider isn't supplied by providing "100% renewable elecrticity"? Do explain.
Moderator Response:[JH] We have noted the similarity between Henchm21's postings and those of Superpoition. If there is only one person behind these two user names, the penalty of banishment will be imposed per the SkS Comments Policy. We have zero tolerence for sock puppetry.
Prev 559 560 561 562 563 564 565 566 567 568 569 570 571 572 573 574 Next


