


 Arguments


Recent Comments
Prev 561 562 563 564 565 566 567 568 569 570 571 572 573 574 575 576 Next
Comments 28401 to 28450:
-
Infopath at 05:28 AM on 3 November 2015Antarctica is gaining ice
@ 431 & 432 (barry & peter),
Re: phys.org/news/2015-10-mass-gains-antarctic-ice-sheet.html#jCp
I read it a bit differently:
Although the article states:
A new NASA study says that an increase in Antarctic snow accumulation that began 10,000 years ago is currently adding enough ice to the continent to outweigh the increased losses from its thinning glaciers.This should be put into context, as Zwally also says that within a couple of decades (should the current loss rate remain) the losses will catch up to the gainings: "If the losses of the Antarctic Peninsula and parts of West Antarctica continue to increase at the same rate they've been increasing for the last two decades, the losses will catch up with the long-term gain in East Antarctica in 20 or 30 years—I don't think there will be enough snowfall increase to offset these losses."
Am I correct to assume (if this study is correct), that net ice gain would only occur if we reduce the curret rate of ice loss?
-
Kevin C at 02:41 AM on 3 November 2015Homogenization of Temperature Data: An Assessment
Thanks Victor. I've been trying to test some of those possibilities for the trend recovery.
I tried homogenizing the 'world 1' data using the known breaks to construct the fragment library, using either the confounded or unconfounded breaks. The confounded breaks lead to underrecovery of the trend.
I then constructed my own source data using the same breaks, so that I could be sure that the breaks were exactly correct. Same problem. So, unless I've made a mistake the issue isn't down to errors in the breaks or missed small breaks.
I hadn't thought about the trend uncertainty, but the weather noise in the station trends is large compared to the errors in the homogenization, so that doesn't look like it. And with my new iterative unconfounding step I do recover the full trend for the benchmark data.
It's a really interesting problem. If it's not a bug there may be some nice science hiding in there.
-
VictorVenema at 02:20 AM on 3 November 2015Homogenization of Temperature Data: An Assessment
However the simple homogenization method presented in the report underestimates the impact on global temperatures, both in synthetic benchmark data for which we know the right answer (Figure 2), and in the real world data. Why is this?
One of the ways of understanding this is seeing the computation of the corrections as a regression method. Any error you make, breaks you could not detect because they are too small, spurious breaks you set, errors in the date of the break, will reduce the explained variance of the computed corrections.
There is also a noise errors in the trends you compute, but the explained variance smaller than 100% means that on average you always underestimate the size of the corrections. A colleague of mine has just submitted a proposal to develop a bias correction method and compute the trend uncertainty after this bias correction.
The sea surface temperature is corrected based on measurements and models of the measurement process. There is thus no reason to expect these corrections to be biased. They could still be wrong, naturally, especially because there may have been changes in the monitoring of sea surface temperature that have not been considered, but there is no reason to expect improvement in insight to change this trend in any specific direction.
Combining this, it is more likely than not that we underestimate the magnitude of global warming. This would fit to many other changes in the climate system that go faster than expected (Arctic sea ice, AMOC, snow cover, lake and river temperatures, sea level rise, climate sensitivity from observations compared to other methods, precipitation trends, etc.).
-
knaugle at 02:18 AM on 3 November 2015Satellites show no warming in the troposphere
I find it interesting that Dr. Roy Spencer gets a lot of (mostly deserved) criticism here for his interpretation of temperature data, and all the corrections to the UAH temperature data. Yet what really puzzles me is that when I visited Dr. Cowtan's Temperature trends site
http://www.ysbl.york.ac.uk/~cowtan/applets/trend/trend.html
ALL the global, land/ocean, satellite data sets show about +1.4°C ± 0.2°C/decade warming for the past 20 years, EXCEPT for RSS, which is only +0.04°C per decade in that time frame. Similarly, at 30 years, the average warming is about 0.175°C/decade and RSS remains noticably lower than the other sets. So it seems all the agjustments to UAH have brought it more in agreement with the surface data, but it does beg the question what's with RSS?
Moderator Response:[PS] Fixed link
-
MA Rodger at 01:35 AM on 3 November 2015Antarctica is gaining ice
barry @431 & peter @432.
Be mindful that this is not the first time in which Zwally has proclaimed the ERS & ICESat data as showing a net rise in Antarctic ice. A workshop paper in 2012 (abstact & video with gap in coverage - here) also resulted in calls here at SkS for revision to this post (along with more forceful demands elsewhere by the likes of the Lord Protector of Wattsupia).
This time round, the journal article is so hot-off-the-press it has yet to appear on-line so it's a little early to be getting all excited. Until the new finding is appraised, best we make do with Hanna et al (2013) which is a paper co-authered by Zwally. It broadly discusses work in-hand plus future developments before concluding:-
"However, it is unlikely that these refinements will change the consensus picture emerging: while Antarctica as a whole is losing mass slowly (assessed to be contributing 0.2 mm yr-1 sea-level equivalent by IMBIE2), Greenland, the Antarctic Peninsula, and parts of West Antarctica are together losing mass at a moderate (~ 1 mm yr -1 sea-level equivalent) rate today (~70% of this mass loss is from Greenland) and rates for each are becoming increasingly negative." (my bold)
Figure 1 from Hanna et al (2013) demonstrates this 'emergence'.
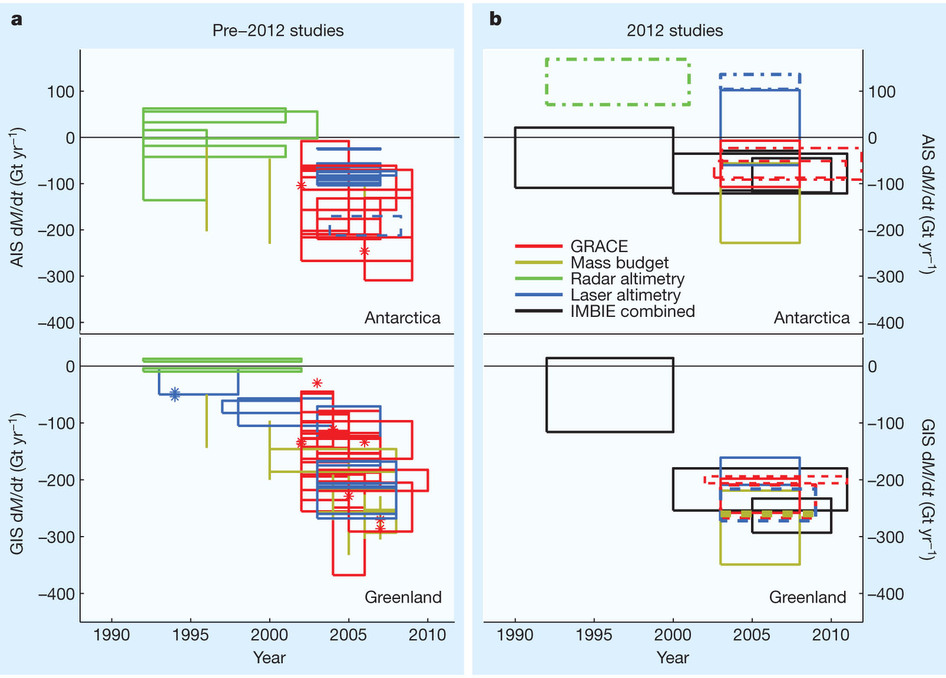
Figure 1 caption. Summary of Antarctic and Greenland mass-rate estimates. In the studies published before 20122 (left) and in 2012 (right) each estimate of a temporally-averaged rate of mass change is represented by a box whose width indicates the time period studied, and whose height indicates the error estimate. Single-epoch (snapshot) estimates of mass balance are represented by vertical error bars when error estimates are available, and are otherwise represented by asterisks. 2012 studies comprise IMBIE combined estimates2 (solid lines), and estimates by Sasgen and others16,20 and King and others11 (dashed lines), Zwally and others19 (dot-dashed lines), Harig and Simons89 and Ewert and others90 (dotted lines).
Note that it is not just a need to reconcile this most recent Zwally paper with the other methods employed to assess East Antarctic ice balance. Both the linked pages @431&432 quote Zwally pointing out that these ERS & ICESat data have to be also reconciled with SLR data.
And my answer to peter's question "Would this Zwally paper make the myth true?" that answer would be - "No". ERS & ICESat data continue to provide some evidential support for the 'Antarctica not losing ice' position which remains strongly a myth when presented as unequivocal fact, and doubly so when the mythical Antarctica ice balance is then presented as some natural global thermometer. Indeed, does it even work as a thermometer for Antarctica?
-
Rob Honeycutt at 00:31 AM on 3 November 2015Sea level rise is decelerating
Kerry... You're doing a classic "missing denominator" calculation. You've estimated out that the number of ships displacing sea water is a very large number. That's your numerator. Your denominator is the total tonnage of all the earth's oceans, and that would make the result an extremely small number.
-
Tom Curtis at 21:58 PM on 2 November 2015Sea level rise is decelerating
Kerry Randell @42, taking your figures on total tonnage, and assuming the average container loss rate extends back to 1945, and that the average ship tonnage loss is 250 with the average loss also extending back to 1945, that yields a total 31,054,617 tonnes lost as a rough estimate. Given that the density of sea water is 1.025 Tonnes per meter cubed, that leads to an estimated displacement of 30,297,187 m^3 of displacement. Averaged over the ocean surface of 361, 132,000 km^2 of surface area, that leads to an estimated 0.000084 milimeter rise in sea level based on your assumptions, for the entirety of lost shipping in the 20th century.
However, that is likely a significant overestimate. The mass of water displaced only equals the mass of the object if the object is floating. If it sinks, the water displaced equals the volume of the immersed object, which is necessarilly less than the volume of water equal to the tonnage of the immersed object, for if it were not, the object would float rather than sink. Ergo, your initial assumption is completely wrong headed. The mass of water displaced by various vessels sunk at sea is far less than the displacement of the vessels.
-
peter12809 at 18:00 PM on 2 November 2015Antarctica is gaining ice
"A new NASA study says that an increase in Antarctic snow accumulation that began 10,000 years ago is currently adding enough ice to the continent to outweigh the increased losses from its thinning glaciers.
The research challenges the conclusions of other studies, including the Intergovernmental Panel on Climate Change’s (IPCC) 2013 report, which says that Antarctica is overall losing land ice."
http://www.nasa.gov/feature/goddard/nasa-study-mass-gains-of-antarctic-ice-sheet-greater-than-losses
Does this make the myth true?
Moderator Response:[JH] Link activated.
-
Kerry Randell at 17:26 PM on 2 November 2015Sea level rise is decelerating
The rising Oceans,Global warming or not.
Simple experiment:
Fill a bucket to the top with water, then add a brick.
What happens the water overflows the weight of the lost water equals the weight of the brick, it's called displacement.
Add some thing to a body of water what happens?
Throw a brick in the ocean, no noticeable difference.
But throw billions of tons of bricks in and float thousands of ships and boats of all sizes on then we have Oceans rising,
melting ice:
add a large block of ice in your bucket then fill the bucket to the top, the ice floats above & below the water, as the ice melts will the water overflow? Remembering displacement,
Check out below for some reasons for the rising of the oceans.
Listed below is just a small amount of the reasons.Apparently in WW1 a total of 375 U boats sank 6596 merchant ships, a total of 12,800,000 tons.
The Japanese lost 1,178 Merchant Ships sunk for a tonnage total of 5,053,491 tons. The Naval losses were 214 ships and submarines totaling 577,626 tons. A staggering five million, six hundred thirty one thousand, one hundred seventeen tons,
(5,631,117 tons), 1,392 shipsIt's estimated that 10,000 of these large containers are lost at sea each year, Average tonnage 18 tons
180,000 tons per annumAccording to an annual analysis from insurer Allianz, 94 ships on average(over 100 gross tonnes) each were completely lost in 2013. There are many reasons for a complete loss. “Foundering” (which means sinking or submerging) caused the vast majority of the big losses
Over 30,000 large Ships over 500 tons launched since 1975 not to mention the 100 of thousands sail boats small yatch's ferries etc
Now lets add the land Pushed into the ocean to build Airstrips, Islands & Erosion.
Where doe's the water go, It just disappears, yeah right. “IT RISES”
-
NEWTONS LAW:
For every action, there is an equal (in size) and opposite (in direction) reaction -
longjohn119 at 15:10 PM on 2 November 20152015: A Very Bad Year for the Global Warming Policy Foundation
Here's something to think about .....
It was the downside year of the '97-'98 el Nino that set the record not the year leading into it. Having the record warmest year 2 years in a row is already unprecedented but there is a very good chance 2016 could be the third year in a row or at the least a Top 3 year in the 2014-2016 cluster
I predict that in 10 years these same Deniers will be going "Global Warming ended in 2015 so there is nothing to worry about"
-
tatelyle at 04:42 AM on 2 November 2015Catching up with the Younger Dryas: do mass-extinctions always need impacts?
What created the many elliptical Carolina Bay landform depressions?
And what caused the Younger Dryas cooling period 12,900 years ago?Could these two seemingly disparate topics be linked in any way? Ralph Ellis takes a look at current research on both of these subjects, and discovers that they are likely to be linked to a large meteoric impact in the Great Lakes region some 12,900 years ago. It was the ejecta from this impact that created the Carolina Bays, and it was the same ejecta that blanketed the Earth and caused the Younger Dryas cooling period.
Moderator Response:[RH] Shortened link.
-
barry1487 at 20:37 PM on 1 November 2015Antarctica is gaining ice
Recent study shows mass balance increasing.
http://phys.org/news/2015-10-mass-gains-antarctic-ice-sheet.html#jCp
Worth mentioning in the OP as an update? Or wait for the study to become available?Moderator Response:[JH] Link activated.
Like many of the SkS Rebuttal articles, the OP is in need of update. The all-volunteer SkS author team has embarked on an intitiative to update the Rebuttals.
-
Eclectic at 19:09 PM on 1 November 2015There is no consensus
KiAnCa @ #714 : You have my sympathies, for your desire to gain good quality scientific information about the amount of global warming going, and how severely the problem is building. As you have doubtless already noticed, the mainstream media generally does a poor job in supplying realistic information ~ and it gives an inordinate amount of space to anti-science propagandists (with lawyer-type rhetoric designed to make you think black is white, or that there are so many "doubtful" shades inbetween, such that there is nothing meaningful in this whole universe).
You will find a vast amount of science-based info on this website . . . but you have my sympathy, because that info is not presented as a giant-size single meal where you simply chew your way through from one end of the pie to the other end.
Best (a) if you go to the Home page, central top region, and click on the small box titled "The Big Picture" . . . and then follow to areas that interest you,
or (b) on the Home page, click on the nearby box titled "Newcomers, start here" . . . and look down to the second heading, titled "Good starting point for newbies" where [second line of the paragraph] you can click on "Warming Indicators" and from that go to "Evidence for Global Warming (intermediate)" . . . where you can follow your interests. I must point out that this particular section generally holds info up to about 2010 ~ and so doesn't directly mention all the additional weight of scientific info in the last five years [i.e. all the newer "hot year" global records and even faster Ice Melt and sea-level rise]. No great matter, since the "sufficient evidence" was already overwhelmingly convincing, long before that date [indeed, in a recently publicised scandal, it appears that Exxon already had convincing evidence of the CO2/Warming problem by 1979],
or (c) if your scientific education is already above average, then you can simply skip to the "Arguments" [on Home page] and pursue any of the 170+ "arguments" [arranged by Climate Myth] which interest you, and delve further from there. The Myths are quite entertaining, because the info there does neatly deflate all the rubbish/nonsense talked by the small number of shills & mavericks who oppose the mainstream science (i.e. the mainstream science which results in virtually all the climate scientists being in accord with the consensus of 97% . . . or nowadays more likely 99% )
Good hunting ~ and please use the appropriate thread's Comments Section for any questions that you want clarified.
-
KiAnCa at 17:16 PM on 1 November 2015There is no consensus
I'm looking for the data on climate change. I haven't been able to find it. I don't care how many agree, I want to know what evidence they base their opinion on. I was taught to question, not swallow. Please just post the data on climate, not the politics of popularity. Thank you.
Moderator Response:[DB] Data and codes are openly available, and have been for years:
http://www.realclimate.org/index.php/data-sources/#Climate_data_raw
http://www.realclimate.org/index.php/data-sources/#Climate_data_processed
http://www.realclimate.org/index.php/data-sources/#GCM_code
http://oco.jpl.nasa.gov/science/dataproducts/
http://podaac.jpl.nasa.gov/
http://daac.gsfc.nasa.gov/
https://earthdata.nasa.gov/about/daacs
https://www.wmo.int/pages/themes/climate/climate_models.php
Note that the Muir Russell Commission was able to do a full global reconstruction from the raw data linked to from the above page, WITHOUT ANY CODE, in a mere 2 days (when asked, they replied "any competent researcher could have done the same).
The Auditors over at McIntyre's Climate Audit have been struggling with their "audit" reconstruction for many years now. -
denisaf at 16:12 PM on 1 November 20152015 SkS Weekly Digest #43
I am intrigued at this discussion of limiting global warming as it is contrary to the understanding of this physical scientist of what has happened and what will happen in the future. Fossil fuel emissions have been the major contribution to the carbon dioxide level in the atmosphere rising to 400 mpm with an associated absorption in the oceans. This has created, in Hansen's terms, a blanket around the Earth which has caused the atmospheric warming by reducing the radiation out into space. This warming process will continue even if the rate of emissions is greatly reduced. Absorption of carbon dioxide will also tend to reduce the blanket effect, so the rate of increase in atmospheric warming but it will still increase. It is an irreversible process in a time scale relevant to industrial civilization. in addition, while it is not receiving the attention that is warranted, ocean acidification and warming is also an irreversible process that is under way.
-
A Rough Guide to the Jet Stream: what it is, how it works and how it is responding to enhanced Arctic warming
Chuck Wiese - Francis and Vavrus are under exactly zero responsibility to indulge the complaints of someone who hasn't done the work, who isn't willing to write a Comment or a dissenting peer-reviewed article.
You have been disagreeing with recent research with (unclear) references to textbooks from the 1950's - has it not occurred to you that our knowledge of various phenomena may have improved in the interim? Or that recent papers are discussing recent developments, developments that may not have been covered back when you received your training? I might as well argue that plate tectonics is absurd, based on a textbook from the 1920's.
If you indeed think that Francis and Vavrus (not to mention the many authors of recent papers discussing these works without rejecting them) are completely and in an elementary fashion wrong, do the work. Otherwise, regardless of the accuracy of your assertions, you will be considered a crank whose views lack support.
On a related note - the opening post was written with direct reference to peer-reviewed literature, which is all the support required; it's supported by that work. Your repeated claims that you, because of your background and training, know better consist of an Argument from Authority - and without actual data, theory, references, or work pointing out where those papers have erred, that's a logical fallacy.
-
Tom Curtis at 12:54 PM on 1 November 2015A Rough Guide to the Jet Stream: what it is, how it works and how it is responding to enhanced Arctic warming
Chuck Wiese @82, John Mason in fact provides a reference for his claims in the discussion he had with Jennifer Francis, and in the paper you are referred to for further reading (Francis and Vargus, 2012). That is, as the Sun has cooled (very slightly) the Earth has warmed. That might be enough for some, but if any key point of the article were challenged, we would expect Mason to provide appropriate data, explicate the reasoning behind the claim and/or provide a suitable reference if no other commentor was able to do so before hand. That is, we would expect the same standard we apply to you, and that you apply to Jennifer Francis, but fail of in your own behaviour.
In fact, you have challenged a key point, but the reference for that point is already given in the article (ie, Francis and Vargus (2012)) and the relevant section has been quoted by commentors above. You yourself have identified Francis as making the claim, so it is not in dispute that Mason has a suitable reference for his claims. Nor would it be in dispute that you had a suitable reference for yours if you would only quote the relevant passages from the difficult to obtain references you use, something you steadfastly refuse to do.
With regard to the deleted posts, I believe they were deleted due to being off topic, contrary to both the comments policy and the direction from the moderator @73 above, a direction you have chosen to ignore. It is unfortunate that your rejection of the moderators claim @59 above that you "...expressed a rejection of basic greenhouse theory" has been deleted, but that claim was made before the indication of a strict application of the rule requiring that you remain on topic. It is still open to you to rebut the moderator's claims at one of the SkS posts that discuss basic greenhouse physics. No comment of yours was deleted for being off topic prior to that notice. Furrther, the moderator making the claim @59 has not deleted any of your posts, and some miscommunication may have been involved.
By all means, however, become yet another denier who interprets their inability to comply with the simple requirements for posting at SkS as censorship of their views. As the views expressed are not a grounds for moderation - that claim is and has always been false. The failure to comply, however, seems to indicate that deniers are unable to express their views in a clear, evidence based manner while remaining on topic (ie, not wondering of into some form or another of a Gish Gallop). That does not speak well for the coherence, or emperical basis of those denier views.
Moderator Response:[JH] Wiese's most recent post was a moderation complaint and was deleted. He had been advised to review the SkS Comments Policy but apparently chose not to do so.
-
Glenn Tamblyn at 08:18 AM on 1 November 2015It's cooling
ARRS
You don't define what you mean by deep ocean.
If you mean the true Abyssal ocean, below 2000 meters then there has seemingly been little warming.
If you mean the ocean down to 2000 meters there has been warming And it is not an extrapolation of anything. It is a measurement using the ARGO system.
-
Tom Curtis at 07:49 AM on 1 November 2015A Rough Guide to the Jet Stream: what it is, how it works and how it is responding to enhanced Arctic warming
Chuck Wiese @80 sets up a hypocritical standard such that:
"If anyone who had anything to do with this work diasagrees with my assertions, they owe it to the public to explain them and defend. To claim they disagree without an explanation is not acceptable."
But he insists it is not incumbent on him to defend and explain his assertions. Indeed, as he claims his views are based on standard (but out of print, and unavailable second hand) textbooks, it should be very easy for him to defend and explain his views by showing the derivation of the relevant formula, or failing that, quoting the textbooks for their derivation.
Indeed, not even that is being asked of him. We would be content if he simply listed the scientific papers in which the result was first derived (that being far more likely to be accessible than out of print, and unavailable second hand text books). Most recently MA Rodger @77 has reduced the request on his behalf to a mere listing of the formula numbers in the text books that purportedly contain the formula. Even that request is, apparently, to much a demand on Chuck Wiese in defense of his views.
Yet he thinks it is incumbent on atmospheric scientists to devote time to defending their views against any internet crank that has the wit to send them an email.
That is not how science works. Any such communication from a scientist is, and must always be only a courtesy. If it is not, you place a blank check on scientists time such that internet pseudo-scientists can at will permanently prevent them pursuing further research, or even their mandated teaching requirements (if university based). Rather, the way science works is that, if you think there is a problem with a paper, you pursue it through (ideally) peer reviewed responses - the step Chuck Wiese refuses to make.
-
Chuck Wiese at 05:48 AM on 1 November 2015A Rough Guide to the Jet Stream: what it is, how it works and how it is responding to enhanced Arctic warming
Moderator: In response to your most recent post, whether there is a desire by me to publish such a paper is irrelevant. What is relevant is that I have personally written to both of these authors and asked them to explain their claims and demonstrate where I could be wrong. Vavrus never responded and Francis offered no other explanation of why my assertion is incorrect, but only and without any explanation insisted she is correct.
This is not how anyone should be approaching problems in science. Regardless if a paper is reviewed and accepted for publication as this one was, the reviewers may very well not have been versed in atmospheric scienvce as they should be. In addition, the authors have a responsibility to defend their own work and answer questions if they are approached directly as I have approached them. Their failure to do this is surely an indication the isues I raised are valid. That is a reasonable assertion until they can state they addressed my concerns in the review process, they are wrong and give a reference or explanation.
If anyone who had anything to do with this work diasagrees with my assertions, they owe it to the public to explain them and defend. To claim they disagree without an explanation is not acceptable. Ms. Francis is employed by Rutgers University and Vavrus by the Unviersity of Wisconsin and both receive funding from taxpayers.
Chuck Wiese
Meteorologist
Moderator Response:[JH] You are now skating on the thin ice of excessive repetition which is prohibited by the SkS Comments Policy.
Please note that posting comments here at SkS is a privilege, not a right. This privilege can be rescinded if the posting individual treats adherence to the Comments Policy as optional, rather than the mandatory condition of participating in this online forum.
Please take the time to review the policy and ensure future comments are in full compliance with it. Thanks for your understanding and compliance in this matter.
[RH] The way people approach the problems of science is through publishing research. You've thus far been unable to provide supporting research for your claims, and contrary to how people actually approach the problems of science, you've only made claims that you understand this stuff while no one else does. It's quite obvious that you are the one who does not adhere to a scientific approach.
In terms of what is "owed to the public," the only thing that is owed has already been delivered. Dr. Francis has published her work in the peer reviewed literature, as scientists are expected to do. If you have a challenge to the conclusions of her research it is your responsibility to submit those to peer review. Apparently this is something you're unwilling or incapable of doing.
-
Phil at 02:01 AM on 1 November 2015A Rough Guide to the Jet Stream: what it is, how it works and how it is responding to enhanced Arctic warming
Oops, I should have said arctic air would 0.24C warmer within a decade.
It would (simplistically) be 2.4C warmer within a century; I imagine, however, that arctic amplification is closely associated with the loss of ice albedo, and that given that observation and IPCC projection indicate a summer ice free arctic by mid 21st century, the amplification will slow.
BTW, in all of the above "warmer" refers "warmer than today". If you assume that the temperate region (Texas, in my example) warms at the global average then you need to half the difference.
-
Phil at 01:38 AM on 1 November 2015A Rough Guide to the Jet Stream: what it is, how it works and how it is responding to enhanced Arctic warming
Re: @76
The jet stream, as I understand it, acts a barrier that inhibits air currents from crossing it. If the meanders in it increase, then air currents can progress further south (or north) before encountering it. This allows cold air from the arctic to progress further south in the places where the jetstream meanders to the south, and warm air from temperate regions to progress further north where the jetstream meanders to the north. Furthermore since the jetstream acts a barrier to these air masses mixing, the cold air will remain cold since it will not come into contact with warm air.
I do, however take your point that arctic amplification will make arctic temperatures warmer than they were in the past. The trend the atmospheric temperatures over the last 15 years is about +0.12 degC/dec. Let us (for the sake of argument) assume that arctic temperatures are double that rate. However comparing temperatures:
Average March temperature in Nuuk between -7 and -11 C
Average March temperature in Austin Texas between +22 and +10C
would suggest that the fact that the arctic air would be slightly (0.24C) warmer than it would otherwise have been, is dwarfed by the fact that the larger meanders of the jet stream allow the cold (albeit slightly less cold) air penetrate further south.
-
MA Rodger at 22:22 PM on 31 October 2015A Rough Guide to the Jet Stream: what it is, how it works and how it is responding to enhanced Arctic warming
Chuck Weise Meteorologist @75.
Thank you so much for confirming that the equation I presented @73 is not the equation you are talking about. Given the adverse circumstance here, I do struggle to get to grips with this equation and its derivation. In that regard, can you confirm that the your equation is of the form presented @74. And also concerning it's derivation, the references you quoted @35 as your sources of this equation are:-
" "Dynamic Meteorology and Weather Forecasting", authors Godske,Bergeron, Bjerknes and Bundgaard. American Meteorological Society Volume 605, 1957, Chapter 11, Hydrodynamics of the Atmosphere. ... (and) " Dynamical and Physical Meteorology" Haltiner and Martin Chapter 12, Horizontal Frictionless Flow, 1957 ISBN 57-8005."
While you appear reluctant to venture an explanation for the derivation of this equation, likely because "this topic is long, complex and math intensive" in your eyes, such reference books as these do tend to number all the equations they present. So it would be simplicity itself to provide the equation number of this formula within these two chapters. This would be most helpful.
-
denisaf at 20:43 PM on 31 October 2015Interview with Gavin Schmidt
The impact of another issue on feasible policies to tackle climate change needs to be taken into account in discussing what is likely to happen. Every one, including the climatologists, are very dependent on the services provided by the exisitng infrastructure (from the satellites through a range, including being able to fly round the globe, to the computera and instruments). The operation and maintenance of this infrastructure as it ages entails the irreversible useage of a wide range of irreplaceable natural resources. The inevitable decline in these services will have a significant impact on what can be done to cope with climate change. Coping with climate change is a predicament for society. But coping with the loss of services is another one that makes the fromer more difficult.
-
Tom Curtis at 10:35 AM on 31 October 2015It's cooling
A Real Skeptic would note that if you wish to test a theory, you test whether the data falls within the uncertainty range of the prediction. If you did so for the last 18 years to date (Sept 2015) on GISTEMP, you would find a trend of 0.118 +/- 0.104 C/decade, giving an upper bound (0.222 C/decade) that includes the model predictions but a lower bound that excludes the possibility of a zero or negative trend. Ergo the model predictions have not been falsified.
It might be claimed that the HadCRUT4 trend (0.079 +/- 0.105 C/decade) falsifies the model predictions, but a Real Skeptic would realize that:
1) HadCRUT4 is not a global index, as it excludes the Arctic (plus parts of Africa and Asia), so the correct comparison would be with a HadCRUT4 mask of the model predictions (which I do not have available);
2) That cherry picking a year in which annual variations have lifted the temperatures well above the trend variation at the time as the start point (such as 1997 or 1998) distorts the statistics, so that the normal statistical test will generate a excess of false negatives relative to the standard case; and
3) That even apart from such distortions, 5% of "failed" statistical results will be false negatives (of which 2.5% will be false negatives showing to low a trend).
Therefore a Real Skeptic would always apply their test across a range of years and compare the resulting PDF to the prediction, rather than just using a small number of cherry picked starting points. Doing this clearly shows the predictions to have not yet been falsified.
Finally, a Real Skeptic would know that the shortest period referred to as a climate normal is 20 years, and the typical period is 30 years. Therefore they would never use less than a 20 year period to test a climate prediction. They would recognize the attempts to use 15 year periods (three years ago) growing up to 18 years (now, so as to carefully keep 1998 as the start year) represent carefull propaganda rather than actual analysis of the climate trend against the climate prediction.
-
Tom Curtis at 10:07 AM on 31 October 2015Climate's changed before
A Real Skeptic would know, having examined the issues, that Mann Bradley and Hughes 1999 (MBH99), aka, the Hockey Stick, has not been debunked despite strenuous efforts by McIntyre and McKittrick. Rather, McIntyre and McKittrick have used a statistical measure that calls a straight line plus white noise a Hockey Stick to argue that random noise generates Hockey Sticks in an attempt to debunk MBH99.
This is not to say MBH99 is without flaws (many first pointed out by Mann himself in later publications). Rather, it is a reasonably accurate first attempt to generate a multi proxy paleo temperature index with a calculated uncertainty. Because it was a first attempt, Mann, Bradely and Hughes had things to learn and made some mistakes, but the mistakes do not undermine the fundamental conclusions. This is seen by comparing MBH98 to later resonstructions that have eliminated some of those mistakes. Of those, the PAGES consortium reconstruction has used the most data and robust methods, and hence represents the best global reconstruction over recent times:
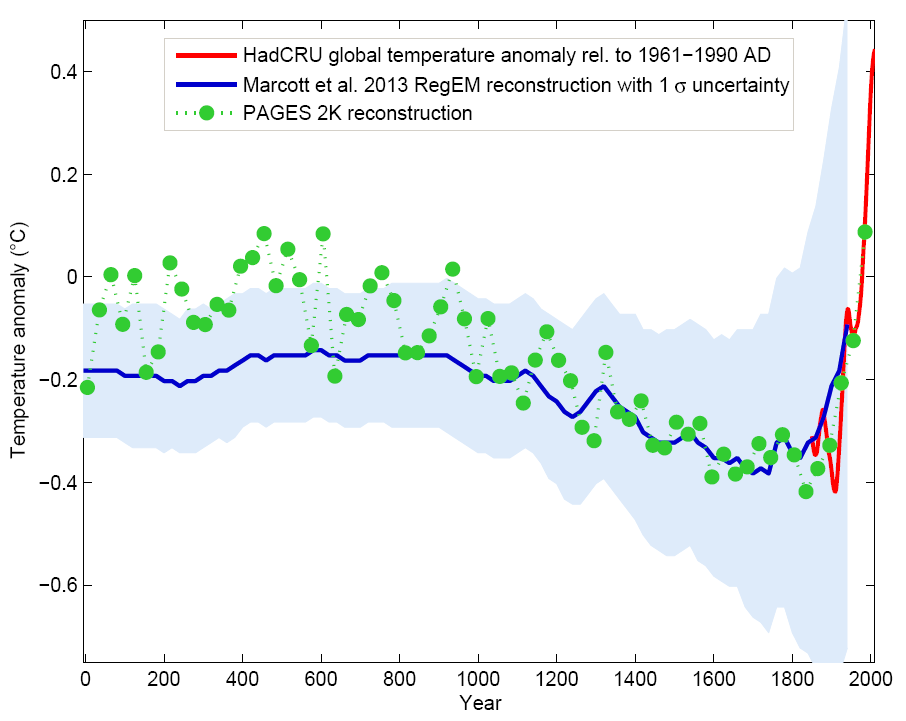
Please note the green dots (ie the PAGES reconstruction) all represent 30 year averages, so that the graph is not smoothed at a different rate for the recent period, yet the 20th century still stands out for the rapidity and magnitude of the temperature rise, not mention the reversal of the long term cooling trend and the magnitude of the final value (1971-2000) which exceeds all others. There is, of course, a qualification on that final result:
"Many of the proxy records used in the reconstructions were generated some years ago and end before the year 2000. The reconstruction for North America, Asia and South America do not extend to the 21st century. The instrumental record shows that the last several decades have generally been warmer than previous decades. Therefore, the most recent 30-year period in our analysis (1971-2000) underestimates the actual temperature of the last 30 years."
(From the PAGES FAQ, my emphasis)
Finally, it is my instinctive reaction to treat "persuasive names" such as "A Real Skeptic Says" as indicating that the person choosing the name doesn't think their real skepcism will come across without their first telling us their presumed status. That instinctive reaction is rarely wrong. So rather than flagging the uncommon skepticism of the person involved, it tends to flag the opposite. Just a word to the wise.
-
Chuck Wiese at 09:19 AM on 31 October 2015A Rough Guide to the Jet Stream: what it is, how it works and how it is responding to enhanced Arctic warming
Phil and moderator: If you are starting with a warmer source region of arctic as is implied in the Francis paper, ( artcic amplification) the temperature of the airmass must be warmer. This means if it is driven southward to a place like Texas as in your examples, it will arrive warmer than it would if the source region in the arctic was colder to start. Since the argument Francis makes claims you will get persistent "stretched" long waves as a result of this warming, she then claims this will lead to temperature extremes.
It is implicit from this that the meaning would be equaling or exceeding current climatological extremes. It is pointless to use that phraseology if the expectation is that future cold will not be as cold as today because of the warming. If what she claims is true, we are moving away from extremes, not engaging or exceeding them. But this claim of hers cannot be so if wave amplitude depends upon speed, which the equations make clear. The wave amplitudes must decrease and the troughs of the waves must migrate to higher latitude. This is basic atmospheric science.
Chuck Wiese
Meteorologist
Moderator Response:[RH] If this is "basic atmospheric physics" you should be able to present published research that says exactly this. If there's not any published research that states exactly what you're claiming, contradicting Dr. Francis, then there are two possibilities. (a) No one has shown this in the research, and there's an opportunity to publish an important paper, or (b) no one else working in the field agrees with your conclusions.
We know from clear, empirical measurements that the arctic is warming faster. So, by your claims, that would result in fewer extreme weather events.
-
Eclectic at 09:06 AM on 31 October 2015Climate's changed before
A.R.S.Says @ #498 :
Alas, you seem to have tied yourself in a knot. Please go back to the issue, and think about it more carefully.
This website's educational material is there to educate you ~ but you need to approach it calmly & logically.
(btw, I must commend your sense of humour in choice of your nom-de-plume ~ the abbreviation is priceless.)
Moderator Response:[JH] Inflamatory & off-topic.
-
Eclectic at 08:58 AM on 31 October 2015It's the sun
A.R.S.Says @ #1158 :
Clearly you haven't read the educational material in this section.
Please do so . . . and then you will see that your expressed ideas are completely without foundation.
(btw, I must commend your sense of humour in choice of your nom-de-plume ~ the abbreviation is priceless.)
Moderator Response:[JH] Inflamatory & off-topic.
-
Eclectic at 08:51 AM on 31 October 2015It's not bad
A.R.S.Says @ #371 :
The question here of "good" or "bad" [regarding Global Warming effects] is very straightforward, really! It is viewed from the point of view of the human race (and which largely co-incides with the beneficial aspect to terrestrial & marine lifeforms).
Worse heatwaves, droughts, floods, and rising sea levels encroaching on land which is heavily settled and/or fertile agricultural. In addition, agricultural scientists point to an overall reduction of staple food production (worsening with each degree of warming).
Please read and educate yourself, in the appropriate section of this website.
(btw, I must commend your sense of humour in choice of your nom-de-plume ~ the abbreviation is priceless.)
Moderator Response:[JH] Inflamatory & off-topic.
-
Chuck Wiese at 08:44 AM on 31 October 2015A Rough Guide to the Jet Stream: what it is, how it works and how it is responding to enhanced Arctic warming
Tom: Thanks for correcting MA Rodgers. He is incorrect to claim the equation he found was what I used. His reference is similar to the derivation of the equation of wave speed for an autobarotropic wave, given as
c= U - BL^2/4pi^2.
If c is wave speed, U zonal wind speed, L wave length and B the Rossby parameter, this realtion is then solved for L by setting c equal to zero. The result is what he just wrote, but that is not the maximum amplitude.
Chuck Wiese
Meteorologist
-
Eclectic at 08:38 AM on 31 October 2015There is no consensus
A.R.S.Says @ #712 :
To be blunt: the word consensus has a very plain, straightforward meaning in the English language.
Your expressed "logic" is a complete failure, since you seem unable to connect words and concepts and realities.
(btw, I must commend your sense of humour in choice of your nom-de-plume ~ the abbreviation is priceless.)
Moderator Response:[JH] Inflamatory & off-topic.
-
Eclectic at 08:29 AM on 31 October 2015It's cooling
A.R.S.Says @ #264 :
Alas, you have got your thoughts into a terrible tangle.
Please read through the educational material on this website, which will help you gain a scientific understanding of the real situation.
(btw, I must commend your sense of humour in choice of your nom-de-plume ~ the abbreviation is priceless.)
Moderator Response:[JH] Inflamatory & off-topic.
-
A Real Sceptic Says at 06:42 AM on 31 October 2015It's cooling
A sceptic does not need to prove that some different or opposite phenomenon is taking place. Sceptics check specific theories. To the extent that observed phenomena matter, it is in whether or not the theory's *predictions* have come true.
In the case of climate change theory, the predictions are necessarily over a substantial period of time - at least 10 years in virtually all cases. Why? Because the climatologists making the predictions claimed (and still do) that they are working with "climate" as opposed to "weather", and that the former must necessarily relate to averages taken over time (always at least 10 years' smoothing of annual weather data).
Therefore, for enough new data to "arrive" to determine the climate (without needing to bring in annual data from years that have already happened) we have to wait that long. Thus the most recent predictions we can actually test are at least 10 years old. Or, to put it another way, the "state of the art" of *tested* climate change theory is at least 10 years old (longer for particular varaints of the theory that demand longer averaging times). Everything spoken and written since then is still just *conjecture*.
The theories that are old enough to test speak of "global average surface air temperatures". Be careful about revisionism here - we sometimes see attempts to update the theory to something that could maybe match current measurements, but every time you check them you will find the originals are about surface air temps.
The so-called "pause" may or may not amount to slight cooling or slight warming. But the predicitons as made in 2005 and earlier, all predicted very *large* rises by now. They really have been refuted by the pause.
Attempts to "explain" the pause are all examples of more recent work - to be valid they must produce their own predictions, and we must wait and see (long enough for a true "climate" average to be determined that doesn't depend on annual data already known). Maybe they will succeed (though to even get published they need to be somewhat catastrophic in nature, so unless a catastrophe actually occurs, my prediction is probably not).
Certainly, deep ocean heating is nothing to do with what was predicted. Does deep ocean heating imply an equivalent conclusion? Well, even if it did, that does not make for a successful prediction. If I predict apples will grow but instead get oranges, I am not a successful fruit predictor!
Does deep ocean heating mean we should immediately accept a new kind of global warming based only on current data? In other words, is the fact alone support of a new alarmism without the need for successful predictions? Of course not. Like the surface temperature warming before the pause, deep ocean heating has other explainations including random natural fluctuations.
Oh and finally, why not check how they know the deep oceans are heating. I think you'll find they don't. It hasn't been measured and is only an extrapolation based on an "overall energy budget" theory which itself has no experimental confirmation as well as being heavily reductionist in nature.
-
A Real Sceptic Says at 06:20 AM on 31 October 2015There is no consensus
Okay so while a sceptic is mostly interested in checking (and if necessary refuting) new scientific claims, it is reasonable to discuss the "consensus" issue due to its importance to science as a whole.
Ironically, there is no consensus on the meanings of the terms used to define this consensus. Does it mean a majority? Or just an important and strongly agreed minority? Do voices with authority carry sway, or is it democratic. Does it need to be "overwhelming" and is it, in fact? Is it absolute or is there internal dissent? Which human beings count as scientists? Which institutions act as gatekeepers thereof and what is their motivation?
Rather than work trough all of these, I will simply ask the reader to consider whether it is healthy that you are being asked to accept the speakers' tacit definitions on these matters, as well as their unstated assumptions. You are being guided toward what is really more of a psychological sensation than any fact-based argument - the sensation of being part of something big and powerful. Maybe a sense of belonging and safety. Maybe moral superiority. Maybe the clarity that comes from being decisively led.
If the reader is ready to understand their own (and their peers') fralties in such areas, then I do not need to discuss the history of systems of control and subjudication. If not, there's no point getting in to it except to suggest you may wish to begin with the Milgram experiment.
Instead, I will take a single example, from the current article, of a flagrent manipulation of the meaning of "consensus" and surrounding terms: the 97% pie-chart.
You thought it said 97% of scientists, right? No. It's 97% of papers. That's right there in the jpeg image itself but you didn't notice it. What else didn't you notice?
If you read the underlying study, what 97% really agree with is somthing along the lines of "do you agree that (a) humans emit CO2 and (b) that the greenhouse effect is real". Your present author does, and so would be a part of the consensus!
The trick here is a toxic mix of pedantry and tactical naivety - as so often seen among precotious fifteen-year-olds, but in this case carefully hidden within a typically dull metholodgy section in a paper. It is *pedantically* true that human CO2 plus greenhouse effect implies *probably* *some* human generated warming. But has human generated warming been *shown* to occur? Not implied. Is it problematic? Not implied. Significant? Not implied. Even detectable? Not implied. Nor does the position in the question even imply that there won't be compensating factors or that warming would even be harmful anyway.
In summary, consensus taken in general is too subject to the frailties of the human condition for any wise person to pay any attention to it. Specific factoids, such as the 97% pie-chart (and there are others) may seem to lend concrete validity, but as soon as you check them you find nothing meaningful, only trickery.
Should we accept climate consensus because consensus exists around, say evolution? A real sceptic can answer this easily: the whole point of science is to investigate methodically the questions whose answers are *not* obvious on the surface. No scientist would ever be so intellectually lazy as to reason that since the climate consensus "sort-of looks like" the Darwinian consensus, that their underlying scientific validities should also match.
Climate consensus is much more like a rainbow. Amazing to look at; vast and magical. But how many times do you have to check for that pot of gold before you accept there's really *nothing there at all*!
-
Cooper13 at 06:16 AM on 31 October 20152015: A Very Bad Year for the Global Warming Policy Foundation
Also....this non sequitur statement:
What the data is showing us is that over the past 15 years or so there has been little underlying change with El Ninos elevating the temperature a little and La Ninas reducing them. Is what is happening to global annual average surface temperatures all that surprising?
is demonstrably FALSE.
If you look at decadally averaged temperatures and ENSO, you will see that during La Nina dominated periods, global temperatures are now remaning about constant (e.g. actually a 'hiatus') and during El Nino dominated periods, we are getting about 2x the decadal warming rate of the overall average. Over the past century, global temperatures basically stair-step based on ENSO phases, but they have NOT gone down.
-
Cooper13 at 06:12 AM on 31 October 20152015: A Very Bad Year for the Global Warming Policy Foundation
@One Planet Only Forever-
Well-put. It's worth noting, also that the 97/98 event was preceded by a fairly COOL 1997 year. If you want to compare THIS El Nino event and global temperatures, it should be compared with 1997 at this point, and then 1998 compared with 2016.
It is not being presented clearly enough to people that global temperatures lag El Nino by 3-6 months, which is how the data were handled in that graph posted by LarryM, originally in the Houston Chronicle.
-
One Planet Only Forever at 05:58 AM on 31 October 20152015: A Very Bad Year for the Global Warming Policy Foundation
Another fact against the claims that warming has not continued is that in previous El Nino events it is the year following the start of the El Nino that is the warmest, 1998 for the 1997/98 event. So it is likely that the 2016 global average will be even warmer than the anticipated 2015 global average.
And there is no need to wait for the end of a calendar year to get an annual average. Any 12 month period contains each month of a year. And the trend so far through 2015 is clearly that the averages of 12 months keep going up with each new month.
The trend of 30 years also continues to go up with each new month. In fact the trend the 30 year averages never 'noticably paused'. Every new month is significantly warmer than the month 30 years before. And it seems likely that February 2028 will be warmer than that very unusually warm Feb 1998 value, even if 2028 is La Nina influenced (the graph in LarryM's comment shows an average difference of about 0.15C between El Nino and La Nina).
-
Bert from Eltham at 05:51 AM on 31 October 20152015: A Very Bad Year for the Global Warming Policy Foundation
LarryM I crudely plotted the estimated 2015 temperature anomaly using up to September data here
http://d1355990.i49.quadrahosting.com.au/2015_09/2015est.jpg
Bert
-
A Real Sceptic Says at 05:42 AM on 31 October 2015It's not bad
On the matter of the "goodness" or "badness" of outcomes, scepticism in the scientific sense is not relevent - because it is not a scientific question. It would be scientific to ask whether a given outcome is more or less likely under different global climate conditions (but sadly, few such predictions are scientifially checked, on either side of the debate).
It is elightening, though, to look at the stats. Cliamte change alarm supporters invariably cite all or virtually all consequences as "bad". They will fargue the toss each and every time a "good" outcome is found.
Statistically speaking, is it reasonable for a small change in climate to have 10, 100 or 1000 times more "bad" consequences than "good"? No. Even if there was some underlying mechanism skewing the true outcomes toward "bad", it could not possibly be as extreme as the alarmists from the IPCC to this site and everywhere in between claim... and one can easily show to an adequate statistical significance that they are biassed.
How could bias creep in? Well, the individual negative outcomes are often fabrications (do you have time to check them all? There are thousands!). They are cherry-picked in type, methodology and location. You can see this by taking one and asking "how many other kinds of scenarios could be looked at, that differ in some way from this case?". And you will usually find *those* outcomes are far less "bad". Many, maybe 50%, will be "good". So naturally you wonder how the one that was published (and included in alarming lists on the internet) was chosen.
What *true* underlying skew might there be? Well, the most obvious one is that more human beings are harmed by cold then by warm, and that more of the world becomes fertile when it is warm. Beyond that, the question rapidly bifurcates into less and less generally applicable effects, operating in both "good" and "bad" directions, with no "force majeure" to make them skew in either direction.
So by the (very few) arguments that are sufficiently general to produce an overall skew, warming is a net "good". The remainder of arguments should be randomly distrinuted, or at least close to that. So people who claim they are mostly bad (or mostly good) are biassed (we can be confident of that).
Of course, there are other moral positions. An actor changes something, another actor suffers as a result even though many actors benefit. What's your position on that? Well, in the case of global warming, it isn't even clear who is the actor making the change. Is it the humams who emitted CO2? OR the other humans trying to stop the first humans? Because both groups' actions will hurt *somebody*.
-
A Real Sceptic Says at 05:19 AM on 31 October 2015It's the sun
Climate change advocates have a tendancy to casually disregard the sun as an influence. This may be unreasonable given that the importance of the sun in virtually all of earth's natural processes *should* make it first port of call when trying to explain phenomena.
However, sceptics do not need to provide a solar explanation for global warming. They only need to state that one could exist. Advocates of human climate change may then either rule the sun out completely out or provide support for their preferred explanation (human CO2) by independent means. The latter is obviously off-topic for the current article.
The explaination given by scepticalscience.com does not rule out solar influences. All it does is cite one rather simplistic hypothetical mechanism for solar influence and then dismiss *that*. This could be called a straw man argument. It indicates a preference for putting words in the mouths of sceptics and then debunking *those* rather than listening to what sceptics are really saying.
Do sceptics have a convincing mechanism for a solar explaination? Well, there are some *feasable* ones, but nothing really solid.
So the status on this question is as follows: we can't say it *is* the sun and we can't say it *isn't*, either. Climate alarmists must *thouroughly* rule out the sun as a cause before making any argument along the lines of "warming must have the cause we say it does because there are no other viable causes".
-
A Real Sceptic Says at 05:05 AM on 31 October 2015Climate's changed before
Real sceptics ask the question, "Are the changes in climate that have occurred since significant human CO2 emission fundamentally different from those that occurred before?". If yes, that would support the CAGW view. If not, CAGW *could* still be true, but the recent climate changes could not be cited as support for it except in a weak, probabalistic way.
The problem is, for sceptics, that the support from the historical record has been repeatedly miserpresented and even falsified.
Firstly, the Michael Mann's "hockeystick graph", given prominence in Al Gore's propaganda work, is still cited from tie to time in spite of having been debunked. It shows climate as virtually constant for a millenium before human CO2 and in doing so ignores important changes such as the Medieval Warming Period, the Little Ice age, as well as a noticable warming trend in the hundred years or so before human CO2 emissions.
Other, more recent graphs are a good deal more honest about such things. However, the "trick" being used now is more subtle. These graphs are, without exception, smoothed to a far greater degree during pre-CO2 periods than the recent period. For example, you will see 100-year smoothing up to 1950, followed by 10-year or even unsmoothed data. It should not surprise that the less-smoothed period is less smooth - and the more bumpt section looks more alarming!
Graphs going back over many thousands of years are often even more heavily smoothed. I saw one recently that went back 400,000 years, meaning that it gave only 1 or 2 pixels to each 1000-year period, and yet the last 50-years was shown explicitly, with probably only 10-year smoothing. Now, if the underlying data has more resolution, then the correct way to show the data is with a shaded region between min and max values (so the fine variation may be seen), rather than a saeries of averages (which is just another way of hiding detail on shorter timescales).
To be fair, many studies will be intrinsically unable to uncover that fine detail. But when presenting that data, the fact that past rapid changes will not be present should be honestly pointed out. Not kept quiet.
Nearly every graph you now see of past trends is, whether by manipulation or limitations of the underlying study, not showing past rises of the kind seen in the last 50 years but only averages that would hide it. As a result, it would be incorrect to assume from them that such rises have not occurred.
Suppose for example we see a cold day followed by a hot day. Someone micht claim that is an unprecidented event. Suppose they show you a graph of the last year's temperature, and smooth that graph out by taking weekly averages. Of course you won't see any examples of the event having happened before - the smoothing process rubbed them out!
-
LarryM at 04:49 AM on 31 October 20152015: A Very Bad Year for the Global Warming Policy Foundation
An excellent visualization of the impact of El Nino (and La Nina) on the underlying global warming trend is the SkS animated gif that shows the temperature trend for separate Nino/neutral/Nina years (graphic #67).

-
knaugle at 02:12 AM on 31 October 20152015: A Very Bad Year for the Global Warming Policy Foundation
Using the Cowtan's University of York temperature plotter, it is interesting that the RSS satellite data shows a small cooling trend since 1998 (particularly if one ignores the two big El Nino spikes in 1998 and 2010). Yet UAH shows a warming trend over the same time frame. I think until the reason RSS is not keeping up with the rest of the data sets is clearly communicated, deniers will remain on the dark side of this pseudo-debate. Meanwhile, there is that "10 indicators of a warming world" that suggests to me that RSS is missing something.
-
Tom Curtis at 00:57 AM on 31 October 2015A Rough Guide to the Jet Stream: what it is, how it works and how it is responding to enhanced Arctic warming
MA Rodger @73, Wiese's formula is A = 2 *(ν/β)0.5, where A is amplitude, ν is the North/South component of the wind field, and β is the Rossby Parameter. In addition to calculating wavelength (Lx) rather than amplitude, the formula you have found includes pi as a factor and uses the uo, ie, the "basic flow" of the geostrophic velocity, ie, the flow excluding perturbations. Under the conditions of the derivation, that is said to be a North/South flow but it is not equivalent to ν in all circumstances and that may be a relevant difference between the two formulas. So, while the formulas are superficially similar, they are not the same.
-
Philip64 at 23:00 PM on 30 October 2015Newest Entry in Inside Climate News’ #ExxonKnew Story is a Doozy
Propaganda undermines the foundations of democracy. It's serious.
-
MA Rodger at 21:20 PM on 30 October 2015A Rough Guide to the Jet Stream: what it is, how it works and how it is responding to enhanced Arctic warming
For those who are intrerested, when Chuck Weise Meteorologist deigns to stray onto the topic of this comment thread, the equation he is constantly waving so vigourously ( Lx = 2π(u0/β)½ ) is derived here. You will note the equation applies to stationary waves which may be allowable as the Francis & Vavrus (2012) paper is mindful of blocking weather patterns. Also the quantity Lx is actually the wave length rather than the amplitude, although in the simple theoretical model being used amplitude will be proportional to wave length.
Moderator Response:[RH] Being this is core to the OP I would request all commenters to direct their questions and observations to this issue.
-
Phil at 20:15 PM on 30 October 2015A Rough Guide to the Jet Stream: what it is, how it works and how it is responding to enhanced Arctic warming
Chuck Wiese @67
how is it that cold air from the arctic can penetrate further south in her scenario if the arctic is warming rapidly?
Very cold air in the arctic can warm rapidly and still be colder than (for example) slower-warming Texan air. How come Chuck Wiese Meteorologist doesn't realise this ?
-
PhilippeChantreau at 14:53 PM on 30 October 2015A Rough Guide to the Jet Stream: what it is, how it works and how it is responding to enhanced Arctic warming
Sidd said pretty much everything there is to say. Chuck Wiese seems to have a Gerlisch and Tschneuer type of argument.
Ignore the U of O link if you must Mr Wiese, I provided other links, including one to your colleague Paul Douglas, who refers to NOAA and explains exactly the same thing outlined above, i.e. low zonal flows, high amplitudes.
The Francis and Vavrus paper is anything but isolated
http://www.pnas.org/content/111/34/12331.abstract
http://www.nature.com/ngeo/journal/v7/n9/abs/ngeo2234.html
Chuck Wiese seems sensitive to expertise and authority. This last paper includes many authors, I don't know exactly how many have PhDs but at least Francis, Coumou and Overland do. Coumou has extensive expertise in fluid dynamics. How likely is it that they all have missed something that Chuck Wiese is the only one to understand? And the reviewers as well? Really?
Besides, I maintain that the argument "it hasn't warmed in 18 years" is exclusively dependent on cherry picking data set and starting point and is misleading and dishonest.
-
bozzza at 14:33 PM on 30 October 2015A Rough Guide to the Jet Stream: what it is, how it works and how it is responding to enhanced Arctic warming
My mistake- you did answer that.
My latest question for you was: " You are saying CO2 has no effect on anything, perhaps?"
Prev 561 562 563 564 565 566 567 568 569 570 571 572 573 574 575 576 Next


