


 Arguments


Recent Comments
Prev 565 566 567 568 569 570 571 572 573 574 575 576 577 578 579 580 Next
Comments 28601 to 28650:
-
Tom Curtis at 23:08 PM on 18 June 2015What you need to know about the NOAA global warming faux pause paper
1) Just rehashing, because the temperature series is an anomaly series, it made absolutely no difference to the end result whether Karl et al added 0.12 to the buoy data, or subtacted it from the ship data. For simplicity of illustration, assume there was no buoy data till 2001. Supose then we subtracted the bias correction from the ship data. It follows that the temperatures durring the anomaly period (1971-2000) would have been reduced by 0.12 C. However, recalculating the anomaly would reset the average over that period to 0 C, thereby adding 0.12 C to all values to obtain the anomaly value. For shipboard measurements, the two adjustments would cancel, but for buoy measurements there would be a net 0.12 C adjustment regardless of whether you initially adjusted shipboard or bouy data. The only difference is whether you include that change to the buoy data as an explicit adjustment or implicitly in caclulating the anomaly period.
You already get this, and so should everybody else including the authors of the WUWT post because (excluding the sheer number of values involved) this is simple arithmetic. Put another way, if Michaels, Lindzen and Knappenberger are not being completely disingenuous, they are demonstrating that fourth grade arithmetic is above their payscale.
2) Yes, adding more buoys will increase the temperature but only because it removes an artifact produces by the increase in the number of buoys while incorrectly assuming that shipbourne and bouy temperature measurements were not biased with respect to each other.
3) From the paper:
"Of the 11 improvements in ERSST version 4 (13), the continuation of the ship correction had the largest impact on trends for the 2000-2014 time period, accounting for 0.030°C of the 0.064°C trend difference with version 3b. (The buoy offset correction contributed 0.014°C dec−1 to the difference, and the additional weight given to the buoys because of their greater accuracy contributed 0.012°C dec−1."
(My emphasis).
And from the supplementary material:
"In addition, because buoy data were determined to have less noise than ship data (greater precision), another improvement was to give buoy data more weight when using Empirical Orthogonal Teleconnections to reconstruct SST (see equation 3 in (13))."
So, contrary to the Michaels, Lindzen and Knappenberger's argument, the buoy data was given greater weight because it was more accurate. Once we ignore Michaels, Lindzen and Knappenberger's smoke and mirrors trick (ie their failing grade in arithmetic), the paper in result in fact gives more weight buoy data which increases the measured trend.
-
Yail Bloor III at 23:03 PM on 18 June 20152015 SkS Weekly News Roundup #25A
You've linked a number of good stories but here is a link for a WaPo story I enjoyed:
There was a comment by one that countered with (not an exact quote) "Don't blame snow cover loss on melting, winter precipitation is down and that's the real reason for the lack of snow cover." He proceeded to link to a Climate4You image showing (eyeroll) the decline of precipitation. Yes, Ole Humdrum (sic). It was fishy, as you might imagine. My response:
Never mind, I figured it out. Ole was creating the precipitation anomalies using the totals from each year, November through April. This image specifically compares the 1990s to the average of the whole 20th century. I can see that being a problem...assuming we want information that's actually helpful. First problem: knowing how the last decade (9 years, to be precise) of the 20th century compared against an average of the entire previous century precipitationwise doesn't seem particularly relevant in 2015. Second problem: this image should come from precipitation information from everywhere in the Arctic, all the way down to the 50th parallel (according to Ole). Does this include precipitation data for Alaska from 1901-1924? NOAA doesn't have this information on their website...I'm wondering if they considered the data reliable. Otherwise, one would think they would include it.
Link: http://www.ncdc.noaa.gov/cag/time-series/us
If my calculations are correct, the average annual (liquid) precipitation for 1925-2000 (Nov.-April) is slightly less than 16". The average for the 15 years since Nov. 2000 is almost exactly the same, oddly enough. Gosh, what happened? Where's the snow? They almost cancelled the Iditarod for lack of snow. They hauled in a bunch of snow for the concluding ceremony in Anchorage...they almost didn't get finished before it melted. Then I remembered...when we got the icy blast in the Appalachians last February, I checked Fairbanks' weather. High near 50...and RAIN. There's some of the missing snow, it was rain. The rest of it vanished during the May heat blast. (For the next 10 days, Fairbanks (and more) will be back into the low-to-mid 80s.)
Your Ole climate image, it was showing a lot of negative precipitation anomalies over Alaska, a bit surprising. I noticed if the precipitation is one molecule under the 100 year average, the lightest shade of yellow appeared. Guess how much lower it has to be to get the next darker shade? 0.4 inches...only 10 millimeters. Ole thought it would be cute to have 10 mm increments between color shades. That's one way to create a false impression without actually lying. I don't trust denier websites. They almost never present data that they haven't massaged to a bloody pulp. I'm not interested in propaganda, don't have time for it.
Moderator Response:[DB] Removed extraneous and incomplete hyperlink.
-
Tom Curtis at 22:31 PM on 18 June 2015Video: scientists simulate the climate of The Hobbit's Middle Earth
shoyemore @6, that Connemara inspired Tolkein's conception of the geography from the Dead Marshes looking towards Mordor is certainly possible. I suspect, however, that like most major geography in middle earth it was determined by the necessities of a concieved history moderated by the requirements of the narrative. From that perspective Emyn Muil would have been conceived first, along with the nature of Mordor as surrounded by mountains. With that, we then add Dagorlad ("battle plain") and the Dead Marshes as necessary battle sites due to their relation to the primary exit from Mordor. Tolkien would then have fleshed out both with two different conceptions of the effects of combat on geography. Dagorlad (previously home to the Ent wives) was, in effect England (or the Shire) made desolate by warfare; while the dead marshes hark back to "no man's land" of the Somme (where Tolkein fought).
On that theory, we must imagine the Dead Marshes as looking like this:
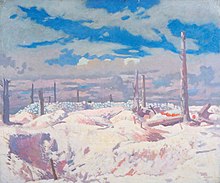
Only we must imagine the unrecoverable corpses still preserved by vile magic, and the pits and hollows fill with stank water forming ponds covered by an algal scum and dank struggling grasses on the verge of any land still above water.
That speculation has support both in Tolkein's description of the Dead Marshes:
"Dreary and wearisome. Cold, clammy winter still held sway in this forsaken country. The only green was the scum of livid weed on the dark greasy surfaces of the sullen waters. Dead grasses and rotting reeds loomed up in the mists like ragged shadows of long forgotten summers."
And also in Tolkein's own comments in his letters.
On this view, then, the rise above the bog of the mountains of Mordor are a necessary consequence of the notion that Mordor is surrounded by high, nearly impassable mountains, while the foreground is determined by an imagining of the Somme turned swampland.
(The picture, by the way is of Scwhabben Redoubt, where Tolkein fought as part of the 25th division).
Finally, the only worthy endnotes to the trilogy are The Silmarillion, Hurin's Children, and sections of Unfinished Tales which I heartilly recommend to anybody who has read and enjoyed the trilogy. I understand that some people find the Silmarillion difficult going as it is not in the style of modern novels, so if you have tried to read the Illiad or the Mort d'Arthur and not enjoyed them, perhaps read only Hurin's Children.
I would be delighted to think of myself as (and certainly Lunt has) contributed a useful footnote to Tolkein scholarship.
-
mwsmith12 at 22:29 PM on 18 June 2015What you need to know about the NOAA global warming faux pause paper
michael sweet,
The authors of the WUWT post claim that adding .12 to the buoy data it must put a warming trend in the data:
"Adjusting good data upward to match bad data seems questionable, and the fact that the buoy network becomes increasingly dense in the last two decades means that this adjustment must put a warming trend in the data."
http://wattsupwiththat.com/2015/06/04/noaas-new-paper-is-there-no-global-warming-hiatus-after-all/
That's right, isn't it? As more buoys are added, more artificially high readings are added.
-
michael sweet at 21:31 PM on 18 June 2015What you need to know about the NOAA global warming faux pause paper
mwsmith,
The data need to be adjusted because the temperature of the ocean used to be measured using ship intake tubes and now is measured with buoys and ships. If all the data was currently collected using buoys the data would need to be adjusted because the older data is higher than it should be due to calibration issues. Whenever there is a change in the method of collection adjustments have to be made.
Much larger adjustments were made when canvas buckets were switched to wooden buckets and when the change was made from wooden buckets to engine intakes. Those adjustments were made by adding temperature to the older measurements. This lowers the measured temperature trend, The overall adjustments lower the measured trend for the entire globe about .1C, but they will never say that at WUWT. Imagine how many adjustments have to be made in the satalite record where the calibrations change with each new satalite, as each satalite orbit decays and as the time of day changes.
You are correct that the scientists you report at WUWT know that they are disingenious at best. I see no way that all data can be reported in such a way that people who want to lie cannot find a way to decieve others. This site is dedicated to countering those lies by providing correct explainations.
In the end, the record temperatures for 2014 and 2015 will convince many people that AGW is real. The record floods in Texas that ended their record drought will convince others (since AGW predicts both more drought and more floods).
-
mwsmith12 at 20:37 PM on 18 June 2015What you need to know about the NOAA global warming faux pause paper
This is important because it illustrates how contrarians leverage these details into doubt and suspicion.
This is a quote from post by Patrick Michaels, Richard Lindzen, and Paul Knappenberger over at WUWT. I don't read that site, but posts from there get used everywhere, so I had to deal with this one:
"In addition, the authors’ treatment of buoy sea-surface temperature (SST) data was guaranteed to create a warming trend. The data were adjusted upward by 0.12°C to make them “homogeneous” with the longer-running temperature records taken from engine intake channels in marine vessels.
"As has been acknowledged by numerous scientists, the engine intake data are clearly contaminated by heat conduction from the structure, and as such, never intended for scientific use. On the other hand, environmental monitoring is the specific purpose of the buoys. Adjusting good data upward to match bad data seems questionable, and the fact that the buoy network becomes increasingly dense in the last two decades means that this adjustment must put a warming trend in the data."
http://wattsupwiththat.com/2015/06/04/noaas-new-paper-is-there-no-global-warming-hiatus-after-all/
The authors are trying to convince me that homogonization is cheating. They put it in quotes. Well, I already know why homogenization is important and how it improves data qaulity, but even so, why add 0.12C to all the buoys when the buoys were designed for this and should be more accurate than measurements from ships that are just trying to get from A to B as fast as possible?
And despite my being a career software engineer who at least reads a lot of climate science reportage and the occassional paper, and who understands the scientific method and the concepts of statistics etc, I was still left with some doubt because it isn't clear to me why data that seem to me to be more accurate are adjusted up to be compatible with data that seem to me to be less accurate.
Having now understood the explanation, I can't believe the three authors of the WUWT post don't know it already. And if so, their objection is disingenuous at best. But it would be very useful to the general public if each scientific paper could have an accompanying link to a page on which these explanations are provided, together with the perhaps bogus objections that require them.
Maybe a section here at Skeptical Science, where these papers are catalogued toghether with all the contributed explanations for questions like: Why did we add 0.12C to the buoy data, and why is that the right thing to do?
-
mwsmith12 at 19:30 PM on 18 June 2015What you need to know about the NOAA global warming faux pause paper
But it's because the thermometers move from grid to grid, and the record for a particular grid can include both types of measurment. If buoys were used in the Pacific, and ships were sed in the Atlantic, there would be no interference so they wouldn't have to be adjusted.
-
shoyemore at 17:53 PM on 18 June 2015Video: scientists simulate the climate of The Hobbit's Middle Earth
Tom Curtis,
Wonderful tongue-in-cheek critique of Dan Lunt's model. Kudos to Cook and Lunt for the videos.
Your knowledge of MIddle-Earth is better than mine, but I still have a hankering for a view of Mordor's edge across the Dead Marshes, approaching from Emyn Muil being like the top picture. I am sure the rainfall in the West of Ireland does not match that of the model (about a factor or 2 higher, I think), but as a visualisation it pleases me.
The best MIddle Earth of all is the one we retain in our imagination. John, Dan & Tom have stimulated our imagination and supplied worthy endnotes to the trilogy itself.
-
chriskoz at 16:59 PM on 18 June 20152015 SkS News Bulletin #4: Pope Francis & Climate Change
Republicans' leading climate denier tells the pope to butt out of climate debate
Oklahoma senator James Inhofe [...] calling global warming “the greatest hoax ever perpetrated on the American people”, took a star turn on Thursday at the Heartland Institute[...]
His message – that “God is still up there” and that Pope Francis should mind his own business – sent a clear signal to his fellow conservatives
That's just hillarious. To maintain the tenacity of his position, Inhofe is now assuming the role of fake religious leader. How far would he be able to travel that way before the obvious stupidity of such ideology becomes untenable?
-
One Planet Only Forever at 14:38 PM on 18 June 2015The latest global temperature data are breaking records
The last sentence was meant to be "Those results would just make most of those other type of people more uncomfortable, not more inclined to change their minds."
-
One Planet Only Forever at 14:32 PM on 18 June 2015The latest global temperature data are breaking records
Andy Skuce @ 44,
I agree that annual averages would be a more appropriate comparison to previous annual averages.
The average of the 12 months ending in May 2015 is 0.72 C, which is indeed lower than the 0.77 C average for the first 5 months of 2015.
The highest 12 month average in the NASA data set was the 12 months ending in March of 2015 (0.728 C). Using the Temperature Trend calculator it is easy to see that these 12 month averages are higher than any other 12 month period.
And if the El Nino condition continues and strengthens then it is likely that the 2015 values for June and July will exceed the values of 2014 (June 0.61, and July 0.50), by enough to make the 12 months ending in June and then July each the highest 12 month averages in the data set to date. And that is without a strong El Nino increase like 1998.
The 12 months ending in March 2015 should be enough to convince people that the expected warming of the global average surface temperature due to increased CO2 can continued to be seen in the global average surface temperature records, except the most made-up minds or easlily impressed minds that prefer messages dismissing or discrediting that type of information.
Even warmer 12 month averages ending in June or July should not be necessary to convince someone who is open to understanding what is going on. Those results would just make most of those people more uncomfortable, not more inclined to change their minds.
-
Lloyd Flack at 12:40 PM on 18 June 20152015 SkS News Bulletin #4: Pope Francis & Climate Change
What I really, really hope he does is denounce the idea, popular among religious denialists, that God has created the World to be proof against damage thata humans can cause. I have see plenty of disingenuois false humility claiming that it is presumption to believe that puny humans could harm what God has created. I see variations of this from atheist deniers as well, with rather less justification. This really is a claim that God backs your side of politics and your opponents are doing evil, not you.
-
Composer99 at 11:42 AM on 18 June 2015Video: scientists simulate the climate of The Hobbit's Middle Earth
Tom Curtis @2:
Well played, sir. Well played.
-
Bob Loblaw at 11:30 AM on 18 June 2015What you need to know about the NOAA global warming faux pause paper
Everyone:
Please note that there is a user "Martin Smith" asking much the same questions over at RealClimate. This is the answer I posted over there (currently awaiting moderation).
Martin Smith: "<i>How was it decided that the ship-based measurements are more accurate than the buoy measurements?</i>"
You are making the incorrect assumption that choosing one implies that it is "more accurate".
The ship-based measurements are more accurate at measuring the temperature where the ship-based estimates sample the temperature. The buoy measurements are more accurate at measuring the temperature where the buoys sample the temperature.
The two are different. You can't mix them arbitrarily and expect to look at trends. You need to decide how different they are, and shift them to match where you have overlap. It does not matter whether you shift one up or the other down. The choice does not affect the resulting trend.
-
Tom Curtis at 09:14 AM on 18 June 2015Video: scientists simulate the climate of The Hobbit's Middle Earth
Sorry, I forgot to add a link to Lunt's paper.
-
Tom Curtis at 09:10 AM on 18 June 2015What you need to know about the NOAA global warming faux pause paper
mwsmith12 @38, global temperatures are presented as anomalies (ie, variations from the mean value) of a thirty year period. From the zero value they appear to have used a 1971-2000 anomaly, although 1951-1980 and 1981-2010 anomalies are also commonly used. Had Karl et al taken the buoy data as accurate and adjusted all ship based data accordingly, that would make no difference to their having done the opposite because the anomaly adjustment would have eliminated any difference. Indeed I see no evidence that that is not what they did.
-
Tom Curtis at 09:00 AM on 18 June 2015Video: scientists simulate the climate of The Hobbit's Middle Earth
shoyemore @1, Mordor, or at least the plains of Gorgoroth which Frodo and Sam transited, was presented by Tolkein as being almost devoid of plant life. Ergo even Mordor pound is too verdant to represent Mordor:
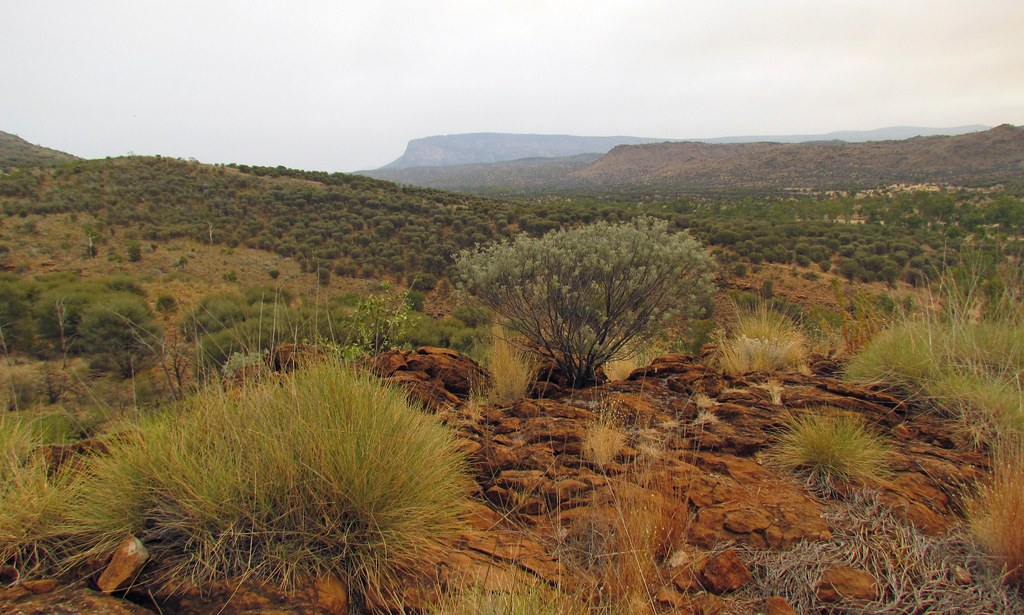
Further, the reason for the baren terrain of Gorgoroth presented by Tolkein was the poisonous fumes from Orodruin, so that even the spinifex that dominates the vegetation in Mordor Pound would probably not have survived there.
-
Tom Curtis at 08:50 AM on 18 June 2015Video: scientists simulate the climate of The Hobbit's Middle Earth
Just to show that Tolkien buffs are never satisfied, I reproduce my (tonge in cheek) comment on Lunt's paper from when it was first released below. Prior to that, however, I want to note the excellent teaching value of the model and of the video's by John Cook. Well done in both cases. And now, my comment:
"There are several things to be said about the climate modeling of Middle Earth, the most obvious of which is that it failed to reproduce the climate of Middle Earth. This can be seen clearly in the Forodwaith which is shown as far to warm relative to observations. The predicted broadleaf forest over the grasslands east of Mirkwood are also a concern.
It is difficult to assess whether is a problem with model physics, or the set up. Certainly, the set up does not match geographically with Middle Earth as it is known. In particular, Tolkien said:
““The action of the story takes place in the North-West of ‘Middle-earth’, equivalent in latitude to the coastlands of Europe and the north shores of the Mediterranean (…) If Hobbiton and Rivendell are taken (as intended) to be about the latitude of Oxford, then Minas Tirith, 600 miles south, is at about the latitude of Florence. The Mouths of Anduin and the ancient city of Pelargir are at about the latitude of ancient Troy.”
(Quoted from here, note, the map at that site is a load of crap)
Being more specific, The Grey Havens, the Shire, and Rivendel are all approximately on the same latitude, about that of Oxford (52 degrees North) on modern Earth. Contrary to that, the model places the latitude of the Grey Havens at about 60 degrees North. The model does correctly place Pelargir and the Mouths of the Anduin at about 40 degrees North, however, but the consequence is that Middle Earth is expanded in scale.
The more northerly latitude of the Shire in the model is difficult to reconcile with the the warmer than observed Forodwaith. Clearly the observed Middle Earth is colder overall than is shown in the model, a fact possibly attributable to the lower solar constant in the past, but more probably attributable to a lower CO2 content, thus explaining the reasonable temperature estimates for more southerly lands in the model. A CO2 content significantly lower than the preindustrial value used would allow colder northerly latitudes due to arctic amplification.
The poor model geography is not restricted to just the poor scaling of Eriador (the territory west of the Misty Mountains) and Rhovanion (that east of the Misty Mountains as far as the Iron Hills). The model topography is clearly shown as including Numenor and the undying lands. That clearly identifies it as a model of the Second Age of Middle Earth. It is, however, purported to be a model of Third Age Middle Earth, as clearly indicated by its purported (see below) author, Radagast the Brown. Radagast as one of the Istari, did not arrive on Middle Earth from the undying lands until 1050 of the Third Era. Indeed, as Middle Earth was flat until the fall of Numenor, at which time the undying lands were removed from the Earth and became only accessible on elven vessels, it is impossible that the model be both of the Second Age, and hence also impossible that the model topography is correct.
I need not go into the entirely speculative extended eastern and southern continents shown in the model topography.
In addition to representing poor scholarship, the article is a transparent forgery. This is most clearly seen in the fact that the “Elven” and “Dwarvern” versions are merely transliterations of English into the Tengwar and Cirth scripts. Even the identification of Cirth as Dwarven is incorrect, it having been originally devised by Elves, and merely adopted for the Dwarves. Had “Radagast” being who he claimed to be, he would no doubt have composed the article in quenya, the more scholarly of the two elvish languages. He also would probably not have produced a Khuzdul version, the dwarves being secretive and not teaching the language to others.
I am disappointed that you have ignored these clear modeling flaws, not to mention the transparent forgery to concentrate on trivia about some inconsequential “climate scientist” who appears not to have the least knowledge of Middle Earth."
I noted with pleasure that John Cook in questions in the first video picked up on the fact that Middle Earth was flat (until the fall of Numenor), but Lunt evaded his question on that point. However, he failed to pick up on the fact that Elves did leave Middle Earth from near the mouths of the Pelargir (near Tol Amroth). Lunt offered an explantion as to why they left from the Grey Havens rather than "western Gondor" but Tol Amroth was at the same latitude as western Gondor so his explanation explains too much.
-
scaddenp at 08:14 AM on 18 June 2015The latest global temperature data are breaking records
Any further comment on chaos should go on the thread "climate is chaotic and cant be predicted". Lots of useful stuff there.
-
scaddenp at 06:17 AM on 18 June 2015The latest global temperature data are breaking records
Weather is chaotic - do you have evidence to support the assertion that climate is chaotic? The fact that temperate summer average is always warmer than winter average is strong evidence that while weather is chaotic, it is bound by limit of the energy balance.
-
Tristan at 05:03 AM on 18 June 2015The latest global temperature data are breaking records
@Yvan
Ah. Can you show me some of the literature that relates to air temperatures 'stepping' from one 'attractor' to another? -
Andy Skuce at 04:05 AM on 18 June 2015The latest global temperature data are breaking records
While it is true that the first five months of this year have set a record compared to previous years, the difference is not as much as the graph with the red star implies. Strictly speaking, we should only compare annual averages with annual averages.
The corresponding figures for the first five months of the year would also have broken the chart in 2002. 2007 and 2010.

Of course, with the El Nino this year, the annual figure for 2015 may well break the chart and require a new y-axis.
-
michael sweet at 03:15 AM on 18 June 2015What you need to know about the NOAA global warming faux pause paper
mwsmith12,
Even if they know that the bouy data is more accurate it makes less of a change in the entire record to change the bouy data. All the data has been previously adjusted to a single baseline with the ship data. If they adjust the bouy data they only need to change the last 15 or so years of data. If they accept the bouy data they have to adjust the rest of the record down so it looks like a bigger change.
Since they are only interested in the trend and not the absolute temperature it makes more sense to adjust the bouy data to match the old data. In general, the record is not used to measure the absolute temperature of the Earth, only the change.
-
KR at 01:54 AM on 18 June 2015The latest global temperature data are breaking records
topal - Yes, the data is real data, but it's so isolated and cherry-picked (small area SST, not global data or volume data) as to show nothing but noise, with deceptive and erroneous baselines, highlighting 'step changes' that he calls significant, but cover periods as short as 5-12 years (i.e., short term variations and not climate trends), etc.
The data is real. But Tisdale looks at leaves, and only those turned the way he likes, not the forest as a whole - making them useless for analyzing global changes. And worse yet he draws utterly unsupportable (and unphysical) conclusions from them. They are meaningless, and in fact deceptive, if your goal is discussing climate change.
-
Tom Dayton at 01:49 AM on 18 June 2015What you need to know about the NOAA global warming faux pause paper
mwsmith12, temperatures are used for trend analysis by determining a temperature for each geographic grid square. In a given square at a given time, sometimes the only temperature will be from a single buoy, sometimes from a single ship, sometimes from combinations of buoys and ships. For that square, the temperature from one time to the next time would be biased if at time 1 the temperature was from a buoy and at time 2 from a ship, or vice versa, or any other different combinations of sources of the measurements varying across time. Adjusting the buoy and ship measurements to remove their systematic difference, removes that bias.
-
mwsmith12 at 01:31 AM on 18 June 2015What you need to know about the NOAA global warming faux pause paper
Tom Dayton, I understand why trend and relative temperatures are what is important and that the effect on trend is te same regardless of which way the systematic difference is removed, but if they knew, hypothetically, that the buoy measurements are more accurate, would they still remove the systematic difference by adjusting the data that are more correct? Did they adjust the buoy data because they know it is wrong and, if so, how do they know it is wrong? But if they don't know it's wrong, and if they don't know which data are wrong, why remove the systematic difference at all?
-
shoyemore at 01:18 AM on 18 June 2015Video: scientists simulate the climate of The Hobbit's Middle Earth
When I was at University (Galway, West of Ireland) we used to get a kick out of finding Tolkien's names on old examination papers - apparently he often visited as an External Examiner in Old English during the 1940s and 1950s. That was when Lord of the Rings became a runaway success, late 1960s. I remember the Profesor of Geology had a theory that some of the topography of the edges Mordor was inspired by the barren Connemara mountains and bogs. I suppose the climate blows that one way, but at least visually ... ??
 Moderator Response:
[RH] Reduced image size.
-
Yvan Dutil at 01:08 AM on 18 June 2015The latest global temperature data are breaking records
@Tristan Actually, the climatic system is chaotic. You do expect such jump from one attractor to another. However, this does not invalidate the law of thermodynamics.
Moderator Response:[PS] Please take this to here. Read both tabs.
-
Tom Dayton at 23:39 PM on 17 June 2015What you need to know about the NOAA global warming faux pause paper
mwsmith12, the researchers' adjustments removed the systematic differences between ship-based measurements and buoy measurements. The effect on the temperature trend over time is the same regardless of whether you change the buoy measurements to make them consistent with the ship measurements, or change the ship measurements to make them consistent with the buoy measurements. That's because for the purpose of determining temperature trend, the absolute temperatures are irrelevant; only the relative temperatures matter.
-
topal at 22:23 PM on 17 June 2015The latest global temperature data are breaking records
KR: "You know, it's really hard to tell exactly what Tisdale is arguing at any one time. He tends to write these spews of text and meaningless graphs going on and on for pages at a time..."
Everybody can reproduce these graphs from readily avalable data series; the sources are clearly cited. Now tell us what's wrong with these graphs?
-
CBDunkerson at 21:59 PM on 17 June 2015New research suggests global warming is accelerating
bjchip: "Considering all the short-term factors identified by the scientific community that acted to slow the rate of global warming over the past two decades (volcanoes, ocean heat uptake, solar decreases, predominance of La Niñas, etc.) it is likely the temperature increase would have accelerated in comparison to the late 20th Century increases."
Basically, if the surface warming trend has continued to rise at the same rate for the past ~50 years, but the various 'internal variability' factors listed in the quotation above have all been 'applying downward pressure' on the trend for the past ~17 years, then global warming (i.e. the enhanced greenhouse effect due to human greenhouse gas emissions) must have accelerated over that time period to counteract those other factors and keep the trend steady.
-
mwsmith12 at 21:45 PM on 17 June 2015What you need to know about the NOAA global warming faux pause paper
Why did they decide that ship-based measurements are more accurate than buoy measurements? I assume the buoy system was thoroughly tested, but when the measurements were .12C colder than ship-based measurements, they chose to correct the buoy measurements. How did they decide that the buoys are wrong?
-
bjchip at 18:21 PM on 17 June 2015New research suggests global warming is accelerating
OK... the title says there is a suggestion of acceleration. I've read through here and the Guardian link, and all I see is
"The end result is that the temperature trends over the past 17 or so years has continued to increase with no halt. In fact, it has increased at approximately the same rate as it had for the prior five decades."
Is there somewhere else that it says accelerating?
I think it is/will be doing just that, but I don't think I see it here. I reserve the right to be wrong, but... ?
-
One Planet Only Forever at 14:56 PM on 17 June 2015The latest global temperature data are breaking records
mancan18,
I agree that a 30 year period is a more valid way of monitoring climate change. However, it is not necessary to compare a 30 year period with the previous 30 year period. The contrarians would have a field day with that. They would say we should wait for another 30 years of data to be sure. And 30 years from now they would say they are starting to be convinced but want to see another 30 years of data just to be sure.
A better application of the 30-year principle would be to report the trend of the 30-year average. A new 30-year average value can be calculated when every new month of data is available. And the 30 year average of global average surface temperature has not leveled off or shifted to a hiatus. And the 30 year average of arctic sea ice has not recently 'recovered' either.
Using the SkS Temperature Trend Calculator with the Moving Average value at 360 months shows a nice continuing to rise line. And the 30-year average is currently rising at about 0.17 C per decade.
Of course I anticipate there would be criticisms from the usual suspects that this is just a trick to try to hide the decline. But it may help others better understand what is going on.
The Decadal comparison (1981-1990; 1991-2000; 2001-2010) has also helped show that warming has continued but it still leads to a claim that we need to wait until 2020 to know if the hiatus was just another of the many temporary leveling off steps on the stair/escalator, then 2030 just to be more certain, then 2040 to really be sure ...
-
Daniel Bailey at 09:17 AM on 17 June 2015Mars is warming
A good discussion of Venus' greenhouse effect is here, by Chris Colose.
-
mancan18 at 08:18 AM on 17 June 2015The latest global temperature data are breaking records
The comments that accompany this article just demonstrate the frustration with the AGW CC debate of contrarians versus advocates. There has been an esoteric distracting discussion about, is warming an escalator or a staircase when it is the trend line that is important, as KR@32 highlights with the Arctic Ice record. It is the signal in the noise that is important. Also, it is the 30 years that WMO uses to define a climate period that is important. Not some year to year and decadal length analysis. Not has it slowed down because some peak year is compared against some trough year during the past decade. It is the regression analysis over the last 30 years compared to the previous 30 years, comared to the previous 30 years before that, and so on and so on that is important. This is after all a discussion about climate, not about extreme weather events. There has been nothing that a contarian has said that changes the basic fundamental scientific tenet that CO2 is a greenhouse gas, that CO2 is increasing and because it is there will be warming. Also, there are many lines of evidence that indicate that this basic scientific fact is in fact is true and is actually happening. So where is the surprise in this article. There should be warming and there is. What would be a surprise is that there is no longer warming and it is reversing as the contrarians are trying to argue. To imply that the planet will somehow cool down while greenhouse gases are increasing at the rates they are, is a bit like saying that the Earth will magically reverse the direction of it's orbital motion or direction of rotation at the behest of the hand of God. The only argument relevant is about how much warming will occur due to this and the predicted rise in greenhouse gases, and on the evidence so far over the last century, it would seem that Tindale got it about right.
-
scaddenp at 07:27 AM on 17 June 2015Mars is warming
Well Venus is hardly an "analog". It is often used as an example of a "runaway greenhouse effect" - positive feedback boiling oceans and then remaining too hot for condensing of any GH gases. Note that scientific opinion so far is that there is no chance of this happening here due to anthropomorphic activities.
-
scaddenp at 07:17 AM on 17 June 2015Climate, Politics, and Religion
If Christianity is just your tribe, the cross your totem, then you dont so much follow Jesus as just conform to the norms of your community. On the other hand, there are serious thinkers among evangelicals who place climate change within a wider context. eg Eugene Petersen, Peter Harris. For some of them, climate disasters are God's punishment for sin alright. But not sexual sin which seems to dominate conservative (as opposed to bibical) thinking; but the sin of greed and failing to care for the poor and vunerable - a very biblical theme.
-
Tristan at 05:52 AM on 17 June 2015The latest global temperature data are breaking records
The 'mysterious step-change' is an idea JoNova has promoted before. The notion being that something strange happened in 1998. In her world, temperatures are slowly rising, but there was an inexplicable jump in temps at that point. And because 'we don't know what happened' then it means 'we need more research' and we shouldn't act until we know what caused this mysterious behaviour. In her mind, it's lucky for everyone that eminent scientists like Tisdale are on the case, trying to puzzle out this phenomenon.
-
PhilippeChantreau at 05:40 AM on 17 June 2015The latest global temperature data are breaking records
KR, and team, talking about the Arctic sea ice excalator, has it been updated to 2012? As I recall, it was a record low, that went beyond the already exceptional 2007 but the sea ice graph shows 2007 as the lowest year.
-
Xulonn at 04:55 AM on 17 June 2015The latest global temperature data are breaking records
As a former solar heating system designer and sales person, I am acutely aware of the difference between temperture and heat, heat transfer functions, and the relationship of "delta-t" (temperature differential) to the rate of heat transfer in liquid-based systems. So I understand oceanic heating pretty well for a non-scientist.
Because the oceans are so vast, and have such a high heat capacity, the slow increase in temperature is not easily seen as significant. If you talk about zettajoules of heat added to the oceans every year, you will get a blank stare in response from most laypersons. And the oceans are where most of the heat from AGW is going.
I believe that until climate and weather disruptions are so severe that no one can ignore them, we will still have many contrarians and deniers. And then, it will likely be too late to prevent serious disruptions to human civilization.
The increasing impacts of the heat and temperature spike from each major El Niño event are likely to be obvious. The currently developing - possibly very strong - El Niño, coupled with Pope Francis' soon to be released encyclical, will likely cause some very interesting reactions and flailings in the denialist community. (This has already started.)
I am already getting angry and truly nasty replies to my e-mails from a couple of denialist friends here in my home in an expat comunity in the mountains of western Panama. I have decided to no longer send them articles about current climate issues, because the conflicts are so contentions, that it would jeopardize the friendships.
-
gregcharles at 04:46 AM on 17 June 2015Climate, Politics, and Religion
I'm blown away that the National Association of Evangelicals supports the basic science of climate change, and encourages action to counteract global warming. I would have thought evangelicals to be the most ideologically opposed to this. Well, good for them!
The link in the references was broken when I tried it, but I found the PDF in various other places. For example: here
-
dcpetterson at 04:23 AM on 17 June 2015The latest global temperature data are breaking records
Wol, I think you're right, it's an argument that should be made. However, denialists are clever in their capacity to disunderstand fact.I've actually had this conversation with some deniers.
Yes, water has a higher heat capacity than gas. That means it's a good heat sink, and can absorb all that nasty heat without causing problems. Heat is vanishing into the oceans, where it is hardly raising ocean temperatures at all. This is just more reason why we needn't do anything about global warming--all that heat is vanishing down the ocean hole.
Believe it or not, that is the argument I've heard. Of course, you and I know that heating the oceans, even a little bit, is dangerous--it affects sea level, and chemical balance, and ocean currents, and changes zones where various ocean creatures can live, and changes precipitation, and on and on with dozens of dangerous consequences. The problem is that these are at least as hard to explain as the truth about (say) tropospheric temperatures, whereas it is very easy for deniers to just keep repeating how very little oceans have actually warmed up.
-
dcpetterson at 03:53 AM on 17 June 2015Climate, Politics, and Religion
I think an important element here is missing.
Many of hte arguments presented here are just that--arguments. They are reasonable and rational and make a very good case. Yes, there is reason, but religious and conservative, to acknowledge and support both the science of climate change and what must be done to avoid catastrophe. Yes, anyone who thinks rationally about it must, of necessity, be convinced of the logic and reality we must deal with.
However, opposition and climate denialism is not rational, or it would already have vanised long ago. It would, in fact, have never appeared. As has been pointed out many times, conservatives (and even religious people) were not so opposed to this even only a few years ago. MCCain, Reagan, Thatcher--nearly everyone, insisted we must act. We now have the Pope saying so, and I doubt he will change many many minds.
The opposition to climate science is not rational, and it is not ideological, and it is not religious. It is partisan.
Yes, as Yail Bloor III points out, it is led by powerful monied forces that support the status quo--ironically, those same forces stand to make fortunes by investing in new energy technologies. They only do not so invest, and the people they can con in to supporting them give their support, because of partisan power games. This has become a shibboleth of partisan purity, more than ideology or religion.
No amount of reasoning or of pleas to moral imperatives will be persusasive. It will take a partisan icon to sudenly reverse course. It must be someone already in a position of power who has campaigned on a platform of science denialism, because anyone who claims to belong to the party that has embraced denialism but is not a denier will be drummed out. Political (as constrasted with ideological) conservatives have not had problems with sudden policy reversals in the last decade or so. It will take a political leader to simply start talking about how the job creators can made megabucks by making America (or whatever country) energy independent just to spite them durn foreigners--and a big corporation must lead the way so it isn't the gubbermint telling us what to do.
-
Wol at 03:53 AM on 17 June 2015The latest global temperature data are breaking records
Isn't it time to place ocean heat content at the forefront of public (as opposed to specialist) discussion?
Most people are familiar with the fact that water has a much higher heat capacity than gases. Since the measurement and analysis of atmospheric temperature is so complex and in practice open to denialist arguments (false, but enabling doubt to be introduced), it seems to me that ocean temperatures would provide more "clout" in the media.
-
WheelsOC at 03:39 AM on 17 June 2015Climate, Politics, and Religion
I'm with Dr. Hayhoe regarding the religion angle to denialism here: it's being used as a convenient tissue to paper over the real objections which are entirely political in origin.
-
dcpetterson at 02:22 AM on 17 June 2015The latest global temperature data are breaking records
Yes, that one's excellent. And yes, denialists are now claiming there is yet another "recovery". They are claiming, in fact, that Arctic sea ice is back to where it was a decade ago, as if the last ten years didn't happen.
-
KR at 02:18 AM on 17 June 2015The latest global temperature data are breaking records
Nah, I think the Escalator graphic is clear enough - folks like Sean are just trying rhetorical nonsense in an attempt to discredit the graphics very clear communication. Because it is so very effective.
If you want an example with denial claims highlighed at each step, though, look at the Arctic Ice Escalator graphic:

-
dcpetterson at 02:08 AM on 17 June 2015The latest global temperature data are breaking records
Leto,
I like your suggestion that the escalator gif can perhaps be improved by making each of the "skeptic" steps in turn cause the previous one(s) to vanish--perhaps accompanied by a tag at each new step that says, "See? No warming HERE!" while each recently-vanished one is labelled, "That earlier step wasn't lower!"
The essence, of course, as this thread underlines, is that we're at record high temperatures, as part of a well-documented upward trend, despite denialist noise. -
KR at 01:55 AM on 17 June 2015The latest global temperature data are breaking records
dcpetterson - You know, it's really hard to tell exactly what Tisdale is arguing at any one time. He tends to write these spews of text and meaningless graphs going on and on for pages at a time...
That said, he appears to feel that it is indeed warming (although I seem to recall him engaging in conspiracy theories about temperature adjustments and how much), but that it's entirely due to recent ENSO variations rather than any anthropogenic influences. Despite the fact that warming atmosphere and warming oceans make an ENSO-only cause thermodynamically impossible...
You get similar arguments from the cycle enthusiasts (think astrology and cosmic influences, or just natural climate Mysterious Unknown Cycles/MUCs), all of whom acknowledge some degree of climate change but claim no human influence. Nicola Scafetta is a prime example of the former, Fred Singer among others has pushed the latter. All examples of the climate denial meme 'it's not us'.
Prev 565 566 567 568 569 570 571 572 573 574 575 576 577 578 579 580 Next


