


 Arguments


Recent Comments
Prev 584 585 586 587 588 589 590 591 592 593 594 595 596 597 598 599 Next
Comments 29551 to 29600:
-
Philip Shehan at 20:45 PM on 3 May 2015The climate 'hiatus' doesn’t take the heat off global warming
England's paper has (predictably ) been portrayed on Andrew Bolt's blog as a backdown requirng an apology
"Warmists who denied the pause now claim to explain it"
While I understand that the paper is a useful in explaining what the consequences are if there is indeed a pause, that is a long way from being established.
Gistemp data since 2000 from the Skeptical Science trend callculator::
Trend: 0.09 ±0.13 °C/decade
For “two decades” it is
Trend: 0.12 ±0.09 °C/decade
So there is a warming trend, with a headline value lower than that for the statistically significant warming trend from 1979:
Trend: 0.16 ±0.04 °C/decade
But the error margins for the period since 2000 mean that for the short period there is a 95% chance that the trend is as much as warming 0.22 °C/decade or a cooling trend of as much as -0.04 °C/decade.
In fact both the shorter periods support the null hypothesis.
That is, they are statistically not distinguishable from the warming trend beginning in 1979.
null hypothesis
noun
1.(in a statistical test) the hypothesis that there is no significant difference between specified populations, any observed difference being due to sampling or experimental error.Moderator Response:[RH] Activated link to fix page formatting.
-
Rob Painting at 20:43 PM on 3 May 2015Models are unreliable
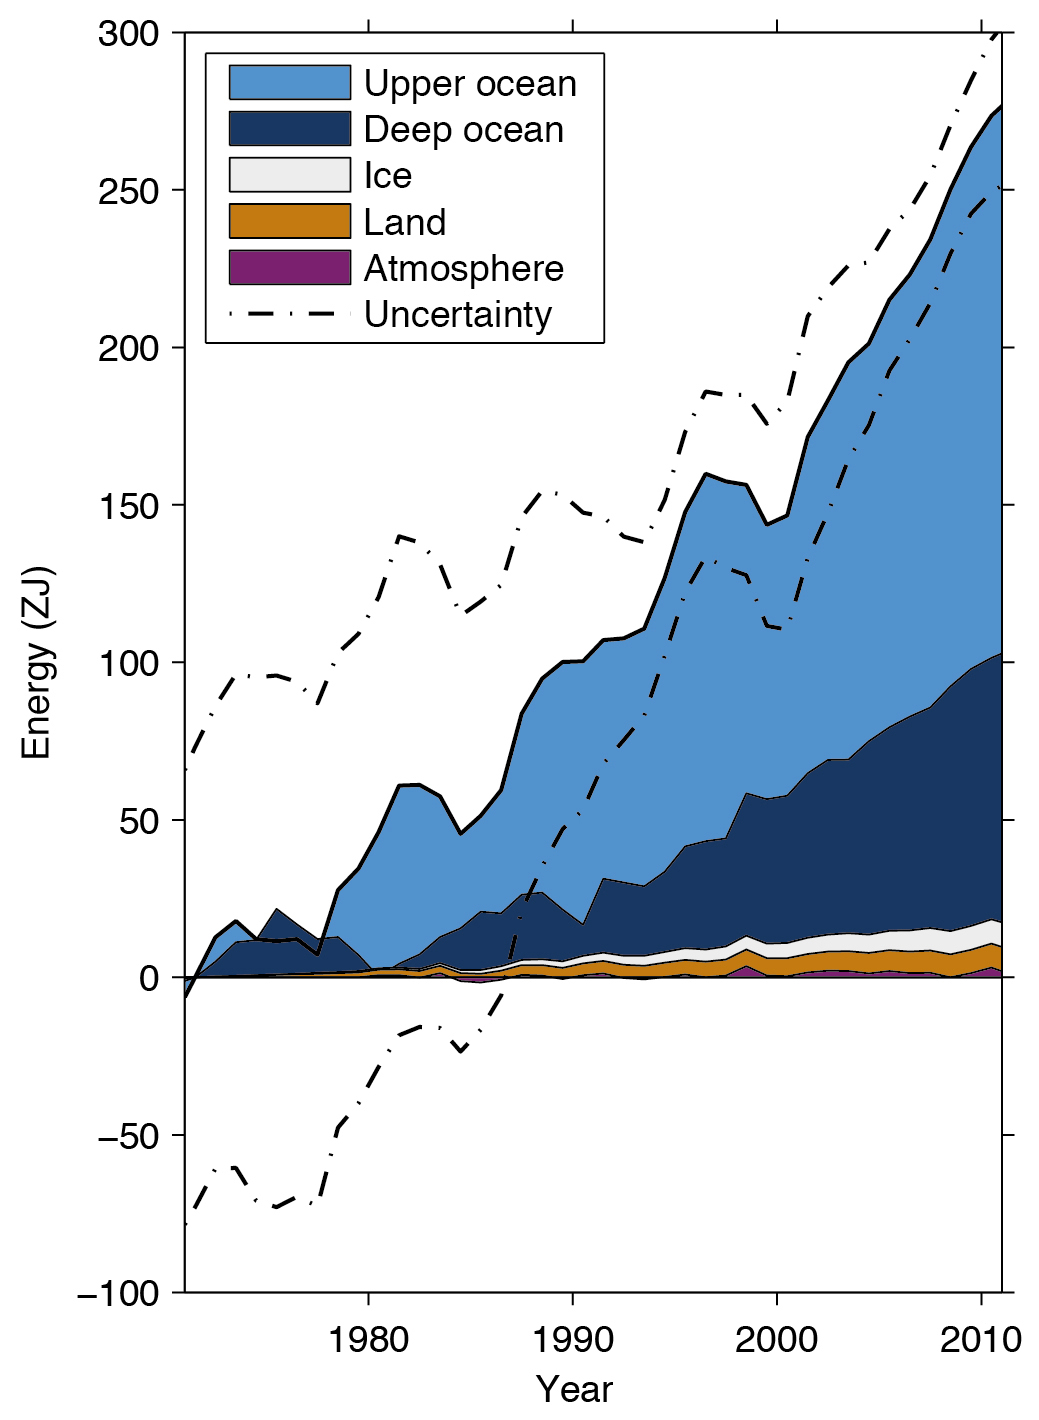
And the climate model vs observation (black solid line) of ocean heat content from the IPCC AR5 is shown here:
-
Rob Painting at 20:41 PM on 3 May 2015Models are unreliable
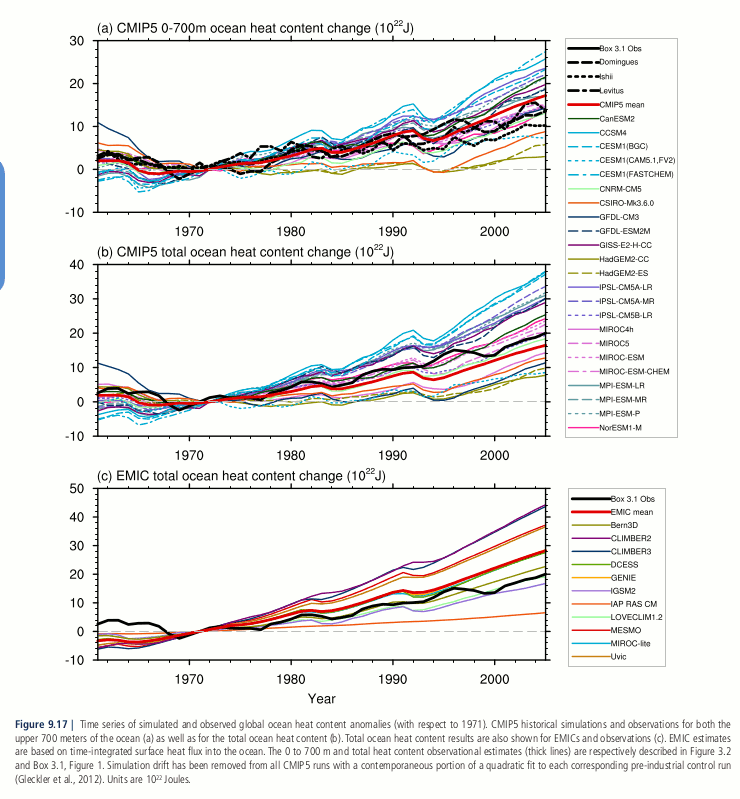
The uncertainties in Earth's total heat content data, 93% of which is ocean heat content, is shown in the image from the IPCC AR5 below:
-
MA Rodger at 19:27 PM on 3 May 2015Models are unreliable
Mal Adapted @870.
You write "I'm not a biblical scholar, but I don't recall seeing any estimates of error margins in that book..."
My understanding of Leviticus is that it is entirely about defining error and what happens when any such error occurs. Within an approach to error such as laid out in Leviticus, the concept of there being 'error margins' disappears within a binary reality: either there is error or there is not error :-) -
MA Rodger at 19:24 PM on 3 May 2015Models are unreliable
Klapper @879.
There is plenty of advice on where you can up-load images that is easily found on-line, for instance here. Many require nothing more than an e-mail, a user name & a password. For instance (and I mention it as an exemplar rather than recommend it) this website allowed me to upload an image in less that a minute. I would have displayed the resulting image in-thread but the image to hand that I up-loaded is political in nature.
-
bozzza at 09:57 AM on 3 May 2015Overlooked evidence - global warming may proceed faster than expected
Carbon in soils is another thing that seems as poorly understood as cloud feedback.
-
Peter Lloyd at 05:34 AM on 3 May 2015Overlooked evidence - global warming may proceed faster than expected
It is good to raise this issue of single study syndrome because far too many grand conclusions are drawn from just one new piece of evidence or from yet one more model.
It also highlights the point that there is no clear conclusion of the individual, let alone cumulative, effects of both negative and positive feedback mechanisms and how they offset each other.
It's also good to see a recognition of how the impact of clouds is so poorly undertood and yet potentially significant
It can't be said too often that new pieces of work that authors and commentators may exaggerate the significance of for obvious reasons, are frequently challenged by later pieces of work but that challenge is not always examined and recorded.
Keep on being sceptical might be a good mantra
-
jja at 03:49 AM on 3 May 20152015 SkS Weekly News Roundup #18B
I have decided not to use the Luntz' term "climate change" except to describe global warming related effects. The cause is Global Warming. The effect is climate change.
Why anyone would decide to go along with a denialist talking point is beyond me.Moderator Response:[JH] Scientists had used the term "climate change" long before Luntz decided it would be preferrable to "global warming" for political communications purposes. The term "climate change" is not a "denialist talking point."
-
One Planet Only Forever at 02:06 AM on 3 May 20152015 SkS Weekly News Roundup #18B
This New York Times article refers to a recent study and report led by Erich M. Fischer evaluating the increased probabilities of extreme weather events for different levels of increase of global average surface temperature.
-
PhilippeChantreau at 01:10 AM on 3 May 2015Inoculating against science denial
Feel free Tristan. Rob, vaccines are mentioned at length in the OP. Although it has to do more specifically with the false link to autism, and it is given as an illustration for the ideas developped in the post, I'm not sure it's fair to expect the thread to be free of comments about a significant aspect of the OP. I will nonetheless respect your request, despite my intention of further investigating the claim that measles dropped to insignificance because of sanitation, a claim of which I am highly skeptical. Thank you for allowing as much as was said.
-
Tristan at 17:11 PM on 2 May 2015Inoculating against science denial
Philippe, with your permission, I'd like to quote that in full on my FB timeline (although I'll remove the references to the above poster).
Moderator Response:[Rob P] No more about vaccines thanks. Any further comments will result in deletion.
-
PhilippeChantreau at 16:18 PM on 2 May 2015Inoculating against science denial
Really? Why should I do your work?
In 1966, the year I was born, a massive campaign of containment and eradication was launched in Central and West Africa against smallpox. In 4 years, the disease was essentially eradicated, before there was any chance to improve infrastructure and sanitation in any significant way. Eradicated in 4 years. One does not realize what a feat that was in these spoiled, worry free days of the 21st century. As of the mid-2000s, the WHO determined that the Republic of the Congo (Congo-Brazza) still had only 0-25% of its population using improved sanitation, yet the disease was eradicated there as well as in other countries part of the campaign. Other countries aren't that much better on the sanitation side, 40 years after the campaign. Some other countries, such as Gabon, have a rather small population, which makes access to sanitation easier.
I still bear on my shoulder the mark of the smallpox vaccine received in Brazzaville in the early 70s. I'm proud of it. In the former Zaire, smallpox eradication took all but 41 months, despite tremendous challenges in infrastructure and, you guessed it, sanitation. By an ironic and cruel reversal of circumstances, polio, eradicated as well as smallpox, is now on the rise in RDC because of imported cases. Perhaps some of the westerner fruitcakes who don't "believe" in vaccinations, who knows?
http://www.who.int/water_sanitation_health/monitoring/africasan.pdf
http://www.ncbi.nlm.nih.gov/pubmed/22188930
Interestingly, in the Congo Brazza, smallpox vaccination conferred also some immunity to monkey pox, which is now on the rise because of the end of massive immunization campaigns. The risk of developing the disease is 5 times greater for non immunized subjects:
http://www.pnas.org/content/107/37/16262.full
I'm done wasting my time with you, it is obvious that you are clueless, if you were not, you would already about all this. The sincerity you claim obviously does not apply to pet theories of yours. What we really need in this world is a vaccine against Dunning-Kruger.
Moderator Response:KC: ad-hom snipped.
-
Straight Talkin at 14:56 PM on 2 May 2015Inoculating against science denial
Just to expand a bit. Some years ago I was in almost convinced by the climate contrarians that we weren't causing the problem. Then I found skeptical science and it systematically demolished the climate deniers arguments. So I understand that arguments can sound convincing even when they are not really based on a whole picture scientific analysis. I always seek to get to the bottom line. I am not a conspiracy theorist, nor am I naive enough to not think that vested intersts do sometimes win out in corrupting situations, and have the capacity to have a corrupting influence on the scientific community and society generally. As the old quote goes 'Eternal vigilance is the price of freedom'
-
Straight Talkin at 14:39 PM on 2 May 2015Inoculating against science denial
Philippe Chantreau, You misunterstood my point about scurvy. I know that nutrition i.e. Vitamin C erradicated deaths from scurvy. The point I was makling is that long before vaccinations for measles were introduced the reductions of deaths from measles tracked perfectly with the reductions in deaths from scurvy as nutrition improved, to the point of insignificance.
My point regarding consensus is that although it is always worth taking into account, it should never be placed on a holy pedastal.
Could you direct me to research that demonstrates you statement 'It is interesting to note that diseases that lend themselves to immunization regress enormously in these countries when people are immunized, even in the absence of significant progress in sanitation.' ?
I am always willing to change my viewpoint based on new and convincing information. -
PhilippeChantreau at 14:23 PM on 2 May 2015Inoculating against science denial
Well I guess, since this is hinted at in the OP, it is on topic. It is interesting to see how Straightalkin formed an opinion about Measles by linking with scurvy when the 2 diseases have totally different pathophysiologies, and can truly not be comapared.
-
PluviAL at 14:16 PM on 2 May 2015Overlooked evidence - global warming may proceed faster than expected
This is great, evidence is clearer each day, and denyers one less rock to hide under.
But I have a question: Suppose there is a way to precipitate out an Amazon's flow from the air continuously. This means that the latent heat would concetrate higher in the atmosphere where it radiates into space faster with the 4th power of temperture K.
Would this not reduce the problem? We still have the CO2 in the atmosphere, but we systematically reduce vapor content. Does this reduce the feedback from clouds? Or does it not help because then we have less short wave radiation reflected by less cloud cover, but still have CO2 reflection of low wave radiation?
I was under the impression that low level clouds reflect more short wave solar energy, but higher level clouds refelct more long wave heat back to earth. That issue seems to be ingnored in this paper.
-
PhilippeChantreau at 14:16 PM on 2 May 2015Inoculating against science denial
Straight talkin, you're not being any more convincing. No amount of sanitation can save one from scurvy, only vitamin C from fresh fruit and vegetables will do that. You could at least bother to do a minimum amount of research on the disease you pick as a comparison. It is as if you don't know anything at all about the subject
About the consensus: nobody at SkS attempts to convince anyone to "believe" in climate science findings because 97% of relevant scientists do too. Deniers are touting the false idea that there is significant disagreement in the scientific community about climate change while, in fact, there isn't. That is what the consensus is about. The consensus exists because there is a consensus in the results of the research, just like there is, as a consequence, in the opinions of the researchers.
The scientific evidence about immunizations is every bit as compelling as it is about climate, and that is why there is also a consensus among relevant scientists about the benefits of immunizations. You cited countries where "sanitation" is lacking. It is interesting to note that diseases that lend themselves to immunization regress enormously in these countries when people are immunized, even in the absence of significant progress in sanitation. I expect now that this is off-topic enough that moderation is going to have no more patience for it and signal to us that rants about immunizations are off-topic and will be deleted.
-
Klapper at 14:07 PM on 2 May 2015Models are unreliable
@Tom Curtis #345:
In case you missed my last post directed at you on the other thread, I'd like you to expand on your reasoning for adjusting net CMIP5 TOA energy input forecasting based on "model drift".
-
Straight Talkin at 13:59 PM on 2 May 2015Inoculating against science denial
I think you, and the consensus for that matter, are missing the point. I don't agree with the science of human cased climate change because of the consensus. I agree because the science is compelling. All human beings, including scientists, can get into silo thinking and accepted norms. Stop trying to convince everyone that they should believe because 97% consensus of scientists in the field. Outline the scientific reasoning in as clear and simple terms as possible. Educate people effectively. Saying something is fiction based does not make it so. With in the context that they are measured I am sure vaccinations are effective. The real point is how many people were dying per population number. All of them were already very low and dininishing, and had been for decades. The deaths from scurvy tracks perfectly with the death from measles. Vaccinations did not save us from scurvy. The information, IMHO, clearly demonstrate that improved sanitation and nutrition were the key drivers in reducing, and almost completely removing, the danger from these deseases. Besides focussing on the wrong measures, the graphs you quote are classic cherry picking examples.
-
Klapper at 13:53 PM on 2 May 2015Models are unreliable
@Tom Curtis #877:
We should stay on topic and deal with the numbers. Do you have a suggestion of a linkable place I can post my graph?
-
Tom Curtis at 13:38 PM on 2 May 2015Models are unreliable
Klapper, is that really how you want to defend your persistent use of inappropriate comparisons? I take that as an admission that it is indefensible (which I guess I knew anyway).
-
Tom Curtis at 13:36 PM on 2 May 2015Climate sensitivity is low
bozza @354, even emissions at 10% of current rates would be sufficient to keep on increaseing atmospheric CO2 concentrations, and ergo prevent net ocean outgassing of CO2. The rate of increase of atmospheric CO2 would, however, slow to a standstill in that case - and slow substantially if we only halve emissions. Having said that, the proportion of emissions retained in the atmosphere would not necessarilly remain at the current 55%, and would decrease over time with increasing SST (assuming constant emissions). It follows that while 2100 concentration would probably be below 580 ppmv, I cannot tell you how far. The nearest I can do is show you the RCP 4.5 figures (second graph) as the nearest approximation (first graph).
-
Klapper at 13:32 PM on 2 May 2015Models are unreliable
@Tom Curtis #872:
"Political, off-topic or ad hominem comments will be deleted" (Comments policy)
-
Klapper at 13:30 PM on 2 May 2015Models are unreliable
@KR #871:
"...You've limited yourself to such a small dataset that frankly I cannot take any of your arguments seriously.."
Although I'm skeptical of the data quality before this century for the deep ocean, I downloaded the pentadal OHC data and ran a 5 year running trend to convert ZJ to W/m^2 heat input on a global area basis. The results are as follows (TOA CMIP5 ensemble forcing vs NODC Pentadal heat content change, both 5 year periods):
1959 to 2000 - 0.23 W/m^2 from OHC, 0.49 W/m^2 from model forcing
2000 to 2010 - 0.51 W/m^2 from OHC, 0.95 W/m^2 from model forcing
While delta OHC is not global heat content change, it is the great majority of it. Two conclusions seem appropriate:
1. The better the observational data quality, the bigger the discrepancy between model hind/forecasts and,
2. The models run hot.
I can post the graph here if someone lets me know where I might post to the internet so I have a URL link.
-
Tom Curtis at 13:24 PM on 2 May 2015Climate sensitivity is low
Klapper @348:
"You're ignoring my comment above in which I clearly stated the 0.5 W/m2 was the difference between OHC and the TOA model output."
First, you were comparing the difference between model TOA energy imbalance and observed 0-2000 meter OHC.
Second, absolutely right I was ignoring that. Just because you want to compare the model TOA energy imbalance with approximately 80% of the observed energy imbalance (ie, the 0-2000 meter rate of change in OHC) in no way makes that justified. Nor does it justify you comparing model 2000-2015 model TOA energy imbalance with 2005-2010 TOA energy imbalance as you did @325. You seem to have a penchant for strengthening your case by using inappropriate comparisons. However, as you insist that I not use the appropriate comparison because you originally used the inappropriate comparison, I will notice it and call it what it is - ie, fraudulent argument.
-
bozzza at 12:45 PM on 2 May 2015Models are unreliable
..never fear, Instagram is here![starts worry mode]....
-
Klapper at 12:44 PM on 2 May 2015Models are unreliable
@scaddenp #866:
"...But if you disagree, then you really don't have sufficient data to argue about model fidelity.."
I do disagree. Go to the NODC website. You can find a ocean heat data distribution mapping tool you can customize by period. For example, display 1500 metres depth for the period 1968 to 1972. Count the dots in a polygon formed by New Zealand, Ecuador, the Solomon Islands and the Antarctic Penisula. It's not hard to do. Keep in mind each black dot represents one sample, i.e. May 15, 1969.
You have maybe 4 or 5 single samples in this 5 year period between the equator and the Antarctic coast and 90 degrees and 150 degrees longitude west. This represents a huge area with essentially no data in a recent 5 year period.
For a shocking contrast, now retrieve the same depth for 1 year (2014) and try and estimate how many samples were retrieved.
-
Tom Curtis at 11:53 AM on 2 May 2015Models are unreliable
Rob Honeycutt @868:
"And the data we have a decade from now will be better than the data we have today."
With conservative governments in Australia and Canada, and a conservative congress in the US being so sure that the science is against them, that they are doing all they can to cut science budgets (particularly for research on global warming) I would not be sure of this.
-
bozzza at 11:30 AM on 2 May 2015Climate sensitivity is low
Iff we were to cut CO2 emissions in half tomorrow would we still go past 580ppm by 2100 due to possible outgassing of the ocean?
-
KR at 10:21 AM on 2 May 2015Models are unreliable
Klapper - "...I want the best data"
As do we all. And the best data for the last half of the 20th century, while subject to higher uncertainties that current measurements, is worth attention.
Again, differences in the 5-10 (and, grudgingly on your part, perhaps 15) year periods you are looking at are short enough to be entirely unforced variation - with recent work on 21st century volcanic activity (not included in the CMIP5 forcings) that has direct implications for the TOA balance also worth considering. You've limited yourself to such a small dataset that frankly I cannot take any of your arguments seriously.
-
Tristan at 09:42 AM on 2 May 2015The climate 'hiatus' doesn’t take the heat off global warming
Thanks TC, exactly what I was looking for!
Hope you're feeling better. -
Mal Adapted at 09:36 AM on 2 May 2015Models are unreliable
scaddenp: "If you believe the Leviticus estimates of error margins on OHC to be incorrect"
Hmm, I'm not a biblical scholar, but I don't recall seeing any estimates of error margins in that book...
-
Rob Honeycutt at 09:14 AM on 2 May 2015Models are unreliable
Klapper @868... Absolutely. And the data we have a decade from now will be better than the data we have today. Today's data certainly doesn't invalidate past data nor would better systems in the future mean current data is bad. The data we have is just what it is at any given point in time. It's always going to be imperfect. Data is imperfect. Models are imperfect.
But again, this is why models are used to constrain those uncertainties. That's "Trenberth's tragedy." Our current systems can't fully account for all the heat in the climate system. That doesn't mean it's not there. That just means that our systems are inadequate.
What is abundantly clear, though, is that adding 4W/m^2 to the climate system is going to warm the planet in a significant and potentially calamatous way.
-
Klapper at 07:44 AM on 2 May 2015Models are unreliable
@KR #867:
"...a combination of poor statistics and impossible expectations about 'perfect' data..."
I don't want "perfect data", I want the best data. I think all posters would agree that thanks to Aqua/Terra/GRACE/ARGO etc. we have the much better data available in the 20th century than previously.
-
KR at 06:46 AM on 2 May 2015Models are unreliable
From Klapper - "I've looked at the quarterly/annual sampling maps for pre-Argo at various depths..."
Well, there are good reasons for NOAA to display 0-2000 data as pentadal (5-year) averages:

What Klapper appears to be expressing with his short term trends and dismissal of earlier OHC data is a combination of poor statistics and impossible expectations about 'perfect' data.
-
citizenschallenge at 06:43 AM on 2 May 2015Heartland takes climate foolishness to a Biblical level
OPOF writes: "It is important to not refer to the Heartland Institute as a 'religion based group'."
True enough they are a libertarian organization who count's the childishness of Ayn Rand as a profound Truth - their founders and members have roots in the Reaganomics doctrine that endless growth is possible, "too much is never enough" and that "greed is good".
But, challenge them on their talking points and it's nothing but silence.
fyi - Sunday, April 26, 2015
#11 Questions for Heartland's Burnett, re Dr. Mann and more -
The CC/Steele Landscapesandcycles Debate
http://whatsupwiththatwatts.blogspot.com/2015/04/11heartland-drmann-ccsteeledebate.html
-
scaddenp at 06:22 AM on 2 May 2015Models are unreliable
Klapper, at the moment, your dismissal of pre-Argo data seems to be an argument from personal incredulity. If you believe the Leviticus estimates of error margins on OHC to be incorrect, then can you please show us where you think the fault in their working is?
-
KR at 05:47 AM on 2 May 2015Climate sensitivity is low
Klapper - I've responded on the appropriate thread for this conversation.
-
KR at 05:47 AM on 2 May 2015Models are unreliable
Klapper - Levitus et al seems to think there's sufficient data for estimating OHC, as does NOAA. But if you disagree, then you really don't have sufficient data to argue about model fidelity.
-
Klapper at 05:46 AM on 2 May 2015Climate sensitivity is low
@Tom Curtis #345:
"...the modelled TOA energy imbalance lies within error (actually, withing 1.2 SDs) of the observed value."
It generally always does for these model-observation discrepancies. However, if the model-observation discrepancies are always on the hot side that is more than an "emotive" argument don't you think?
-
Klapper at 05:37 AM on 2 May 2015Climate sensitivity is low
@Tom Curtis #345:
"...the modelled TOA energy imbalance lies within error (actually, withing 1.2 SDs) of the observed value."
It generally always does for these model-observation discrepancies, but then again the models are always on the hot side aren't they?
-
Klapper at 05:35 AM on 2 May 2015Climate sensitivity is low
@KR #347:
"...We have OHC data of reasonable quality back to the 1960s"
I've looked at the quarterly/annual sampling maps for pre-Argo at various depths and I wouldn't agree that's true for 0-700 m depth and certainly not true for 0-2000 m. There's a reason Lyman & Johnson 2014 (and other stuides) don't calculate heat changes prior to 2004 for depths greater than 700 m; they are not very meaningful.
-
Klapper at 05:30 AM on 2 May 2015Climate sensitivity is low
@Tom Curtis #345:
"...anomaly values being used as a correction for model drift."
Why don't you expand on what you think is going on here. I'm using the absolute numbers from the mean CMIP5 ensemble, which I think is the correct thing to do. What do you (and Smith et al) mean by "model drift"?
-
Klapper at 05:26 AM on 2 May 2015Climate sensitivity is low
@Tom Curtis #345:
"..So, even on your figures the discrepancy between mean model and mean observed TOA energy imbalance is substantially less than 0.5 W/m^2 (which as I said before, is a fiction)".
You're ignoring my comment above in which I clearly stated the 0.5 W/m2 was the difference between OHC and the TOA model output. Here's my 2 most succinct posts from the Guardian on the source of the 0.5 W/m2 number:
"All that being said, these studies would agree the heat gain in the measurable part of the ocean is in the range of 0.3 to 0.6 W/m2. If the best guess at ocean heat gain is 0.5W/m2, then where is the rest of the heat? Models show the imbalance at the top of the atmosphere through this period as being 1.0 W/m2. We know the atmosphere has limited heat capacity, and the troposphere hasn't shown significant warming since 2005 in any case. That leaves ice melting."
"However, heat gain by the oceans right now might be 0.5W/m2, which is only 1/2 of the projected TOA energy imbalance, so while the oceans are warming, and the atmosphere very weakly so, together they don't account for the model predicted 1.0 to 1.2 W/m2 TOA net energy input."
I concede in at least one post I used the OHC delta to TOA model as "shorthand" for the global energy delta to model TOA, but it's clear from my initial posts the source of the numbers. You're either not reading my full posts or you're deliberately ignoring the context.
-
KR at 05:17 AM on 2 May 2015Climate sensitivity is low
Might suggest to one and all that this conversation about model fidelity shift to the appropriate thread on climate models?
-
KR at 05:16 AM on 2 May 2015Climate sensitivity is low
Klapper - We have OHC data of reasonable quality back to the 1960s, as I noted here. What you are considering is far too short a period for statistical significance, hence too short to make broad statements about model fidelity. If you want to make any claims regarding the differences I would suggest using a sufficient amount of the available data.
You're arguing about short term unforced variations, not statistically significant long term climate trends, and your complaints about the XBT data don't change that fact.
-
Tom Curtis at 04:57 AM on 2 May 2015Climate sensitivity is low
Klapper @343:
"The 2000 to 2010 average TOA energy imbalance is +0.95W/m2."
1) I need to make a correction. I assumed that Smith et al presented a median value based on their use of a box plot. In their supplementary information, however, they describe the central value as a mean, and the "first quartile" and "third quartile" values as being minus and plus one standard deviation respectively, with whiskers showing the range. The values are given as 0.73 +/- 0.13 W/m^2 with a range from 0.43 - 0.97 W/m^2. These values are stated as being the anomaly values with respect to the preindustrial era - anomaly values being used as a correction for model drift.
2) As noted before, the difference between observations and models over this period in Smith et al is 0.11 W/m^2. Even using your uncorrected values, the difference between observed and modelled TOA energy imbalance from 2000-2010 is still only 0.33 W/m^2. The +/- 2 sigma range of the observed TOA energy imbalance is 0.06 to 1.18 W/m^2. So, even on your figures the discrepancy between mean model and mean observed TOA energy imbalance is substantially less than 0.5 W/m^2 (which as I said before, is a fiction). Further, you are making a case that the models are shown to be seriously flawed because, the modelled TOA energy imbalance lies within error (actually, withing 1.2 SDs) of the observed value. It may make a good emotive argument, but it is certainly not a scientific argument.
-
Klapper at 03:58 AM on 2 May 2015Climate sensitivity is low
@MA Rodger #341:
".. reducing your mismatch from the range 0.19-0.49 W/m2 to 0.06-0.36 W/m/2, considerably reduced from the originally stated 0.5 W/m2"
You're forgetting the originally stated comparison was to OHC, not global energy imbalance (although as noted OHC pretty much is the bulk of the energy imbalance). In any case, even reduced, the numbers support my hypothesis the models run too hot.
"..implies that the aerosol forcing is about -1.6 W/m2"
Circular logic but that's a topic for whole discussion on itself. I'll say no more.
"..would more recent models be expected now to conform to Hansen et al (2012)?"
I'm using the more recent models (CMIP5) and they don't conform to Hansen et al 2012 (still too hot). I'm tempted to go get the AR4 model ensemble and try that also, but for now I'm off to work.
-
Klapper at 03:49 AM on 2 May 2015Climate sensitivity is low
@Tom Curtis #340:
"..The IPCC uses just one model run per model in calculating multi-model means for a reason."
Yes very egalitarian of them. An argument could be made for using the other ensemble which says, the better resource supported models have more runs and are probably more realistic than the less resourced models. However, it doesn't make much difference, as the 2005 to 2010 average TOA imbalance changes from 0.92 to 0.90W/m2 with the one run per model ensemble.
"..What are your results for 2000-2010 for comparison with the Smith et al data?"
The 2000 to 2010 average TOA energy imbalance is +0.95W/m2.
".. rather than the multi-model median as do Smith et al?"
I would have to download all the models, a very tedious process, and create my own median; KNMI only options a mean in their ensemble exports.
-
Klapper at 03:39 AM on 2 May 2015Climate sensitivity is low
@KR #338:
"I don't think you can make any significant conclusions from such a short period of data".
The quality data for OHC only begin since the ARGO system reached a reasonable spatial density (say 2004 at the earliest). However I will look for some longer OHC/global heat gain data/estimates to match longer periods, say a 15 year period from 2000 to 2014 inclusive. The average for that period is a TOA energy imbalance of 0.98W/m2 from the CMIP5 ensemble (multi-runs per model) mean rcp4.5 scenario.
Prev 584 585 586 587 588 589 590 591 592 593 594 595 596 597 598 599 Next


