


 Arguments


Recent Comments
Prev 599 600 601 602 603 604 605 606 607 608 609 610 611 612 613 614 Next
Comments 30301 to 30350:
-
billthefrog at 20:40 PM on 2 April 2015Matt Ridley is wrong again on fossil fuels
As I was starting to articulate some thoughts on this thread, I was overtaken by a strange sense of déjà vu.
Checking the SkS archives threw up (tee hee) many references to Ridley, in particular a piece that Dana wrote in January of this year. Any reader unfamiliar with Ridley may find it profitable to peruse that posting in conjunction with this one.
Nothing has changed in the interim that would even remotely lead me to consider revising my comment (#3) on Dana's earlier thread.
cheers Bill F
-
Tristan at 19:44 PM on 2 April 2015Understanding adjustments to temperature data
FWIW I think a post specifically referencing the point Tom just made would be productive.
I've spent a lot of time in denierville and a regular assertion is 'You can't get temps/sea-level etc to 3 sig figures when instrumentation is barely accurate to the nearest degree. -
PhilippeChantreau at 16:11 PM on 2 April 2015Scientists link Arctic warming to intense summer heatwaves in the northern hemisphere
Perhaps others have not noticed watchdog, but I was amused to see how you went from an unsupported argument of Arctic climate, to side-stepping the very real and very objective notion of statistical significance to now shifting to global climate.
As for ice, it is really irrelevant how you want to measure it. You still can not pull together any evidence that the increase you trumpeted earlier exists. I see no point wasting any more time.
-
One Planet Only Forever at 14:50 PM on 2 April 2015Matt Ridley is wrong again on fossil fuels
Matt Ridley can be debunked just by addressing his opening salvo.
"To throw away these immense economic, environmental and moral benefits, you would have to have a very good reason. The one most often invoked today is that we are wrecking the planet’s climate. But are we?"
There is no moral justification for a few among a generation of humanity getting way with benefiting form activities that the rest of humanity will not be able to benefit from through the hundreds of millions of years this amazing planet will be habitable. And it is immoral for anyone to try to excuse a few in this generation benefiting as much as they can get away with through the fatally flawed economic system of profitability and popularity.
-
Tom Curtis at 13:48 PM on 2 April 2015Understanding adjustments to temperature data
Quick @40, suppose you have a single instrument with an accuracy of 0.1 C. Then for that station the best accuracy we can have is 0.1 C, and other factors may cause the error to be greater. However, if we want to determine the average temperature of 10 different sites, each using the same type of instrument, the error becomes the error of the average, ie, the square root of the additive sums of each error term, divided by the number of terms. For 10 sites, that turns out to be again 0.1 C. If we increase the number of sites to 100, the error margin, however, drops to 0.0316 (= ((0.1*100)^0.5)/100). With a thousand sites, it drops to 0.01. With 10 thousand sites it drops to 0.00316, and so on.
The USHCN has 1221 stations within the contiguous United States. The error on the simple average of that many stations assuming an instrumental error of 0.1 C is 0.009 C. The GHCN has around 2500 stations, yielding an accuracy for the simple average of 0.006 C. These figures are for the land only temperatures. On top of that there are thousands of SST measurements that go into the Global Mean Surface Temperature.
Clearly your denier's point is invalid. The quoted errors of the GMST are well above that which would be obtained from taking a simple mean. That extra is to account for other sources of error, the accounting of which has been detailed in peer reviewed papers.
-
bozzza at 13:37 PM on 2 April 2015Sea Level Rise is Spiking Sharply
@15, this question begs an equally pointed one : "How long actually is the delay between carbon emission and sea level rise?"
-
John Hartz at 13:35 PM on 2 April 2015Understanding adjustments to temperature data
Quick: If you have not already challenged your opponent to document all of his assertions, you should immediately do so.
-
Quick at 13:19 PM on 2 April 2015Understanding adjustments to temperature data
I tried to steer the guy here to Zeke Hausfather's guest post , but to no avail...
-
Quick at 13:15 PM on 2 April 2015Understanding adjustments to temperature data
Above post is by Stefan_Z in a Yahoo comments section
-
Quick at 13:12 PM on 2 April 2015Understanding adjustments to temperature data
Question: What specific instrumentation is used to measure global surface temps? ...and what percentage of all global temps are taken by NASA using the referenced sensors in the post below?
THe reason for asking is that I ran into a very belligerent and persistent denier who claims to work with a sensor that is very similar to the same that NASA uses and here are his claims in this post:
" NASA is on record stating that 2014 was the "hottest" on record since 1888. And 2014 was supposedly just 0.02 degrees C hotter than 2010 which is the next "hottest" year per NASA's dubious claim. Now, once again you stupid dunce! Platinum resistance temperature devices (P RTDs) are only accurate to +/- 0.1 degrees C from 0c to 150c, and +/- 0.15 degrees C from 0c to -30c per the IEC 60751 document. This is basic mathematical statistics your stupid head should have learned in high school. That is why when the lying director of the Goddard Institute of Space Science (GISS),(deleted text) Gavin Schmidt, is ON RECORD as stating that the claim of 2014 being the hottest was stated with just a 38% level of statistical certainty. I and others with a university level of mathematical education are not fooled by such a hokey statement, but Schmidt knowingly staked that claim so that gullible AGW drones like you would have something to eat up. It still amazes me that that there are buffoons like you that think anybody can derive a 0.02 C degree of precision from a device that is +/- 0.1 at best, not including the root mean sum squared addition value that the data acquisition electronics adds too it's error summation by about another one percent."
-
william5331 at 12:20 PM on 2 April 2015Global warming and drought are turning the Golden State brown
Perhaps they should start thinking about sea water greenhouses.
http://mtkass.blogspot.co.nz/2007/09/i-wish-id-thought-of-that-growing.html
-
william5331 at 12:16 PM on 2 April 2015Sea Level Rise is Spiking Sharply
Sgbostsford. A way of measuring the average height of a fluxuating sea is to use a stilling well. It is essentially a bunch of culverts with its joints sealed up and with a cement bottom which is sunk vertically near the sea. It is connected to the sea by a thin pipe and a depth measuring device is set on the platform on the top. For averaging the average of the first well, you can have a second stilling well off the first.
-
william5331 at 12:12 PM on 2 April 2015Sea Level Rise is Spiking Sharply
Ranyl
Possibly the greater effect as the Antarctic ice sheet melts will be the decrease in the sidways force of gravity, pulling the water toward Antarctic and causing sea level to rise around the world
-
bozzza at 11:53 AM on 2 April 2015Sea Level Rise is Spiking Sharply
The question is .. "..do we observe a regular doubling period?"
-
BC at 11:35 AM on 2 April 2015Sea Level Rise is Spiking Sharply
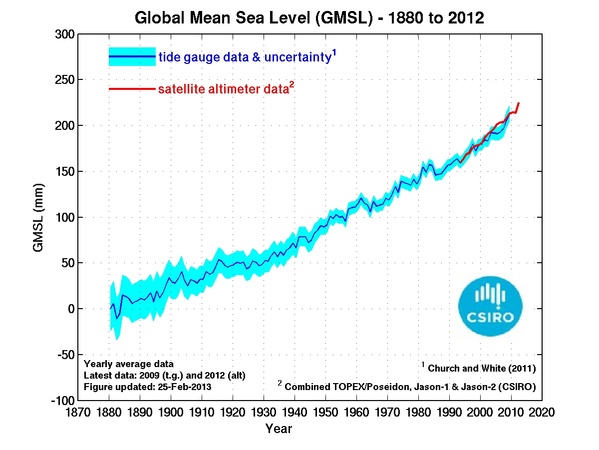
Interesting article thanks. I had noticed the increase on the AVISIO site but hadn't realised that reduced rainfall in the tropical basins was a significant cause. I had assumed it was warmer surface water expansion and/or more ice melting.
The sea level graphs are so smooth compared to the global temperature - there's no hiatus with slr. It's been relatively smooth but gradually curving further upwards since 1880 as shown on the CSIRO site below (go to the bottom of the page)
-
Tom Curtis at 09:54 AM on 2 April 2015Scientists link Arctic warming to intense summer heatwaves in the northern hemisphere
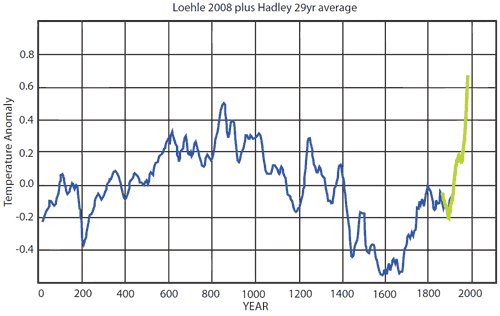
Watchdog @41, the reconstructions are temperature reconstructions. Not " litho-, hydro-,cryo-,atmo- and bio- sphere" reconstructions. There is no reason we should not have reasonably accurate reconstructions of GMST. As to updating, Loehle 2007 contained some outright blunders in processing (regardless of the merits of the data selection and methods). Loehle and McCulloch 2008 merely corrected those blunders. It is more in the nature of errata than a new paper. However, reconstructions have in general improved with time due to more proxy series becoming available, and improvements in mathematical techniques. That is the nature of science, which goes from knowing less to knowing more. When MBH 98 was first published, almost nothing was known about techniques of reconstruction, and few proxies were available. So of course later papers do better.
As regards the red data, it is the instrumental record from the group that uses the most data (ie, station records) and arguable the best mathematical methods (and certainly better than those used in HadCRUT4).
Finally, Greenland has not been green except for a few marginal areas for 100 thousand years (at least). Those marginal areas, in turn, only supported marginal cropping in the MWP, and support a higher level of agriculture now. If you mean to say that Greenland was green in the MWP, then it is green again already:

-
Tom Curtis at 09:38 AM on 2 April 2015Scientists link Arctic warming to intense summer heatwaves in the northern hemisphere
Rob Honeycutt @40, the crucial difference between your and my graphs is that I used BEST's annual values, whereas you used a rolling 29 year average. Due to a coincidence and the different baselines used (you used Loehle's, I used BESTs) that results in approximately the same final value but a very different seperation between the peak MWP value in the final value on the instrumental record.
From a pixel count, you show 0.17 C difference between that peak, and the final instrumental value. I show 0.33 C difference, and would have shown a 0.09 C difference had I used a 29 year average. In Standard deviations of the error for Loehle 2008, that is 1.25, 2.45 and 0.8 Standard Deviations respectively. In all cases the final instrumental value is greater than the peak MWP reconstructed temperature (contrary to Spencer's graph shown by Watchdog).
It is often assumed that we should show a 29 year rolling mean of the instrumental values to get a like for like comparison with Loehle's reconstruction, which uses a 29 year smooth of the proxy data for the reconstruction. I don't think that reasoning is correct. The primary reason is that increasing the number of proxies (or instruments) smooths the data series. For example, here is a global surface temperare record derived from just 60 long record rural stations compared to CRUTEM3:

The rural stations show far more year to year variation relative to the full data record. Loehle, of course, did not use 60 proxies but just 18. Therefore he has preserved a large amount of variation simply by his limited range of proxies - a problem exacerbated by the biased geographic range of his proxies. Ergo the instrumental record is already effectively smoothed relative Loehle's reconstruction due to using so many stations. The additional 29 year smooth therefore does not result in a like for like comparison, when by "like" we compare level of smoothing.
Put another way, had Loehle used a thousand proxies, globally distrubuted, nearly all of the variation at less than a centenial scale would have likely been smoothed out by the increased number of proxies. That is particularly the case as the increased number would include a very high proportion of SST proxies rather than the just one (?) used by Loehle. With that number of poxies, a comparison with the 29 year instrumental mean would have been like for like. With just 18, it is simply a distortion.
The second factor is that nearly all people looking at the graph will interpret the final instrumental value as "now", rather than the mean of a 29 year period centered 15 years ago and including two major volcanic erruptions in the period. That intuitive interpretation is just wrong, and amounts to the assumption that, starting now, temperatures will fall for 29 years as rapidly as they rose over the last 29 years (an absurd proposition even for most educated deniers). This does not in itself mean we should not use a 29 year mean, but it does mean we should always include the annual values as well to prevent that distortion. Or at least, that is my opinion.
-
Rob Honeycutt at 09:33 AM on 2 April 2015Scientists link Arctic warming to intense summer heatwaves in the northern hemisphere
Shall GreenLand therefore return to Green in the near future?
That's unlikely to happen for quite a while, because (a) it will take many centuries to melt the ice, and (b) the land under the ice has been scoured clean of anything that would support plantlife. It will take many millennia to build back an environment that could sustain any thing green.
-
Watchdog at 09:19 AM on 2 April 2015Scientists link Arctic warming to intense summer heatwaves in the northern hemisphere
Tom C .. I've no trouble accepting your statement: "Taken alone, anything could be considered a 'poor measure of global climate'. Because the global climate includes the totality of litho-, hydro-,cryo-,atmo- and bio- spheres. That's why climate science looks at multiple lines of evidence within each domain, in order to examine what is happening."
It's an extension of the line of thought that I'd presented when ultimately suggesting that all Global Ice Volumetric Fluctuations should be taken into consideration at the same time.
Tom.. I'm not married at all to Loehle, 2007, per se.
It is somewhat disquieting to encounter a constant string of Climatology papers constantly becoming considered \null and void by the constant string of newer papers. That fact makes me skeptical of the "red" portions of the acknowledged less-than-perfect Loehle, 2008
IF that "red" data is true, than, yes, it's at least an eye-opener.
Shall GreenLand therefore return to Green in the near future? -
Rob Honeycutt at 08:38 AM on 2 April 2015Scientists link Arctic warming to intense summer heatwaves in the northern hemisphere
Not to dogpile, but here is the version of Loehle with HadCRU3 a few years ago. Seems to agree with Tom Curtis' version. And when I created my version, I shared with Dr Loehle before posting and he agreed it was accurate.
-
Stephen Baines at 07:37 AM on 2 April 2015It hasn't warmed since 1998
And a third point. I'm a bad typist.
-
Daniel Livingston at 07:28 AM on 2 April 2015Why I care about climate change
I love this site! Thank you to all contributors.
I share similar motivations to those of John Cook, as a Christian and a father, for my concern about climate change. I've put together a video looking at climate risk management from my Christian perspective.
-
Stephen Baines at 07:27 AM on 2 April 2015It hasn't warmed since 1998
JohnD at 311
Two points. First I don't think the post you're responding to was suggesting that you did not understand the first law of thermodynamics. In fact, it was presuming that you did understand it. The point was that what confidence modelers have comes from the application of relatively simple laws of physics, albeit impliemented in a complex context. What looks like religiosity to you many stem from the confidence in those laws.
Second, until we understand what you are specifically talking about with respect to poor predictions, it's hard to discuss you concerns. For the most part models have done pretty well, especially when the inputs actually reflect reality. They certainly do well enough to discern a human influence on climate vs a natural one. Projections forward are very much dependent on basically random events like volcanoes and El nino and by the actions of humans, which may be influenced by the models.
If you gave us some specifics people could respond more constructively.
-
Tom Curtis at 07:22 AM on 2 April 2015Scientists link Arctic warming to intense summer heatwaves in the northern hemisphere
Watchdog @37, I note that you have posted a version of the Loehle 2007 temperature reconstruction. That is disappointing, not least because Loehle 2007 was found to have several errors, some of which at least were acknowledged by Loehle himself in Loehle and McCulloch (2008). Given that correction, there is no excuse for continuing to use Loehle 2007. Here for comparison is the Loehle 08 reconstruction alongside the BEST LOTI:

Even using Loehle 08 is dubious, however. He used just 18 proxies, nearly all of which are from the Northern Hemisphere, and a majority of which (10) are from the North Atlantic and immediate surrounds. As his method was to take a simple mean, this is equivalent to assuming that the North Atlantic and immediate surrounds occupies 55.6% of the Earth's Surface, with China (22.2%), the Pacific Warm Pool and South Africa (11.1% each) making up the remainder.
The decision to use so distorted a geographical representation of proxies was not justified by lack of data, with long ice cores known to exist for Antarctica, the Andes and the Tibetan plateau; and long coral sequences verly likely existing for the Great Barrier Reef. It was, however, a convenient decision given Loehle's known preferences as the North Atlantic shows the greatest temperature variability over time relative to other regions; and the strongest effect of the MWP. That is, not only was the data selection biased, it was also tendentious.
These fact entirely undercut your argument. The long term trends you point to are as much an artifact of limited and biased data selection as of actual global temperatures. Potentially more so. Even so, as can be seen even on your graph, the twentieth century warming has endured longer than any period of equivalent slope to the trend, or equivalently, has shown a stronger trend than any period of equivalent duration. Ergo it is not just another natural trend. Further, as it is a predicted trend, on the basis of the theory that predicted it, it is likely to continue.
-
Tom Curtis at 05:39 AM on 2 April 2015Sea Level Rise is Spiking Sharply
sgbotsford @10, taking your lake analogy, a high wind tide on one side of the lake would result in a low wind tide (reduced apparent level) on the other side of the lake as volume overall would be unchanged. If you had three or four water level gauges spaced around the lake, you would be able to detect this effect and remove it from any measure of total lake level.
By analogy, you can do the same with the world's oceans. Admitedly the oceans are large enough that such effects might result in a temporary rise in sea level at the center of the ocean, but tide gauges are found on islands as well as on continental shores. Therefore such an effect is unlikely to not be detected. Of course, such measurements will not be perfect, and there will be a small amount of noise resulting. The noise, however, is likely to be unbiased (ie, to not create spurious long term trends) and short term so that it will not effect overall measurements.
Further, with regard regular tides, tidal measurements are made for high and low tide so that the effect is easilly removed. Tide gauges can also easilly remove the effect of waves by a variety of means, ie, by buffering the water so as to reduce wave motion where measured, or by continuous measurement with the effect of the waves being removed as with tides.
However, as CBDunkerson points out above, the measurements above are satellite measurements so that they have near universal coverage of the oceans. Therefore they do not miss the total effects of "wind tides" with rises from one being compensated by falls in the other. They can eliminate the effect of tides by calculation (as the effect causing the tides is well known, and easilly calculated for the ocean surface, if not for all shorelines) and waves will be averaged out at the resolution of the radar used for altimetry.
-
Tom Curtis at 05:23 AM on 2 April 2015Sea Level Rise is Spiking Sharply
ranyl @7:
1) It is estimated that a 0.66 meter sea level will cover 26 thousand square kilometers of land. In contrast, the oceans have an area of 361 million square kilometers. Ergo, a 0.66 meter rise in sea level would require an expansion in volume of 238.3 x 10^12 cubic meters if the shore line was vertical such that no extra land was covered, and an additional 8.6 x 10^9 cubic meters to cover the land. That is, it would require an additional 0.004% volume to allow for the sloping shore line. So, while the effect you describe is real, it is also negligible.
2) The melting of floating ice actually raises sea level slightly due to the different densities of saline water (as found in the sea) and fresh water (as found in ice). Grounded ice, which by definition is not floating, and hence has more volume than an equivalent area of barely floating ice must raise sea level rise even more. Ergo when grounded ice is undercut be melting, that melting provides sufficient water to fill the cavity, and then some.
3) When ice shelves break up, the ice does not melt instantaneously. Rather, it hangs around as ice bergs, some of which can survive several years. Further, the volume of ice in any given ice shelf is not larger relative to the total mass loss from Antarctica or Greenland. So, while the break up of a large ice shelf may slightly accelerate sea level rise, it is unlikely to do so appreciably.
-
Tristan at 05:22 AM on 2 April 2015It hasn't warmed since 1998
John @311
You neglected to answer my question.
There are large confidence intervals for many of the projected future scenarios. Those confidence intervals aren't hidden. Fortunately, climate science isn't confined within any single paper or projection. The current state of climate science represents a consilience of evidence from thousands of papers. Most climate scientists aren't saying 'exactly x will happen by year y', they are saying 'these are the range of things that are likely to happen, given current trends and models based on physical constraints, and it is smart money to acknowledge these likelihoods'.
-
Tristan at 05:14 AM on 2 April 2015Scientists link Arctic warming to intense summer heatwaves in the northern hemisphere
Watchdog @30
Taken alone, anything could be considered a 'poor measure of global climate'. Because the global climate includes the totality of litho-, hydro-,cryo-,atmo- and bio- spheres. That's why climate science looks at multiple lines of evidence within each domain, in order to examine what is happening.Sea Ice predictions/projections are not merely extrapolations of trends - that is what is known as a naive model. If that's your comprehension of what climate science is, you've been woefully misinformed.
-
JohnD11920 at 04:56 AM on 2 April 2015It hasn't warmed since 1998
It's childish and unnecessarily insulting to suggest I don't understand concepts of conservation laws. Perhaps poor reading comprehension by some lead to that conclusion. I’m not sure. But I never suggested the concept was wrong or I didn’t make sense to my weak and feeble mind. And the thought that I don’t understand that a complex system is difficult to predict or understand instrumentation errors and sensitivities is ridiculous because that is my point…
I do indeed believe that it has to be a fact that CO2 has many negative effects (and really I thought I made that obvious and even stated that to begin with). Like I said however, what is disturbing to me is the religious-type fervor on the subject in particular the condescension (such as insulting people’s intelligence over expressing a caution when trusting a model that cannot be validated except over time) and lack of good predictability (using early 2000s as a reference for myself). I only posted because the pretentious attitudes and condescension are disgusting. I did not suggest it is not a problem. But it is important to remember that there has to be a large band of confidence by any model with so many factors.
Perhaps a major issue is only the poor predictions are making it to the media, but all I have seen in the past is the extreme scenarios that has not panned out. I’m not going to devote large amounts of time to researching this because it’s better for me to devote my time to my own industry, but I am skeptical of the level of confidence many have in the problem’s *rate* not its existence and the fervor around predictions. I’m not even saying that it’s overstated… I’m just saying there cannot be an enormous level of confidence in the rate in which the effects of the added heat occur. If someone posts again that I don’t understand the concept of a closed system or the 1st law, then I will be disappointed. The questions I raise are about the confidence in rates not the mechanism.
Moderator Response:[JH] You make numerous assertions in the above, some personal and some about the science. The tone of you personal assertions is argumentative and this argumentative tone should not be repeated in you future posts. Your assertions about the science are undocumented. If they are merely your personal opinion, they have little value in this venue.
-
Watchdog at 04:42 AM on 2 April 2015Scientists link Arctic warming to intense summer heatwaves in the northern hemisphere
PhillippeChantreau@32
My placing "quotes" around my comment "relatively stable" is intended by me to convey the somewhat indistinct objective character of various "time period" terms, such as: "short", "long", "insufficient".
2014 evidences the Coldest Arctic Summer during our most recent 10yr time period. 2014 exhibited almost 2 million km2 more sea ice (area) during its Summer than had the Warmest Summer (2012) within that same 10 yr time period.
In post 20, I was referring to Total (Land & Sea) Antarctic Ice Mass as ad being a part of my suggestion that -> All Global Ice Volume Data (e.g., graphed against time) should be used for determining the affects of Global Ice upon Global Climate - rather than using only averaged Arctic sea ice fluctuations.
Phillippe@28 - You asked: "how many years of data are necessary to establish a statistically significant trend.", and I responded, "when it comes to me examining any Climate Change, the longer time periods to examine, the better."
IMO The key (unqualified) term above is "trend".
How far into the future can a 30yr Global Temp trend be extrapolated?
Is 30 yrs of temp data sufficient to establish historical Global Cooling and Warming periods which occur in cycles of 100's of years?
I exhibit this following graph (revised 2007) representing 2000 yrs of Global Temperatures constructed from 30yr temperature periods
In spite of any potential more-recent proposed reconstructions this graph still clearly evidences numerous longer-than-30yr periods of significant warming and cooling trends which cannot be realized from any singular 30yr trend.
http://jennifermarohasy.com/2007/11/2000-years-of-global-temperatures/ -
ryland at 04:22 AM on 2 April 2015Ipso proves impotent at curbing the Mail's climate misinformation
CBDunkerson. Why not just show smoke stacks belching out smoke? That gives a double whammy of CO2 plus very visible atmospheric pollution?
-
billthefrog at 04:09 AM on 2 April 2015Global warming and drought are turning the Golden State brown
@witsend
Is it possible that you are reading something into this article that was neither stated or intended? When a paper talks about California being "in the midst of its worst drought in over 1,200 years", that doesn't necessarily mean things were worse just over 1,200 years ago. (Or that 2,000 year old trees must therefore have lived through worse times.)
Over the 2013/14 winter, the UK experienced the exact opposite of the Golden/Brown State, and we had record levels of precipitation. However, the amount of misinterpretation surrounding the reporting of this event was simply jaw-dropping. How much was deliberate, and how much was accidental, is open to conjecture.
The longest running temperature & precipitation dataset from a fixed location anywhere in the UK, is that from the Radcliffe Meteorological Station at Oxford University. Although not completely continuous, this, nonetheless, has data stretching back to 1767.
Apart from some newspapers (and individuals) not appreciating the difference between a national record, and a merely local record, many people appeared confused by the phrase "wettest since 1767". In many quarters, this was immediately taken to mean that 1766 must, perforce, have been wetter still.
Some of the blame must be laid at the door of jounalists who are either too lazy, or too incompetent, to address any ambiguity. However, the onus is also on the reader not to extrapolate beyond what was said.
On the other hand, if it was specifically spelled out somewhere that things were worse 1,000 or 1,200 years ago, and I simply failed to notice that, then it looks like I need to arrange a visit to the optician. (And that, of course, would also mean that it was mea culpa time yet again.)
cheers bill f
-
PhilippeChantreau at 03:57 AM on 2 April 2015Scientists link Arctic warming to intense summer heatwaves in the northern hemisphere
Watchdog, you still don't get it. Statistical significance is not a matter of opinion. It is calculated by mathematical methods. Given a specific time series, one can determine what is the minimum sample size to establish statistical significance. 10 years is not enough. Arctic temperatures have increased so much that saying this was the coldest summer in 10 years or the most ice in 10 years is like saying this is the coldest that a sauna room has been in the past 30 minutes. It is of no value at best, dishonest at worst. By the same token, referencing a paper that points out regional changes in ice mass balance and trumpeting that it shows overall positive ice mass balance when the conclusion of the paper says opposite is called what exactly? You do not comment on that either, I note.
The graph from Marohasy's web site comes from Spencer and has numerous known issues. Marohasy is not a reliable source for anything, as is demonstrated by her history. If you want to talk about the science, reference science publications, not blog posts. You are also totally silent on the sea ice volume studies mentioned earlier. How can you possibly expect to be taken seriously? Do you realize how weak your argumentation is? Reminds me of a certain sketch in which it is argued that the parrot is just resting...
-
billthefrog at 03:15 AM on 2 April 20152015 SkS Weekly Digest #13
D218O ?
Why stop there? We could have Tritium instead, and the liquid could be methanol. (As the half life for Tritium's Beta decay is about 12.3 years, it shouldn't melt the ice too quickly.)
This does, however, add a whole new dimension to the term "getting blind drunk".
cheers bill f (completely teetotal, except when not)
-
Watchdog at 03:10 AM on 2 April 2015Scientists link Arctic warming to intense summer heatwaves in the northern hemisphere
PhillippeChantreau@32
My placing "quotes" around my comment "relatively stable" is intended by me to convey the somewhat indistinct objective character of various "time period" terms, such as: "short", "long", "insufficient".
2014 evidences the Coldest Arctic Summer during our most recent 10yr time period. 2014 exhibited almost 2 million km2 more sea ice (area) during its Summer than had the Warmest Summer (2012) within that same 10 yr time period.
In post 20, I was referring to Total (Land & Sea) Antarctic Ice Mass as ad being a part of my suggestion that -> All Global Ice Volume Data (e.g., graphed against time) should be used for determining the affects of Global Ice upon Global Climate - rather than using only averaged Arctic sea ice fluctuations.
Phillippe@28 - You asked: "how many years of data are necessary to establish a statistically significant trend.", and I responded, "when it comes to me examining any Climate Change, the longer time periods to examine, the better."
IMO The key (unqualified) term above is "trend".
How far into the future can a 30yr Global Temp trend be extrapolated?
Is 30 yrs of temp data sufficient to establish historical Global Cooling and Warming periods which occur in cycles of 100's of years?
I exhibit this following graph (revised 2007) representing 2000 yrs of Global Temperatures constructed from 30yr temperature periods
In spite of any potential more-recent proposed reconstructions this graph still clearly evidences numerous longer-than-30yr periods of significant warming and cooling trends which cannot be realized from any singular 30yr trend.
http://jennifermarohasy.com/2007/11/2000-years-of-global-temperatures/Moderator Response:[JH] You have now fallen through the thin ice of sloganeering. Any future posts by you along the lines of the above will be summarily deleted.
-
CBDunkerson at 02:29 AM on 2 April 2015Sea Level Rise is Spiking Sharply
sgbotsford, the answer to all your questions is found in the caption for the first image in the article above, "...as measured by satellite altimetry".
-
PhilippeChantreau at 01:25 AM on 2 April 2015It hasn't warmed since 1998
John D, skepticism is a good thing indeed, when it is sincere. Refusing to acknowledge an entire body of evidence because one dislikes what it implies is not skepticism. Believing ideas that are not supported by evidence because they are more appealing or conform to one's preferred ideology is not skepticism. Stating that, in essence, one's ignorance is just as good as a bunch of other poeple's expertise is not skepticism. Choosing to trust an isolated fruitcake or a charlatan vs a large number of experts with converging results is not skepticism. The last time that I know of that a skeptic went about it with sincerity, the result was the BEST study. That's sincere.
You make claims of "blind faith" and inaccurate predictions that beg for further development. The thread mentioned higher would be the place to go for that.
-
sgbotsford at 01:19 AM on 2 April 2015Sea Level Rise is Spiking Sharply
Education please: How do you measure sea level to the accuracy needed to determine a rise?
You are measuring something that:
- has a wave hitting shore several times a minute with a magnitude of a few inches to many feet.
- Tides that have a daily and a monthly cycle of several feet.
- Have storm surges, and smaller disturbances that push water toward/away from shore, on a scale of individual fronts, as well as longer established winds such as the trades and the westerlies.
- Strong cyclonic storms create a pile of water away from the shore. Anti-cyclones a hole in the water.
As a younger pup I used to do canoe expeditions that would finish on Lake Winnipeg. That lake, much smaller than an ocean was subject to 'wind tides'. Water level in the south basin could rise 2-3 feet with a strong northwesterly, common after a major storm passed.
The short term effects I can see being smoothed out by locating your guage in a tube of porous material such as gravel or sand. This has enough drag to smooth out the waves. But how do you deal with the long term cycles?
Assuming that you get one instrument readings ironed out, how do you merge the readings for a world, given that the guages are not well distributed over the world's coast lines, and there is a lot of ocean that isn't handy to a coast line?
This would be a good education piece.
-
bozzza at 00:31 AM on 2 April 2015Global warming and drought are turning the Golden State brown
Cool,.. but did they look healthy? More to the point: did they look like the healthiest gum-trees you've ever seen?
-
bozzza at 00:27 AM on 2 April 2015Sea Level Rise is Spiking Sharply
If we are looking at a linear increase since the 1990s that means the economic rise of China hasn't been reflected in the graph and presumably we all still have this to look forward to.
-
bozzza at 00:19 AM on 2 April 2015Sea Level Rise is Spiking Sharply
Regarding paragraph three: I'd be assuming this factor is close to negligible! (Never thought about it but so nice point.)
-
bozzza at 00:12 AM on 2 April 2015It hasn't warmed since 1998
@ 307, how can an engineer not understand tolerance value for instrumentation?
-
bozzza at 00:10 AM on 2 April 2015It hasn't warmed since 1998
John D, being a skeptic is one thing but lying is another.
-
ranyl at 00:04 AM on 2 April 2015Sea Level Rise is Spiking Sharply
Sea level rise is interesting.
It looks like an almost linear rate of increase however the rate has accelerated since the 1990's.
Also not sure if accounted for or what influence this has, however seeing the sea as a wide flat rimmed basin, as the level goes up doesn't the surface area covered by the sea go up also, and therefore doesn't the volume expansion needed just to miantian the same rate of sea level rise have to be accelerating?
And when melting the underneath of an underwater grounded icesheet (e.g. Pine Island), presuming the above sea level proportion is still effectively supported, won't sea levels fall slightly as the ice in the melted hollow below sea level is replaced by water due to ice's larger volume? Sure this is a tiny effect, although large parts of Greenland and Antarctic do have below sea level and seabed grounded icesheets.
And considering those underwater ground icesheets further, if the above sea level icesheet that is supported below by a column of ice that reaches to the seabed (i.e. the icesheet above sea level is not floating and therefore not displacing sea water at the moment), suddenly became unstable due the melting by the warm bottom water undermining the below sea water level ice's supporting structure to the point of failure, such that the now unsupported part of the ice sheet would effectively suddenly falling into the sea, could relatively rapid jumps in sea level occur? Presuming the above sea level ice sheet would falls slowly and gracefully into the sea.
Sort of like undermining castles walls, do the above sea level parts of the below sea level icesheets have the potential to basically fall into the sea as there bases become more and more undermined??
Could that be a sudden event?
Suppose depnends on how fast and extensive the undermining is?
-
John Hartz at 22:48 PM on 1 April 2015Sea Level Rise is Spiking Sharply
Directly related to the current mild temperature of the Western Pacific Ocean...
Category 5 Super Typhoon Maysak is packing sustained winds of at least 160 miles per hour as it takes aim at the tiny island of Yap in the Caroline Islands on Tuesday. The typhoon is the third of the year so far, which sets a record for the most typhoons so early in the Western Pacific typhoon season, according to meteorologist Jeff Masters of Weather Underground.
The storm is rarer still when looking only at the record of typhoons that reached an intensity of Category 3 or stronger before April 1. Such typhoons are known as major typhoons.
Super Typhoon Maysak marks the first time two major typhoons have occurred in the Western Pacific before April (the other was Typhoon Higos). The storm is even rivaling the strongest storms on record for so early in the year, which were Super Typhoon Ophelia in 1958 and Super Typhoon Mitag, which occurred in March 2002. The typical Western Pacific typhoon season runs from April through October.
Category 5 Super Typhoon Maysak sets record in Western Pacific by Andrew Freedman, Mashable, Mar 31, 2015
-
CBDunkerson at 22:23 PM on 1 April 2015It hasn't warmed since 1998
JohnD wrote, "I have never seen an accurate prediction of global temperatures over any appreciable period of time."
This can only be true if you haven't looked very hard or are definining 'accurate' and/or 'appreciable' in ways that I would consider unreasonable. I mean, look at the list of top climate myths at the upper left part of this page. Number six is 'Models are unreliable'.
Climate models can not predict volcanic eruptions or fluctuations in various cycles (e.g. ~11 year solar cycle, ~30 year PDO, et cetera)... which is why they do multiple runs assuming different variations for these factors. Observed warming has consistently been within the range shown by those scenarios, and when you plug in a scenario matching the actual unpredicted variations you get results matching the actual observations. If that isn't 'accurate' then you're using the word in a way which reverses its most common meaning.
-
Stephen Baines at 22:23 PM on 1 April 2015Sea Level Rise is Spiking Sharply
Yes, Maybe I jumped the gun on NOAA's official call of a full fledged El Nino episode as it seems a fait accompli. The fact that different organizations differ indicates how weak the El Nino conditions are.
-
Glenn Tamblyn at 21:17 PM on 1 April 2015Global warming and drought are turning the Golden State brown
"if you want to see a good Gum(tree) don't look for it in Australia."
Reminds me of a strange travel experience. Driving through southern Portugal when suddenly all we could smell was Australia - Gum-Trees everywhere.
-
bozzza at 20:59 PM on 1 April 2015Global warming and drought are turning the Golden State brown
This reminds me of a saying they have here in Australia: if you want to see a good Gum(tree) don't look for it in Australia.
-
One Planet Only Forever at 14:02 PM on 1 April 2015Sea Level Rise is Spiking Sharply
Stephen Baines @1
Based on the NOAA method of 5 consecutive 3 month averages of the Nino 3.4 region being 0.5 C or more above the baseline value the soom to b published JFM value is likely to establish that an El Nino event is occuring and it started in the SON 2014 set of months.
However, the latest Australian Meteorological ENSO wrap up (issued March 31), does not yet consider the conditions to have reached El Nino status.
So based on NOAA methods for indicating El Nino the warm event has been with us for a while, but the Australians do not think El Nino conditions have even started, it is only near to occuring.
Prev 599 600 601 602 603 604 605 606 607 608 609 610 611 612 613 614 Next


