


 Arguments


Recent Comments
Prev 614 615 616 617 618 619 620 621 622 623 624 625 626 627 628 629 Next
Comments 31051 to 31100:
-
alby at 19:13 PM on 19 February 2015Missing Arctic warming does contribute to the hiatus, but it is only one piece in the puzzle.
Sorry I wrote 0.017 instead of 0.17
...and now I see teh short answer from Kevin C.
Regarding Gleisner in Fig. 5 they found the arctic influence to global T trend, because on fig. 5 the difference from original HadCRUT4 data (yellow line) and Gleisner (black lien) starts from latitude > 70 N.
Additionally Kriging (blue line) increase the global T from 0.08 up to apporx. 0.11 but (comparing to Gleisner trend) with a visible contribution (approx. 0.02) coming from latitude < 70
-
alby at 19:01 PM on 19 February 2015Missing Arctic warming does contribute to the hiatus, but it is only one piece in the puzzle.
gregcharles: the articles doesn' t misreports T trends. Look at the right end (right because the graph is cumulative) of fig.5: original data from HadCRUT4 (yellow line) shows for the period 1997-2012 a trend of 0.05 °C/decade (less than 0.017) as reported in the article before fig. 1 "The trend in HadCRUT4 over that period is about 0.05°C/decade". Now, there are two facts: the artic trend alone is much higher (approx. 1.5 °C/decade) and the surface of the artic region is roughly 1/10 of the global surface with only a partial coverage from HadCRUT4. Consequently including the "missing region" of the artic in the global trend this will increase, adding 0.03 or 0.04 to 0.05 to, up to 0.08/0.09 (see black line on the right end of fig.5). The "missing region" is (quote from the article) due to "HadCRUT4 had on average 64% coverage for the region north of 60°N ... This region corresponds to about 6.7% of the planet's surface. Therefore the missing region corresponds to about 2.5% of the planet"
0.36 x 6.7% = 2,41%% or roughly 2.5%
and 1.3 °C/decade x 2.5/100 = 0,03 °C/decade (for 1.7 the contribution is 0.4).
I hope (if I'm right, if not someone will correct) to have been clear.
-
Kevin C at 18:37 PM on 19 February 2015Missing Arctic warming does contribute to the hiatus, but it is only one piece in the puzzle.
No, the trends N of 70N really are around ten times higher than the long term trends for the planet as a whole. That is how 2.5% of the planet can influence the global trend. That may seem incredible, but it is confirmed by us, Berkeley, all of the reanalyses and AVHRR. GISTEMP capture most of it, albeit with poorer coverage and some other problems.
And actually so does the Gleisner reconstruction, despite the fact that they say they can't find it - that was a bit strange.
-
gregcharles at 13:10 PM on 19 February 2015Missing Arctic warming does contribute to the hiatus, but it is only one piece in the puzzle.
Thanks to Firgoose for working out those links. I was also scratching my head after first clicking on the Check It Yourself links.
Another head-scratcher for me: does it seem like this article consistently misreports temperature trends by a factor of 10? For example, "The rate of Arctic warming in the MERRA for region north of 70°N, where most of the missing coverage occurs, is 1.3°C/decade. The ERA-interim reanalysis shows a higher rate of 1.7°C/decade." Global warming trends are about 0.17°C/decade, right? Maybe, I'm misunderstanding what's being reported here.
-
jja at 11:13 AM on 19 February 2015Missing Arctic warming does contribute to the hiatus, but it is only one piece in the puzzle.
Kevin, thank you for your reply, sorry for the late response. The DMI data that I was referencing is the "north of 80N" series found here:
http://ocean.dmi.dk/arctic/meant80n.uk.php -
Tom Dayton at 02:59 AM on 19 February 2015We're heading into an ice age
Climate Dialogue has a good and recent overview of the potential effect of a new Maunder Minimum, in its "Introduction" to that topic.
-
Tom Dayton at 02:57 AM on 19 February 2015It's the sun
Climate Dialogue has a good and recent overview of the Sun's potential role in Earth's temperature increase--not just with regard to the effect of a new Maunder Minimum--in its "Introduction" to its New Maunder Minimum topic.
-
ranyl at 20:17 PM on 18 February 2015Missing Arctic warming does contribute to the hiatus, but it is only one piece in the puzzle.
Thanks Kevin.
-
One Planet Only Forever at 13:36 PM on 18 February 2015Scott Mandia on teaching students to debunk climate misinformation
You should consider ensuring you use the terms 'skeptic' and 'climate denier' accurately in your presentations.
The New York Times recently presented this article "Verbal Warming: Labels in the Climate Debate". (this is also one of the articles in the 2015 SkS Weekly News Roundup #7B)
The article is about a US scientist, Mark B. Boslough, who objects to calling people who create unjustified attempts to discredit climate science 'skeptics'. His open leter on the matter has spawned a petition to have the media refer to such people as 'climate deniers' rather than 'skeptics'.
-
jja at 09:56 AM on 18 February 2015NASA climate study warns of unprecedented North American drought
Ben Cook's intimation that the current california drought is a natural cycle event is overstated. His work can only assert this is natural because the regional sea surface temperature anomalies do not show up in the climate models and there is no downward precipitation treand that is statistically significant from the highly variable history data.
It is very likely that the models are simply not adequately addressing regional anthropogenic aerosol patterns, the effects of Hadley expansion in mid-latitudes, the combination with this and arctic amplification effects on the jet stream, shifts in the inter-tropical convergenze zone due to north vs. south hemisphere aerosol loading and (possibly) the effects of deforestation in the south american tropics See: http://www.accuweather.com/en/weather-news/amazon-climate-change/20184965"All of this has to do with a tipping point," Symington said. "With deforestation, if you go beyond a certain point in the Amazon there's an issue of where the whole system becomes destabilized and you would switch from a tropical, moist forest system, to something that was much drier and more like the Cerrado of central Brazil, sort of a dry forest, savanna system. If that happened it would have a huge impact on species in the Amazon and also on the climate."
About 20 percent of the fresh river water in the world comes from the Amazon River, and drying of the forest can negatively influence that water source. Symington told Accuweather.com that changes to this freshwater output would affect the entire current off the coast of South America, which could affect the jet stream, which would ripple into a change in weather patterns across the globe.
-
Tom Curtis at 07:30 AM on 18 February 2015NASA climate study warns of unprecedented North American drought
Firgoose @6, BAU may be limping, as you say, but that does not mean the course we follow will be towards less CO2 emissions. It is very possible that a dirth of sources of liquid fuels will result in replacement by fuels that emit far more CO2 over the entire production process, per liter of fuel used on the road. That would switch us to a BAU+ path rather than the BAU- path we are currently limping along.
-
Kevin C at 05:31 AM on 18 February 2015Missing Arctic warming does contribute to the hiatus, but it is only one piece in the puzzle.
If there's a way to get the trend in KNMI, I haven't found it either. Click 'raw data' above the third graph and copy it into a spreadsheet. The lack of 700mb trend you can see by eye though.
-
Firgoose at 05:25 AM on 18 February 2015Missing Arctic warming does contribute to the hiatus, but it is only one piece in the puzzle.
For those, like me, who clicked the "Check it yourself" links and came back with a well-scratched head, wondering why both links go to the same place, and what to do with this amazingly complicated looking, scrollfest of an interface anyway? ... the instructions are in a tooltip that shows if you hesitate over "Check it yourself" for long enough before clicking; a fortunate but accidental discovery in my case. ;-) Reading tooltips while clicking widgets on a different page is for magicians so here are the instructions ...
For the ERA-interim reanalysis rate of Arctic warming in the region north of 70°N : Select ERA or MERRA (show/hide) — click temperature/2m (radiobutton) — click "Select Field" (button) — fill in latitudes 70N-90N — optionally click "convert to Celsius" (radiobutton) — click "Make time series" (button).
If I did it correctly, this should be a direct link for ERA.
And for MERRA
For the trend "3km into the atmosphere to the 700mb level" it's almost identical to the above : Select ERA (show/hide) — click temperature/700mb (radiobutton) — click "Select Field" (button) — fill in latitudes 70N-90N — optionally click "convert to Celsius" (radiobutton) — click "Make time series" (button).
However, if the results are supposed to draw the trend or and give a value, I've no idea what I missed. :-/
Moderator Response:[RH] Shortened links that were breaking page format.
-
Kevin C at 05:07 AM on 18 February 2015Missing Arctic warming does contribute to the hiatus, but it is only one piece in the puzzle.
Ribwoods: Fixed, thanks. (Figure 1 was a late addition)
jja: The Arctic report card doesn't go into the methodology in detail, but an average to 60N will be dominated by the stations in the 60-70N band. ERA-i, JRA, Berkeley Earth and ourselves all show less extreme temperatures on the region N of 70N in 2013.
wili: That's something we're hoping to look into, but haven't had a chance to yet.
-
wili at 04:37 AM on 18 February 2015Missing Arctic warming does contribute to the hiatus, but it is only one piece in the puzzle.
Thanks for the response, Kevin. "We've seen examples of rapid Arctic warming like this in models, but is is never longlived. That suggests we shouldn't expect the trend to continue"
So, do we have any idea what drives periods of greater rather less rapid Arctic warming? If we don't, how can we know that this is really something cyclical, especially with all the added forcings and feedbacks of our ever wierder global wierding?
By the way, I see that temperatures north of Norway now reach into the 40s F (5.5 C). earth.nullschool.
-
ribwoods at 03:43 AM on 18 February 2015Missing Arctic warming does contribute to the hiatus, but it is only one piece in the puzzle.
And in the second paragraaph after Fig. 5, the fourth sentence starts "The results are shown by the black points in figure 4 ...:, but s/b "... in figure 5 ..."
-
ribwoods at 03:35 AM on 18 February 2015Missing Arctic warming does contribute to the hiatus, but it is only one piece in the puzzle.
In the article, the paragraph just prior to Fig. 3 starts "The errors in the different reconstructions by month are shown in figure 2", but should be "... in figure 3."
The paragraph just prior to Fig. 4 starts "If we include all three temperature reconstructions in the latitudinal temperature plot, we obtain figure 3", but s/b "... obtain figure 4."
The second paragraph after Fig. 4 starts "One other feature is shown by the thin grey lines in figure 3", but s/b "... in figure 4."
The paragraph just before Fig. 5 ends with "This period is shown in figure 4:", but s/b "... in figure 5:"
-
jja at 03:28 AM on 18 February 2015Missing Arctic warming does contribute to the hiatus, but it is only one piece in the puzzle.
Kevin,
WRT your response above, the ARC for 2014 showed that 2013 was near the record high warming (fig 1.1) http://www.arctic.noaa.gov/reportcard/air_temperature.html
and the DMI has winter 2014 as near record high as well. Please explain? -
Firgoose at 03:16 AM on 18 February 2015NASA climate study warns of unprecedented North American drought
"If we follow the business-as-usual path, ..."
Fortunately, this statement will become as redundant, tedious and irrelevant as the apparently mandatory "If all the ice in [Antarctica | Greenland] melts". All of that ice is not going to melt for a very long time and we're not going to follow business as usual. We're already not following that trajectory, as both intention and action increase at the political and corporate levels.
The writing on the wall is being read, deniers are becoming dinosaurs walking on ever soggier sands, may their bones make interesting fossils. Joe Public is becoming more sympathetic to the plight of the future even if there's still a lot of resistance to actually doing anything personally. Joe will come round, whether stampeded by Gaia saying "Boo!" or herded by the Powers That Be/Will Be.
Forsooth, we probably won't get to a "below 2°C" but "business as usual" is limping and is going to have to drop out of the race.
-
Kevin C at 02:10 AM on 18 February 2015Missing Arctic warming does contribute to the hiatus, but it is only one piece in the puzzle.
Ranyl: Yes, I think you've got the gist of it. I guess you'd call it a cumulative zonal trend plot. The uptick in the last 30 degrees on the right is the Arctic contribution to the global trend. Given the tiny area concerned, you would expect it to be flat. But it isn't, even in the Gleisner reconstruction, showing that the Arctic is playing a role.
The difficulty with the non-cumulative version is that the affect of the different areas of the zones is lost, unless you choose equal area zones.Wili: We've seen examples of rapid Arctic warming like this in models, but is is never longlived. That suggests we shouldn't expect the trend to continue. And indeed the last two winters support that expectation.
-
wili at 01:20 AM on 18 February 2015Missing Arctic warming does contribute to the hiatus, but it is only one piece in the puzzle.
If these trends of much faster warming in the Arctic than in equatorial regions continue, at what point do we reach an essentially equable climate for the Northern Hemisphere? What would happen between now and then wrt the Hadley cells? What will be the effects on the ground of these shifts?
-
One Planet Only Forever at 01:20 AM on 18 February 2015NASA climate study warns of unprecedented North American drought
To maintain a more scientific focus I recommend revising the statement "If we follow the business-as-usual path, ..." to more specifically describe the issue. More descriptive alternatives would be:
- If we do not significantly change the motivations ruling the global social-economic-political systems, ...
- If we do not significantly limit specific ways that people can succeed in the global social-economic-political system, ...
-
ranyl at 00:23 AM on 18 February 2015Missing Arctic warming does contribute to the hiatus, but it is only one piece in the puzzle.
Thanks Kevin,
Just a question re-figure 2 and those related.
At first glance it seemed to be showing the decadal warming at different latitudes and was thus surprising that there is no polar tick as you say in both pre and hiatus periods, for both poles are warming reasonably rapidly, as you say, the Arctic up to ~1.7C/decade.
Then it dawned on me that each segment is actual the temperature trends for each degree of latitude North and South of the equator, so the 10 point represents the region between, 10N to 10S, 20 represents 20N to 20S and so on, and thus by the time you get 90N to 90S, you have the entire globe and therefore the post-hiatus period is showing little to no global warming overall.
However it seems there is a marked cooling trend in the post hiatus equatorial region (rising at 0.3C to falling at 0.2C figure 2), so quite a shift in trend of -0.5C in a decade or so, which I presume is mainly due to the La Nina predominance and increased oceanic heat uptake in the tropical regions.
And despite this marked tropical cooling trend the overall globe isn't cooling it is slightly warming figure 2. It does seem as if the regions from 20-50 N/S latitude make the majority of the contribution (~0.2C decade) and then there is a dipped line from 50- 70N/S suggestive of a cooling region (in keeping with cold NH winters recently) and then a further upturn to zero by 90N/S (~0.02decade) looking at the Hadcrut black line.
Which for me sort of implies that the Arctic contribution is there, and quite significant, and in keeping with you estimate of 0.03 to 0.05C (on the Kriging line it seems like definitely 0.05C per decade (figure 4)).
Therefore for me the graphs seem to imply that there has been a very strong cooling influence the tropics and from 50-70N/S (the dip on the graph) and warming influences between 20-50N/S and from greater than 70N/S.
Therefore if that is the case the Arctic tick is there and significant it is just lost in a graph whose horizontal scale is cumulative rather than representative of a specific regional areas (the maximum the Arctic can influence the global temperature is 0.05C per decade as you say and that is what it seems to do).
Is that right or have I missed something?
It would be interesting to see a plot of 10 degree slices, i.e. 10N to 10S followed by 10-20N and 10-20S and so on; wonder if that would allow the Arctic trend to be seen a lot more readily?? Or to plot it the other way round, from 90 to 0, where 0 N/S is the whole globe to see the tropical influence on the whole globe more?
-
Kevin C at 00:06 AM on 18 February 2015Missing Arctic warming does contribute to the hiatus, but it is only one piece in the puzzle.
The ice melting question is slightly different, although it's worth clarifying.
Ice melting/freezing anchors arctic air temperatures at around 0C for most of the summer. So the rapid Arctic warming we've seen is purely a winter phenomena. If you plot the Arctic temperature trends for winter alone, the trends are even higher than when looking at the whole year.
Having said that, since 2012 temperatures have stabilised or retreated a little. I don't think we're seeing any kind of tipping point or runnaway event in the Arctic.
-
Tom Curtis at 23:42 PM on 17 February 2015Human CO2 is a tiny % of CO2 emissions
I am not sure what favourite WUWT graph KR refers to, but I imagine it looks something like this:
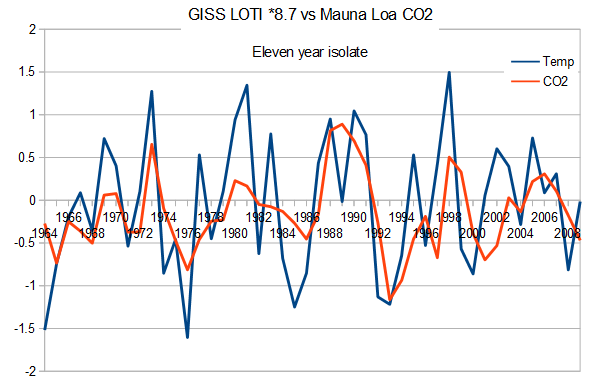
As you can see, there is a clear correlation between the CO2 records, and the temperature record. Of course, these are not the simple records. What I have done is to take each year from 1964-2009, and divided by the average of the eleven nearest years (inclusive). The purpose of doing that is that it eliminates any long term trend while retaining the annual variation. That is a good thing, because it allows me to take a regression of the two time series against each other, thereby determining the natural scale that maximizes similarity between the time series. In this case, that natural scale is 8.7, as indicated in the title. That is, for every 1 degree C increase in temperature, from this data we expect an 8.7 ppmv increase in CO2 concentration.
Put another way, based on the actual temperature and CO2 data, we expect the 1 C increase in Global Mean Surface Temperature (GMST) from 1910 to 2010 to have resulted in an 8.7 ppmv increase in CO2 concentration. As it happens, it has increased a little more than that.
Just using the GISS LOTI and Mauna Loa data used in constructing the graph, we can determine the approximate increase in CO2 from 1964 to 2009 was 67.95 ppmv (difference of eleven year means), while the temperature increase was 0.61 C. From that data, using the regression above, we can determine that just 5.29 ppmv of the increase was due to the increase in GMST, ie, just 7.8%.
However, there is still a strong correlation between temperature and CO2 over the period of Mauna Loa observations. Indeed, the correlation is 0.935 (RSQ = 0.874). That is not as good as the correlation between CO2 and cumulative emissions I mentioned @269 above. But it is still impressive. Very much better, for example than the 0.574 correlation (RSQ = 0.329) between the values once the trend is removed. That stronger correlation between the trend than the annual values tells us that, most probably, one is significantly responsible for the other. That is, either temperature is largely responsible for the CO2 trend; or CO2 is largely responsible for the temperature trend. However, we have excluded the former already with our regression. Ergo, the correlation between the annual data shows that the increase in CO2 is causing the increase in temperature (or at least, is largely responsible for it.)
It is no wonder Rickeroo (@266) invites us to have a "cursory look" at the data. If we only had a cursory look at the data, you might believe his interpretation of it. Once you analyze, it, however, you can see it conclusively refutes all of his claims.
-
Dikran Marsupial at 23:32 PM on 17 February 2015Human CO2 is a tiny % of CO2 emissions
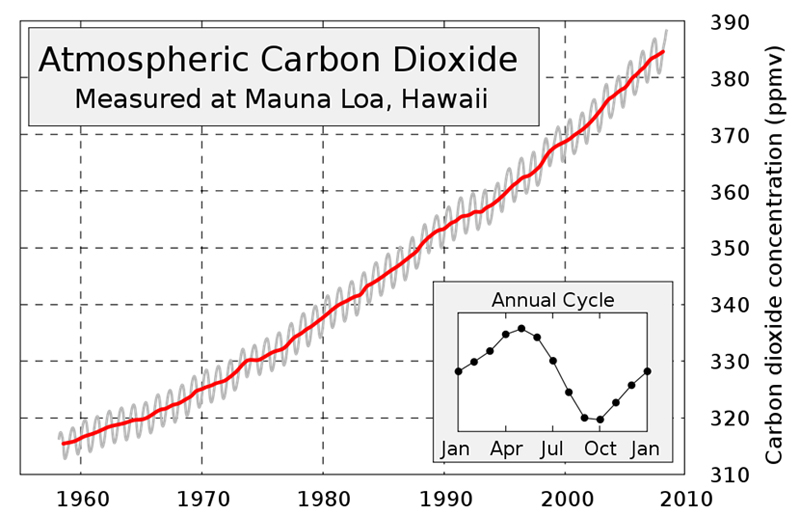
Rickeroo wrote: "Any cursory look at two readily available data sets, Mauna Loa CO2 and global temperature by year, clearly shows that temperature is a strong driver in how much CO2 ends up in the atmosphere on a yearly basis."
The correlation between temperature and the annual change in atmospheric CO2 is well known and has been since at least the work of Bacastow in the mid 1970s, and is largely due to the effect of ENSO on precipitation in the Americas, which in turn affects the uptake and release of CO2 by land vegetation (as KR mentions). This is explained in more detail in my article on Prof. Salby's misunderstanding of this correlation, where I show that a correlation with the annual increase has no mathematical relation to the cause of the long term rise (as the correlation is insensitive to the mean value of the annual increase, but it is the mean value that explains the long term rise. In particular, see the section "What does Mainstream Science say about all this?".
Some claim that this correlation is due to Henry's law, which suggests that the solubility of CO2 in the oceans depends on ocean temperature. However this neglects an important fact, which is that Henry's law also tells us that the solubility is proportional to the difference between the partial pressure of CO2 in the atmosphere and the concentration in the surface waters. Thus as atmospheric CO2 rises, its solubility in the oceans increases and the oceans take up CO2 in opposition to the rise in atmospheric CO2. It is the constant of proportionality that is sensitive to temperature. This is a good thing as it is a negative feedback that keeps the climate system more stable than it would otherwise be. So which factor dominates? The fact that atmospheric CO2 is rising more slowly than we are emitting CO2 into it shows that the natural environment as a whole is a net carbon sink, which tells us that the long term rise is being opposed by the natural environment, rather than being caused by it.
-
Esop at 23:23 PM on 17 February 2015Missing Arctic warming does contribute to the hiatus, but it is only one piece in the puzzle.
Very interesting discussion, Kevin!
As was mentioned in the comments on the other thread, the fact that the months with powerful Arctic blasts into lower latitudes (for example February and November 2014) produced a dip in the global average should indicate a very real cool bias due to not properly measuring the changes in Arctic heat. In other words, cold Arctic air flows south where we properly measure its cooling impact, but due to poor Arctic coverage, the impact of the heat flowing north is not properly measured in the Arctic, causing a cool bias due to the shuffling of air masses in the NH.
We know that surrounding air temperature pretty much stays unchanged when ice is melting. Could the heat partly hide from the measurements by being used to melt sea ice rather than heat the surrounding air?
-
ryland at 16:05 PM on 17 February 2015NASA climate study warns of unprecedented North American drought
Will@3 you may find the public are not as amenable to change as you might like. Pieces in the MSM such as that in today's Australian by Garth Paltridge a former CSIRO Chief Scientist and Director of the Antarctic Co-oerative Research Centre, which has some very critical comments about Climate Change, may well dissuade many from becoming to concerned about the future climate.
-
ribwoods at 14:43 PM on 17 February 2015Newcomers, Start Here
Might moderators find the following response to cagwskeptic helpful? If not, feel free to delete this post.
- - - -
cagwskeptic @245, Are you overlooking that:
(1) since the Industrial Revolution, manmade machines burning fossil fuels have been emitting more and more CO2 into the atmosphere,
(2) these anthropogenic CO2 emissions are in addition to all the natural processes that governed atmospheric CO2 levels before the Industrial Revolution, and
(3) recently our anthropogenic CO2 emissions have reached a magnitude that is several dozen times the amount of CO2 that volcanoes emit annually?
-
ribwoods at 14:24 PM on 17 February 2015Newcomers, Start Here
On this page, under "Good starting points for newbies", the first sentence includes "... a good starting point is Warming Indicators which lays out the evidence that warming is happening ..." However, the link from "Warming Indicators" is to http://www.skepticalscience.com/graphics.php?g=8 which has a graphic but does _not_ lay out the evidence.
Was that link supposed to go to a different page where evidence is actually laid out?
-
wili at 12:06 PM on 17 February 2015NASA climate study warns of unprecedented North American drought
So, should people be doing anything to prepare for this future?
This goes for coastal settlement as well. Shouldn't we start planning a de-population of some of these areas? Is that to 'political' to talk about?
Moderator Response:[PS] "Its too hard" would be a more appropriate thread to talk about solutions. There are other blogs to discuss politics. eg http://thinkprogress.org/climate/issue/
-
Human CO2 is a tiny % of CO2 emissions
There is also the yearly cycle of CO2 related to global vegetation, predominately the Northern Hemisphere which has more land (and hence vegetation) absorbing and releasing CO2 over the season. But that is a very small, short term, and essentially zero based variation, despite being a favorite graph of denialists.
[ I think that particular correlation and corresponding misleading graph, with long term CO2 growth and temperature changes being removed as (ahem) inconvenient facts, shows up at WUWT about once a month... ]
-
One Planet Only Forever at 07:00 AM on 17 February 2015NASA climate study warns of unprecedented North American drought
A few things:
- In the 2nd para, the 2nd and 3rd sentences should start with "It increases ...".
- In addition to the current drought in California, the rate of removal of water from the California aquifers to grow all those vegetables they provide to the market, amog other things, has exceeded the rate that the aquifers were replenished in non-drought years.
- "Business-as-usual" should be changed to "Business as the made-up global trade arrangements have inappropriately directed development through the past 30 years." That description avoids the misrepresentation that the way things currently are is somehow justified. There is nothing "usual" about the actions promoted and developed through the past 30 years. The past 30 years have been a grand experiment to enrich a few to the detriment of others, especially to the detriment of the future of humanity (Global GDP has grown far faster than the global population yet large numbers of tragically viciously miserably poor people still live brutal short lives). The fatal flaws in the made-up world trade arrangements encourage, prolong and defend unsustainable and damaging activities that enrich and empower the most callous among the population. "Clearly Unacceptable Global Business Activity" would be another way to define what is currently going on that needs to change.
Moderator Response:[PS] 3. Please stick the science. This is not the place to start of political war.
-
wili at 05:08 AM on 17 February 2015NASA climate study warns of unprecedented North American drought
The four corners area seems to be ground zero for the deepest levels of drought in any scenario. Interestingly and sadly, ten counties in just that area have just been declaired disaster areas: USDA Declares 10 Western Counties as 'Primary Natural Disaster Areas'
-
Tom Curtis at 04:01 AM on 17 February 2015Human CO2 is a tiny % of CO2 emissions
DSL @268, the change in CO2 forcing from year to year is very small. Therefore the greenhouse effect does not explain the correlation between CO2 and temperature at subdecadal, or even decadal time scales*. Rather, warm water absorbs less CO2 than does cold water. Therefore in warm years, less CO2 is absorbed, while in cold years, more is absorbed - thus explaining much of the sub-decadal correlation. (Biological activity also explains some of it.) The key point, however, is that even in the warmest years, the increase in atmospheric CO2 is less than the amount of CO2 pumped into the atmosphere by anthropogenic emissions. Ergo that increase is explained by the anthropogenic emissions, with only variations around the mean increase explained by changes in Sea Surface Temperature. This is one of those areas of climate science supported by so much evidence that denial of it falls into the "flat earth society" level of intellectual analysis.
* On time scales of thirty plus years, however, it explains nearly all of it, in the last and current century.
-
Tom Curtis at 03:50 AM on 17 February 2015Human CO2 is a tiny % of CO2 emissions
Rickaroo @266, I see what you mean. There is no correlation between CO2 concentrations and anthropogenic emissions at all, is there?

"The increase in CO2 concentration over the long term (1850-2005) almost exactly correlates (corr.: 0.997; R^2: 0.993) with cumulative anthropogenic emissions from all sources including Land Use Change (LUC). The close correlation has continued in recent times, with a correlation of 0.9995 when compared to the Mauna Loa record (r^2: 0.999). So exact a correlation would be extraordinary if anthropogenic emissions were not the cause of the increase in CO2 concentration."
(Source)
Just out of curriousity, what is the short term correlation between CO2 concentration and temperature that you base your claims on?
-
One Planet Only Forever at 03:00 AM on 17 February 2015Climate Intervention Is Not a Replacement for Reducing Carbon Emissions
Pursuit of "Climate Intervention" is a misdirection of human intelligence and ingenuity. Investigating and reporting the consequences of such pursuits is a necessary activity, but is also a 'misdirection of effort' from the sustainable advancement of humanity, or any of its societies and civilizations.
The current social-economic-political systems places 'pursuit of profit and popularity' well above the 'meaningful advancement of understanding toward the development of a sustainable better future for all'. That misplaced prioritization is a fundamental fatal flaw. It can easily lead to 'profitable and popular' damaging and unsustainable actions by a sub-set of a given generation of humanity on this amazing planet, to the detriment of all others.
Humanity could have a 'brilliant sustainable constantly improving future for all life on this amazing planet'. It just needs the chance to effectively focus efforts on the pursuit of that type of development, without anyone getting away with hindering the progress. That will require diligent monitoring and actions to thwart the many unacceptable attempts at personal gain to the detriment of others that will be made by people who only care about themselves.
The solution to that challenge deserves significant attention. Until that issue is effectively dealt with any developed better understandings of what is going, and efforts to try to better understand what is going on, will be less effective than they need to be.
-
DSL at 02:43 AM on 17 February 2015Human CO2 is a tiny % of CO2 emissions
And Rickaroo, scientists aren't arguing from the correlation between the CO2 and temp graphs. Why would you? The physical mechanism of the greenhouse effect is extremely well-established--to the point of being instrumentally measured from the surface. If you want to make the argument you've claimed, you'll need to remove the greenhouse effect.
Temp does drive CO2, of course, because the warming oceans absorb less atmospheric C. The process is a feedback to initial and ongoing warming, though.
-
Rob Honeycutt at 02:13 AM on 17 February 2015Human CO2 is a tiny % of CO2 emissions
Rickeroo... A "cursory look" is not going to "clearly show" anything.
Another "cursory look" actually contradicts exactly what you're saying. If temperature were driving CO2 then why hasn't the atmospheric concentration of CO2 also "flatlined" over the past 15 years?
-
greg_laden at 01:41 AM on 17 February 2015Why the Miocene Matters (and doesn’t) Today
"There is a lot of time in deep time, so it is important to remember that a mismatch between 16.9 Ma and 16.8 Ma is roughly the amount of time that Homo sapiens has been a species."
This is a constanlty chaning number, but the minimal date for something we might call *Homo sapiens" is in the hundreds of thousands of years, not under 100,000. Fully modern (amHS) is close to 200K, but many would argue that "archaic" and amHS are all valid H. sapiens, and the dats for that are approaching 500K.
This may not seem relevant to the present discussion but it is simply the case that your statement needs to be changed to something like "There is a lot of time in deep time, so it is important to remember that a mismatch between 16.9 Ma and 16.8 Ma is roughly ofe third to one fifth of the amount of time that Homo sapiens has been a species."
-
Rickeroo at 00:48 AM on 17 February 2015Human CO2 is a tiny % of CO2 emissions
Tom Curits @265
30% of the current atmospheric concentration would not have been in the atmosphere without anthropogenic emissions.
Any cursory look at two readily available data sets, Mauna Loa CO2 and global temperature by year, clearly shows that temperature is a strong driver in how much CO2 ends up in the atmosphere on a yearly basis. Note especially the 600% difference in 1992's and 1998's CO2, clearly based on temperature.
Also look at CO2 increase by year from 2000-2015, hardly changed at 2ppm per year despite a 68% increase in global emmisions over the same time period. Why isn't the rate of CO2 increase responding to human emissions? Because CO2 reponds far more to temperature, which has flatlined for 15 years.
Moderator Response:[Rob P] - Surface warming still continues.....

And the last 16 years has seen a 50.3% increase in heat taken up by the Earth's climate system than the previous 16 years. Which means there's a lot more warming in the pipeline. The following image is from the IPCC AR5 WG1 on the oceans.

-
Tom Curtis at 22:08 PM on 16 February 2015Newcomers, Start Here
cagwskeptic @245, was the medieval warm period as warm as, or warmer than temperature post 1998?
Moderator Response:[PS] This is an inappropriate thread for such a discussion. Till the poster can demonstrate something other than unsubstantiated sloganeering, then please do not engage.
-
cagwsceptic at 19:56 PM on 16 February 2015Newcomers, Start Here
There is no correlation between CO2 emissions and global warming. The two are not linked closely together as inferred by Mann's hockey stick graph. Co2 is driven into and out of the environment by global temperature rises and falls.
Moderator Response:[JH] You are skating on the thin ice of sloganeering which is prohibited by the SkS Commets Policy. In addition, you have provided no references to substantiate your assertions. Future posts of this nature will be summarily deleted.
-
Trevor_S at 19:54 PM on 16 February 2015Climate Intervention Is Not a Replacement for Reducing Carbon Emissions
There is no substitute for dramatic reductions in greenhouse gas emissions to mitigate the negative consequences of climate change
I hope you guys are all leading by example ? I know I have been keeping my emisons as low as I can: no flying for holidays, no driving, cut back on eating meat, no meat eating pets, use only renewable energy and only voting for politicans with effetive mitigation strategies ie The Greens... the low hanging fruit on the the emissions reduction tree. I do more than that but that's the minimum everyone needs to do to ensure we start mitigating effectively.
Moderator Response:[Rob P] - Not being a hypocrite is important but, apart from a feeling of superiority or smugness, your own personal measures aren't even remotely enough to stem the problem. Unless there is a worldwide mobilization to rapidly decarbonize the global economy all you're achieving is shuffling deck chairs on the Titanic. Having some perspective is important too.
-
jyyh at 16:19 PM on 16 February 2015Marotzke & Forster Respond to Nic Lewis
just checking the password still works. ok.
-
Tom Curtis at 10:34 AM on 16 February 2015The oceans are warming so fast, they keep breaking scientists' charts
Michael Sweet @54:
"The argument seems to me to be semantical. I am sure that if we discussed it we would agree."
I'm sure we would. I think, however, I was making a significant point. Two actually. First, that unsupported rubbish is easilly dismissed by any reasonable person. If they do not provide the nitty-gritty of their argument the correct assumption is that there is no nitty-gritty there, and that the argument is therefore baseless until they prove otherwise. It is one of the marks of rational discourse that when making claims, you back them with argument and evidence - not just assume they are right if the people with whom you broach the idea are inexpert enough (or properly dismissive enough, or just otherwise occupied) to not actually pick it apart in front of you. Only fools assume that the failure of others to disprove some vague idea means the idea is sound, let alone true.
With regard to your "skeptical" responses to my "killer arguments", I am sure that many "skeptics" would argue just as you suggest. In doing so they merely demonstrate that they are in fact "deniers", ie, that their objection to AGW is not rational, is not evidence based, and is really a flim-flam show. We can hope that onlookers will be rational enough to recognize that. There is no hope of the "skeptics" such as bindrdunit recognizing it, no matter how copious your evidence or meticulous your argument.
"You obviously read a lot of papers and have a terrific filing system."
I do. It is called Google ;)
-
michael sweet at 10:15 AM on 16 February 2015The oceans are warming so fast, they keep breaking scientists' charts
Tom,
The argument seems to me to be semantical. I am sure that if we discussed it we would agree.
As far as your three points, for point two the deniers argue that scientists have to provide evidence to prove any wild suggestion they can think of is incorrect. Deniers do not have to provide evidence.
For point three all deniers know that peer review is pal review so blog posts are the equivalent (or better) of peer reviewed articles. Why listen to experts when you can read a blog?
For point one Zeke Hausfather's graph you posted on another thread proves that scientists are conspiring to raise the land temperatures with their right hand while, at the same time, conspiring with their left hands to lower the ocean temperatures. It is obviously a very deep conspiracy or they could not keep the secret from their right hands!
It seems to me that Zeke's graph completely puts to bed any claims of tampering with the data by the adjustments made.
One of my main points is how time consuming and difficult it is to cite exactly the correct graph or paper to make your point. You obviously read a lot of papers and have a terrific filing system. It still takes a lot of time to make the detailed posts you provide. Thank you for all your effort, I have learned a lot from your posts. Both scientific information and how to frame a scientific argument. I read a lot here but rarely post because your posts are so good.
-
One Planet Only Forever at 05:11 AM on 16 February 2015Climate Intervention Is Not a Replacement for Reducing Carbon Emissions
"Climate Intervention" should not be deployed at any time.
Even at some future date it will be abused to excuse a lack of rapidly reducing the impacts of burning fossil fuels, particularly to excuse further delays by the most fortunate who refuse to give up any of the clearly illigitmate unsustainable and damaging ways of living they are addicted to getting away with.
"Attitude Intervention" to force the most callous pursuers of personal benefit to behave decently, or fail quickly and repeatedly, is the required intervention and adaptation.
The future of humanity is clearly at stake here. The threat is clear. And the interests of people who pose the greatest threat are also clear. Wasteful damaging unsustainable mass-consumerism must be curtailed, particularly by the most fortunate, if there is to be any chance of 'sustainable economic growth' and a future for humanity and advancing any of its civilizations.
People who are wealthy and powerful have no excuse. They canot calim to not be aware of this. All that is left is for such a person to admit they care and will change, including forcing change on the undeserving unwilling trouble-makers. And that is where the curret socio-economic-political system fails clearly fails. Many fully aware leaders deliberately mislead and can be popular because of their deliberate damaging deceptions.
That may seem harsh, but the irrational damaging global trade systems created in the past few decades are clearly causing a major part of the problem. In the current world of trade national sovereingty is limited by laws when 'free trade is impacted'. Yet the same people who will abuse those laws to their advantage will demand that national sovereignty must be respected when it comes to 'reluctance to act responsibly to reduce global human impacts'. Those unacceptable people will try to profit from 'climate intervention'. And there is little doubt that what they will push for will be as unsustainable and damaging as the global trade actions they try to profit from. They are clearly in need of "Attitude Intervention".
-
MA Rodger at 20:41 PM on 15 February 2015The oceans are warming so fast, they keep breaking scientists' charts
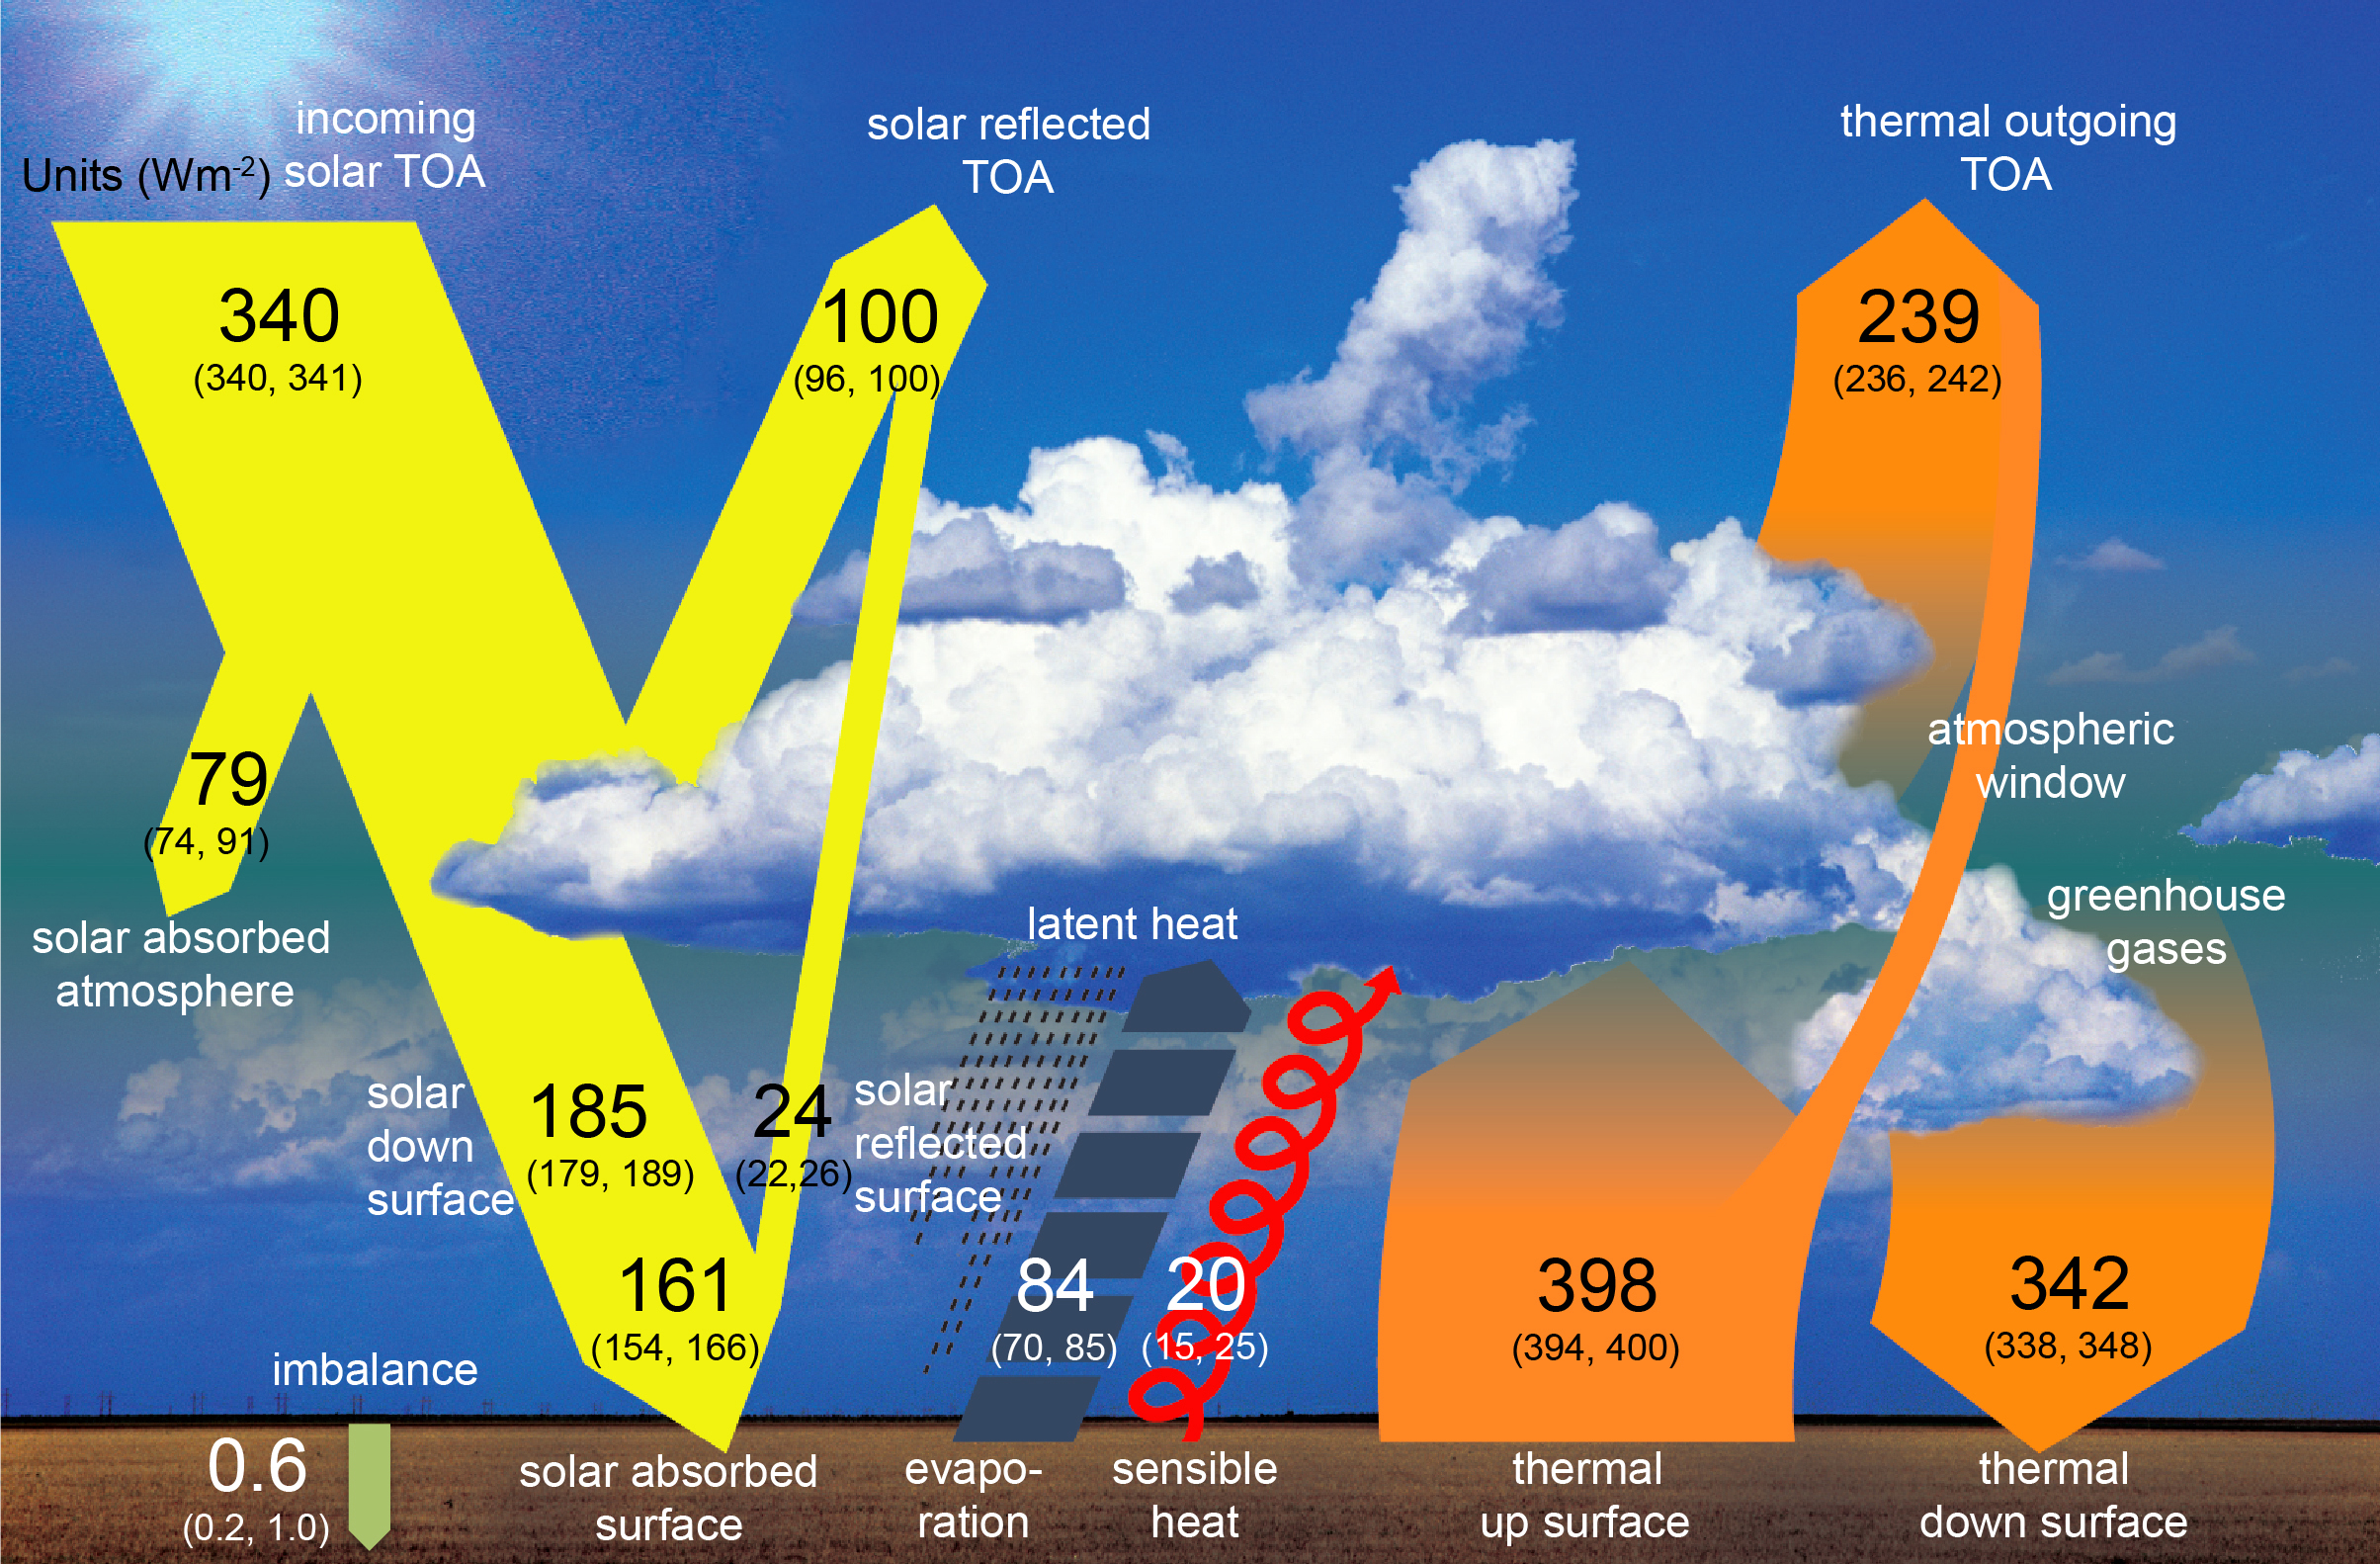
I would have thought the main derision to aim at bindrdunit @49 would be at his claim that " The greatest energy transfer component in oceans is not from GHGs, but from evaporation."
Evaporation can be measured quite reliably globally as the atmsosphere has a small capacity for accumulating water vapour and so the resulting rainfall, something easily and often measured, provides a global total, most of which will be evaporated from ocean sources. So (according to AR5 Figure 2.11) we are talking 84 / 0.71 = 118Wm-2(ocean). Back radiation over oceans is probably not greatly different from the global figure of 342Wm-2 which can be taken as a ballpark figure. Again this global average level for back radiationt is not difficult to estabish.
So what bindrdunit @49 is telling us that 118 > 342 which patently untrue.
Of course, bindrdunit @49 might have meant his words to be interpreted in a different fashion but if that is so, he should consider using different words, indeed those words whose meaning coincide with the meaning he wishes to convey. After all, that is what the rest of the human race generally manage to achieve.
Moderator Response:[JH] Please keep it civil.
-
Tom Curtis at 15:37 PM on 15 February 2015The oceans are warming so fast, they keep breaking scientists' charts
michael sweet @51, actually its fairly easy to argue against Bindrunit. The top, killer argument against his position is that science is not a conspiracy. As his theory requires global conspiracy by climate scientists, it therefore refutes itself. We can then move on to the second killer argument, that which is proposed without evidence can be dismissed without evidence. He provides no evidence so it is rightly dismissed. The third killer argument is, let's see it in peer review. The simple fact is that peer review is a process of testing your arguments against those who are best able to shoot them down. A person who will only advance their views on blogs, or in books or articles for the public therefore shows that they do not expect their arguments to survive criticisms from the well informed. We should therefore take their implicit confidence in their theory seriously, and assume as they implicitly do that their position would indeed fail a proper test.
We could also, of course, expand on the implications of his theory, eg, land should warm slower than the ocean as his mechanism only applies to the ocean, and implies a reduced energy transfer to the atmosphere, and show that they are simply contrary to the facts. Or the implication that the maximum warming in the ocean will be along shipping lanes rather than in the Arctic. (That one is a little trickier. I think the evidence is against him, but would need to do analysis to confirm it.)
Finally, we could simply refute his claim that all the forcings are simply made up. But I see no reason to put more effort into refuting his claim than he has in advancint it, so I will stick with the first thee killer arguments.
Prev 614 615 616 617 618 619 620 621 622 623 624 625 626 627 628 629 Next


